ระบบได้ส่งลิงก์สำหรับตั้งรหัสผ่านของคุณไปที่: ต่อไปนี้คุณจะต้องใช้รหัสผ่านในการเข้าถึงสินค้าที่คุณได้ซื้อ
รับภาพประกอบ 25 ภาพหรือวิดีโอ 3 รายการเมื่อทดลองใช้ฟรี
เพิ่มตัวกรองใหม่แล้ว
เรียงลำดับตาม

530 ผลลัพธ์สำหรับ correlation analysis ใน วิดีโอ

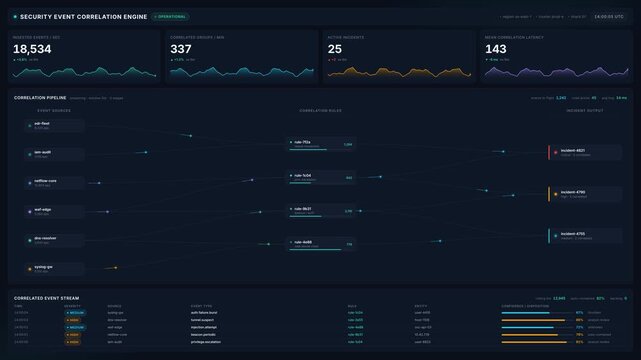
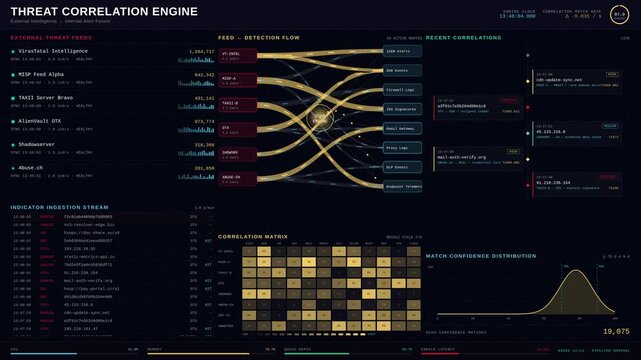
Security event correlation engine dashboard interface with live data streams incident alerts, for cyber threat monitoring, network security analysis, enterprise risk management
00:20
HD
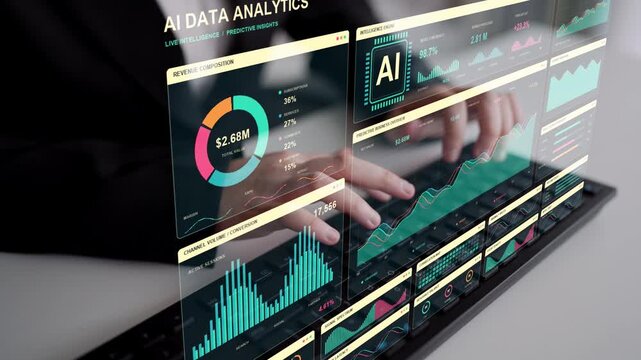
Model performance is examined through accuracy, precision and recall alongside forecasts, resource load and data quality in an integrated AI analysis workflow.
00:12
HD
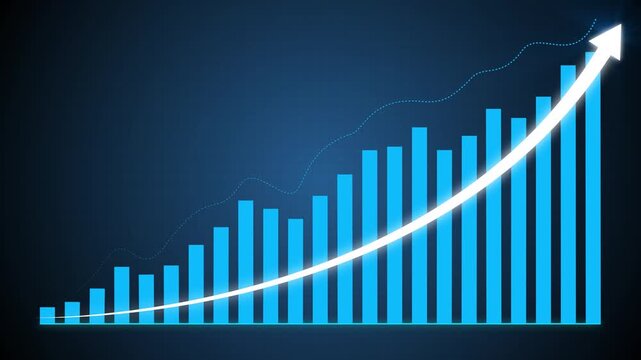
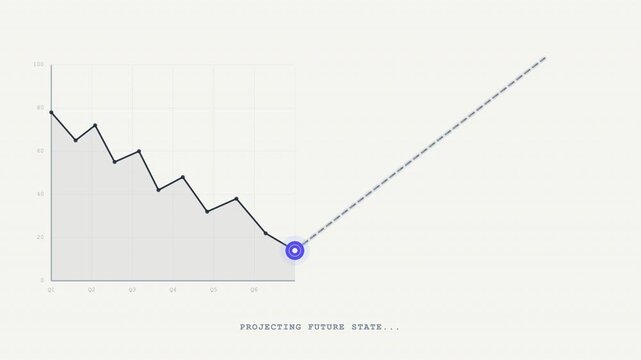
Business growth concept in allusive graph chart showing marketing sales profit increasing to target . Excellent financial status of corporate business rise up.4k animation video graph
00:10
HD
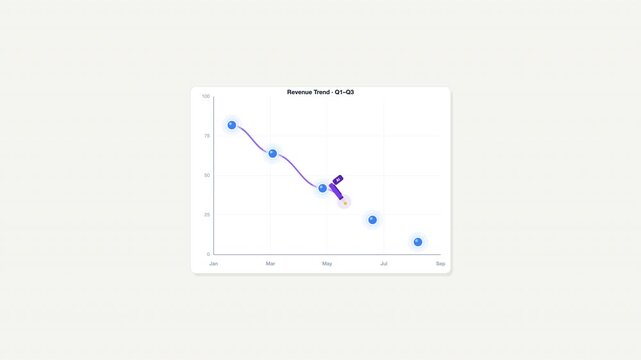
Revenue trend 6m line chart with blue circles and purple wavy line. Suitable for financial presentations, reports, and data analysis projects.
00:10
HD
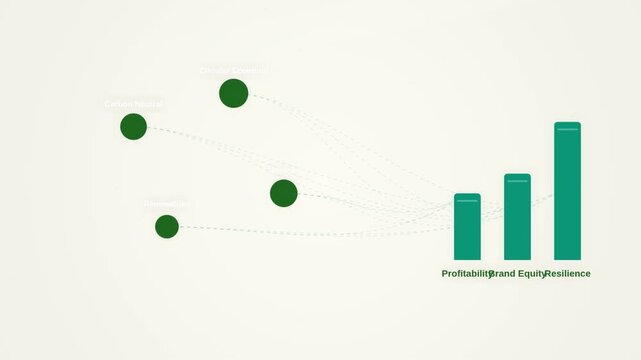
Abstract infographic with green dots connecting to bars representing data analysis and growth
00:10
HD
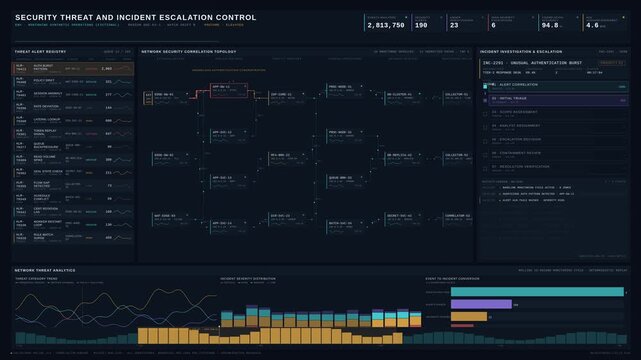
Cinematic security operations dashboard monitoring network threats, incident escalation workflows, and real-time alert correlation in a dark enterprise SOC environment.
00:15
HD
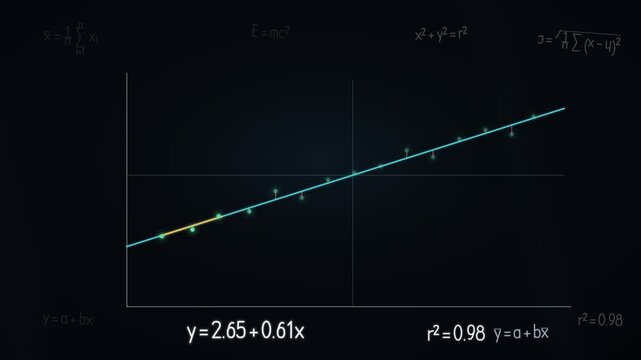
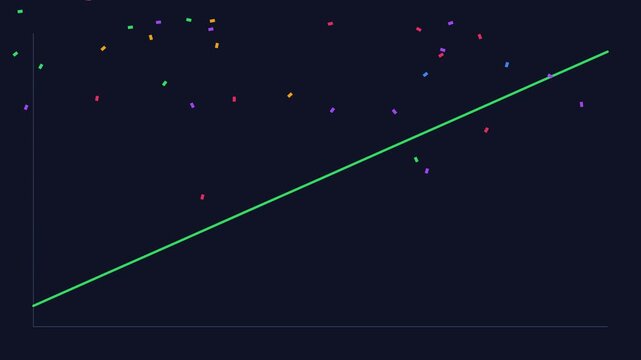
Animated Linear Regression Chart With Trend Line
00:08
HD
A dynamic image illustrating the correlation between increasing quality and decreasing costs in business. It showcases a glowing mouse held in hand, symbolizing technology-driven solutions. Qubit
00:14
HD
Futuristic data dashboard interface with analytics charts and graphs
00:10
HD
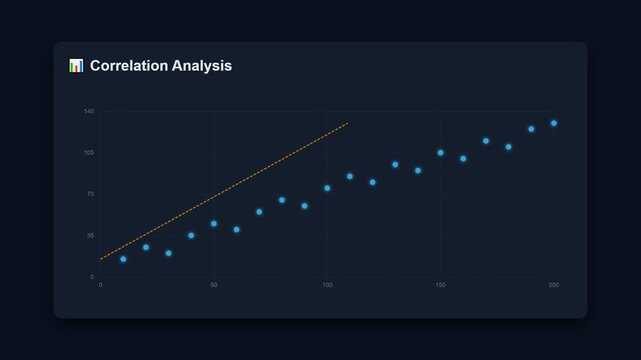
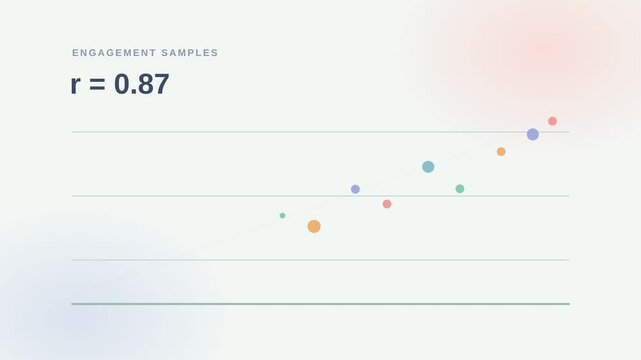
Correlation analysis scatter plot chart animation dark ui
00:10
HD
Advanced digital data visualization statistical charts futuristic analytics interface. market research, financial reports, enterprise dashboards, executive presentations, forecasting business strategy
00:19
HD
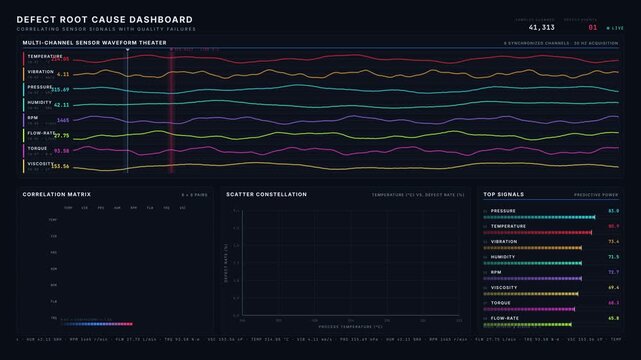
Explore a sophisticated defect root cause dashboard that correlates sensor signals with quality failures, showcasing dynamic waveforms and a correlation matrix in dark mode.
00:15
HD
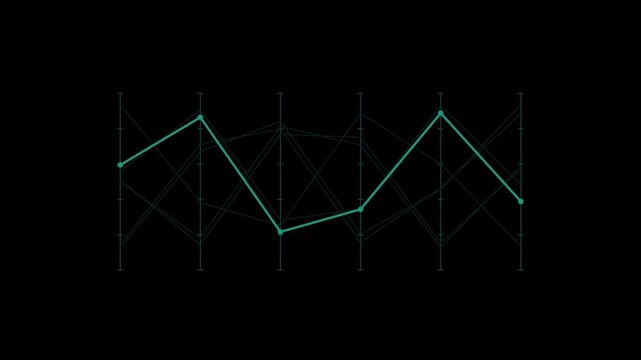
Parallel coordinates connecting business metrics in cyan
00:10
HD
Data regression analysis chart showing trend line fitting over scatter plot points for statistical modeling and financial forecasting
00:10
HD
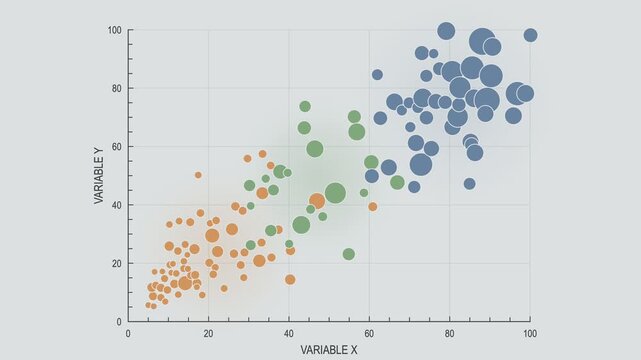
Animated bubble chart with varied bubble sizes with alpha channel
00:10
HD
Research data analysis motion graphics, scatter plot with regression trend line and magnifying glass scanning data points, heatmap, histogram and progress rings, scientific statistics dashboard, text
00:12
HD
Visualizing positive correlation concepts with upward trends, smart phone data display, rising arrow, and a thought bubble showing a smiling face
00:17
HD
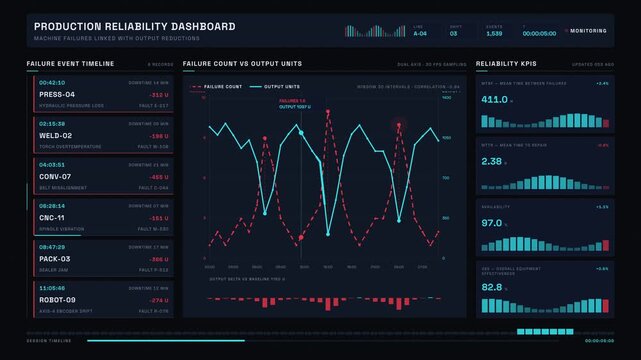
Production reliability dashboard visualizing machine failures and their impact on output reductions with animated graphs and KPI tiles in a sleek modern design.
00:15
HD
A scatter plot visualization displaying data correlation on a dark background
00:10
HD
Glowing Bubble Scatter Plot Data Visualization Loop
00:10
HD
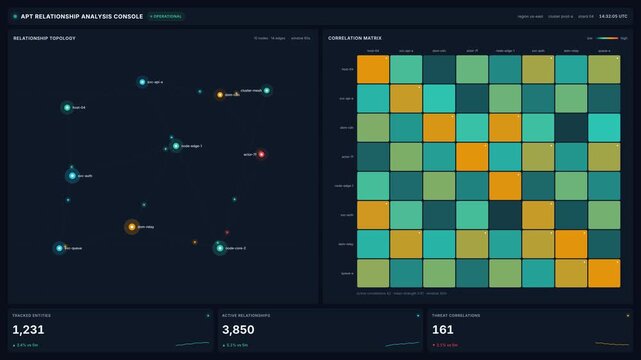
Futuristic apt relationship analysis console for network topology graph correlation matrix, for cybersecurity monitoring, threat detection, data visualization
00:20
HD
A woman works on a laptop. Neural computing and predictive analysis share a workspace with training curves and comparison metrics, illustrating how AI models are monitored and assessed.
00:16
HD
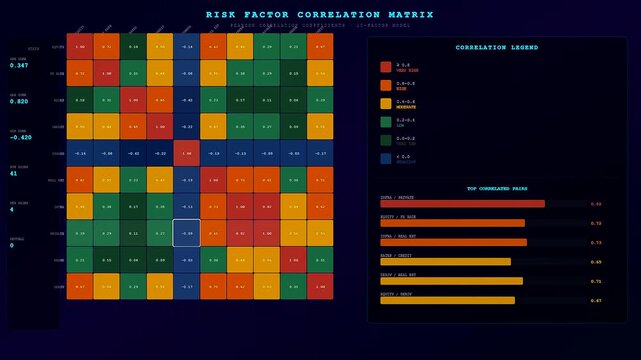
A quantitative risk assessment data visualization displays complex financial correlation metrics and color coded grids for analytical review inside a dark user interface dashboard software
00:06
HD
Data analysis software, statistical tools, research presentations. Visual representation of interconnected data points with adjustable correlation threshold.
00:10
HD
Dynamic motion of a scatter plot with a trend line illustrating high correlation in animated data visualization.
00:10
HD
A sophisticated threat intelligence platform visualizes the correlation between external indicators and internal security alerts, showcasing live data analytics with vibrant colors and engaging.
00:15
HD
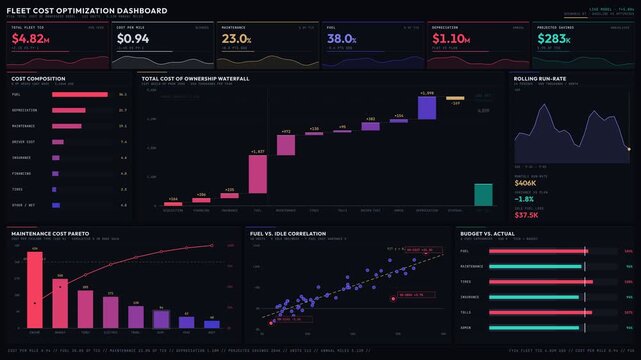
A sleek and modern fleet cost optimization dashboard featuring animated KPI cards, waterfall chart, and various cost analysis visuals in a premium financial data aesthetic.
00:15
HD
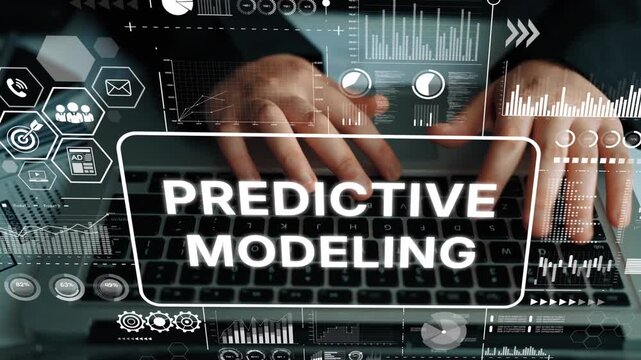
Modern Technology in Predictive Modeling with Hands on Laptop Surrounded by Data Visualizations and Graphical Elements. Asymptotic smart data analytic.
00:20
HD
Neural Connections in Cosmic Data Stream
00:05
HD
Cyber security threat alert motion featuring digital warning and data breach code background, for network protection, concepts and information, technology infrastructure vulnerability analysis
00:10
HD
Grey and white neural layers on a dark field. Statistical modelling, regression analysis and data science
00:10
HD
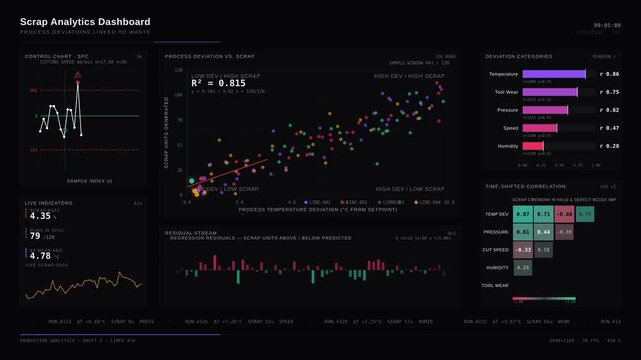
An advanced scrap analytics dashboard visualizing process deviations linked to waste through detailed scatter plots, control charts, and correlation matrices in vibrant colors.
00:15
HD
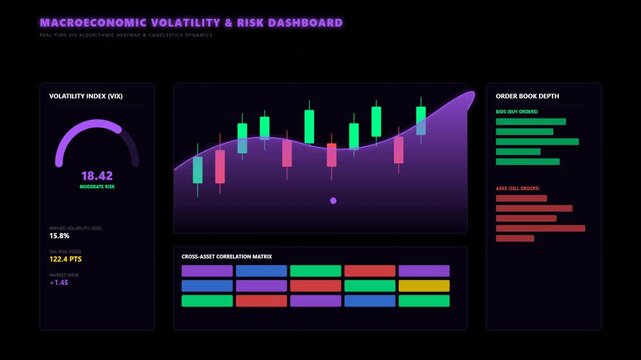
Macroeconomic Volatility and Financial Market Risk Dashboard Visualization with Candlestick Charts
00:10
HD
A scatter plot chart displays several white dots of varying size positioned along an axis grid representing simple data distribution analysis view
00:10
HD
Scatterplot displays data points, histogram shows distribution. Blue tones dominate, creating abstract visualization.
00:07
HD
Data Correlation Analysis and Multivariable Scatter Plot Clusters
00:10
HD
Negative correlation analysis a declining trend in data points from a scatter plot, impacting human interaction and health results, emphasizing risk and statistical research
00:17
HD
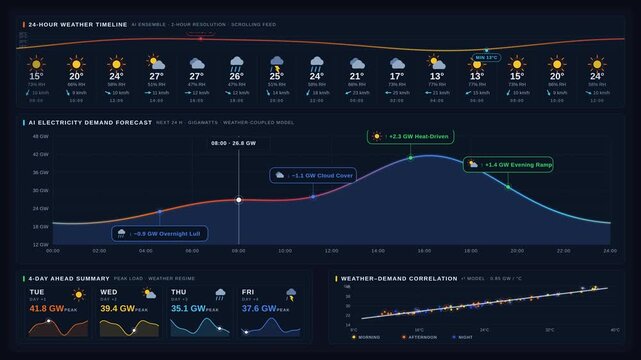
Explore an advanced AI demand prediction interface featuring weather-driven electricity consumption forecasts with dynamic visualizations and real-time data analysis.
00:15
HD
Medium shot of a colorful commodity price correlation matrix heatmap on a computer screen with sharp focus on a cluster of strongly correlated assets.
00:05
HD
Animated Scatter Plot Showing Data Points Forming a Downward Curve on a Graph.
00:12
HD
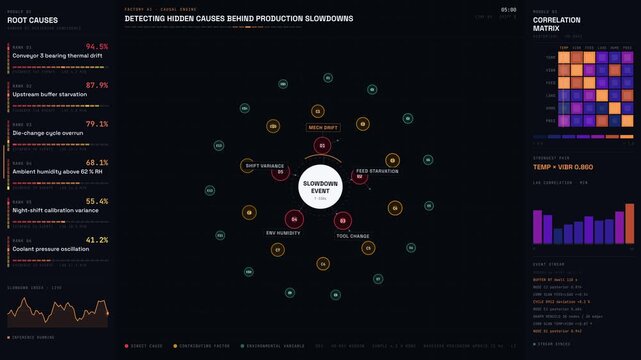
A sophisticated AI dashboard visualizes hidden production slowdown causes with a dynamic network graph and detailed correlation matrix in dark mode for advanced analysis.
00:15
HD
A person types on a keyboard. AI-assisted analysis links acquisition channels and customer retention with growth expectations, using forecasts and quality checks to support planning.
00:12
HD
Data Analytics Convergence Abstract Background
00:15
HD
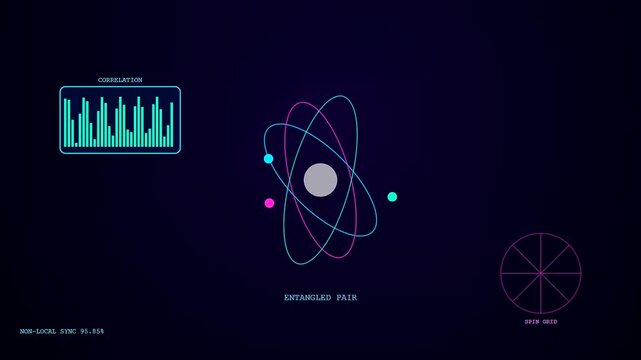
Three neon colored atomic models representing quantum cryptography displays moving across a dark digital interface to show data correlation and spinning orbits in synchronized patterns
00:06
HD
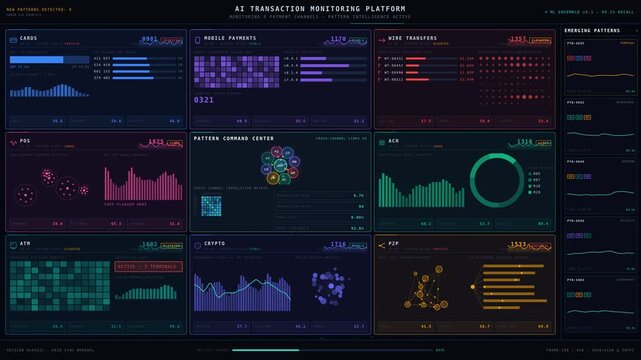
Explore the advanced AI transaction monitoring platform visualizing emerging fraud patterns across diverse payment channels with a sleek, multi-channel intelligence layout.
00:15
HD
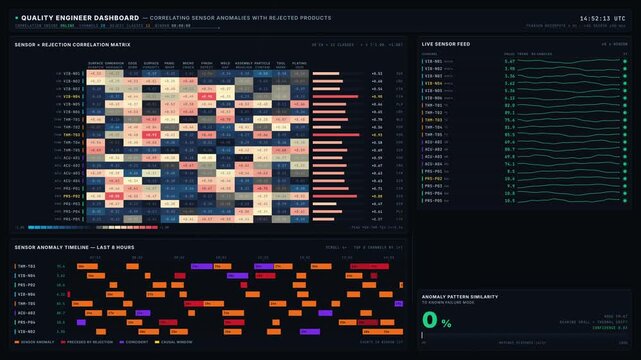
A quality engineer dashboard visually correlates sensor anomalies with rejected products using a heatmap and timeline, showcasing real-time data analysis and insights.
00:15
HD
Parallel coordinates connecting business metrics in white
00:10
HD
A sleek robot stands in a modern office, analyzing financial trends with digital graphs. This futuristic scene blends technology and finance. Perfect for business concepts. Synapse
00:10
HD
Predictive Analytics Scatter Plot Regression Analysis Motion Graphic
00:10
HD
Animated scatter plot chart showing positive correlation trend
00:10
HD
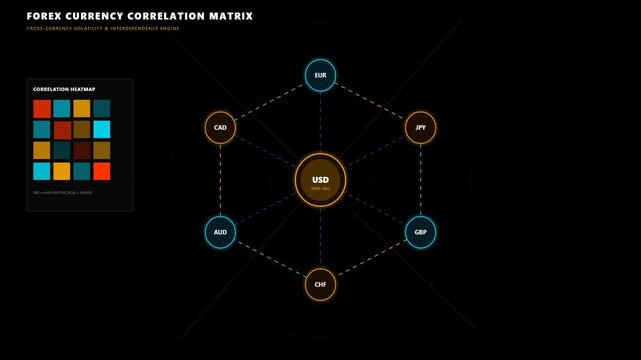
Forex Currency Correlation Matrix Visualization Chart for Financial Market Trading Analysis Data
00:10
HD
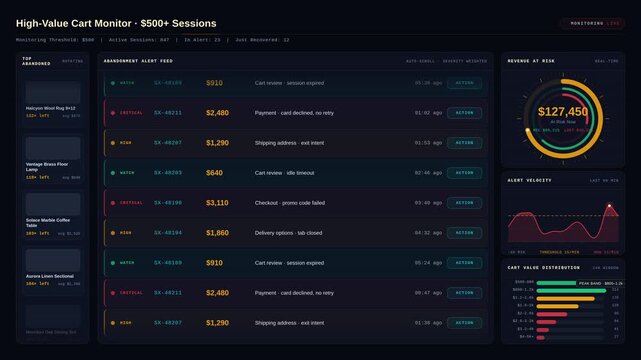
Explore a detailed shopping cart analytics dashboard that compares product discounts and abandonment patterns with vibrant color coding and data visualizations for insights.
00:15
HD
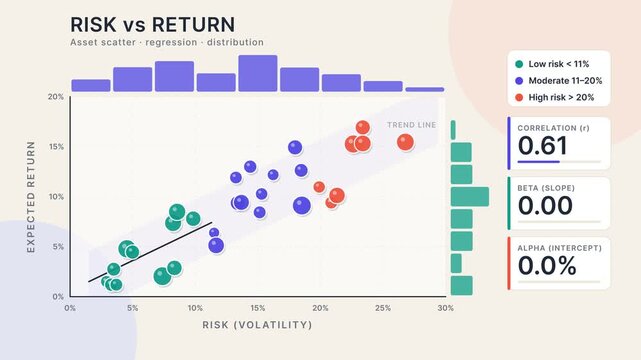
Animated Financial Risk vs Return Scatter Plot with Regression Trend Line and Data Metrics, Motion Graphics
00:10
HD
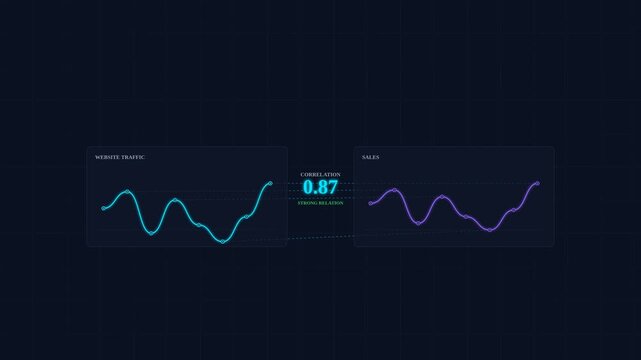
Data Correlation Finding Relationships Between Different Datasets
00:08
HD
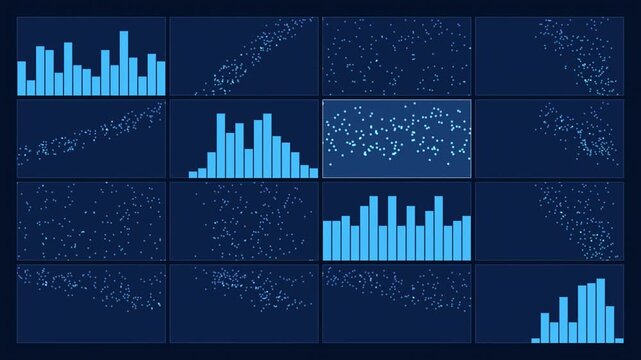
Grid displays various blue plots. Histograms, scatterplots, data visualization, patterns present. Dark background enhances contrast.
00:07
HD
Heatmap Grid Color Wave
00:10
HD
Negative correlation concept a cause and effect relationship where one element's increase leads to another's decrease. Impacting user ratings. Customer satisfaction
00:17
HD
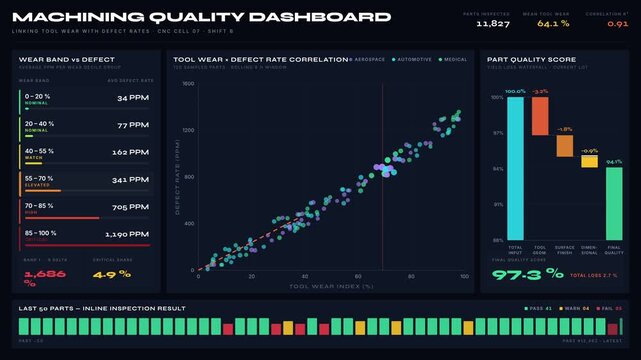
Analyze the Machining Quality Dashboard that links Tool Wear with Defect Rates using a dual-variable correlation chart and detailed data visualizations.
00:15
HD
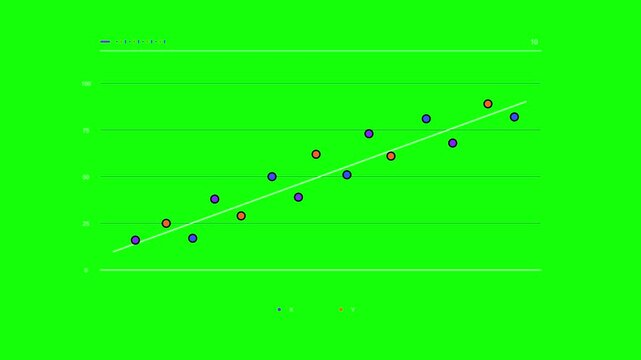
Research Correlation Scatter Plot with an Upward Trend Line on a Bright Green Background
00:10
HD
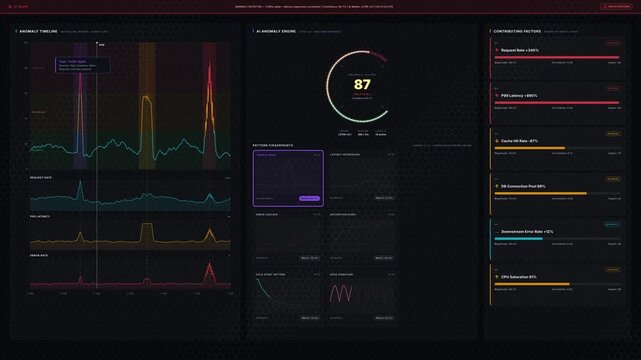
Explore an AI-powered API anomaly detection dashboard illustrating traffic spikes, latency regressions, and failure patterns in a captivating dark-themed interface.
00:15
HD
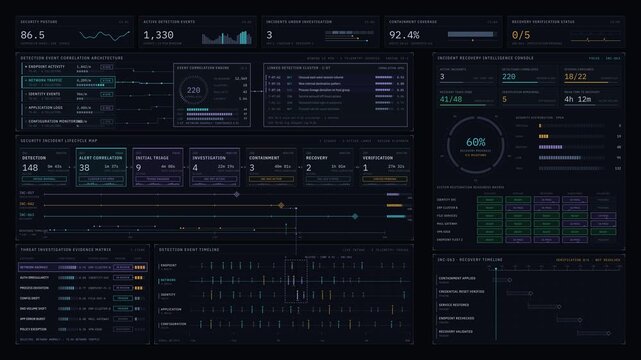
Sophisticated cybersecurity SOC dashboard animation tracking incident lifecycle stages from detection to recovery with correlated telemetry data and status indicators.
00:15
HD
Hands type on a laptop. Prediction intervals, feature impact and ensemble weights reveal different aspects of AI analysis, supporting interpretation of model behavior and data trends.
00:12
HD
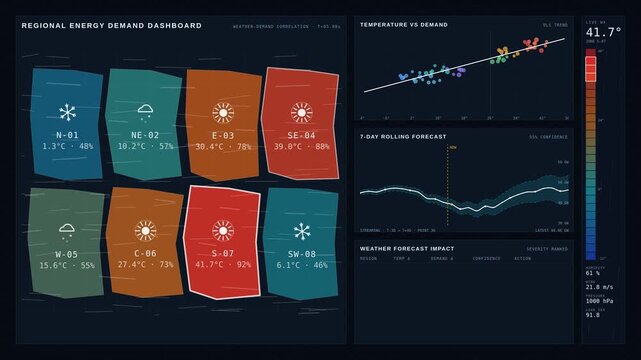
A sophisticated regional energy demand dashboard visualizes weather impacts and consumption forecasts with animated maps and time-series data in dark mode for environmental analytics.
00:15
HD
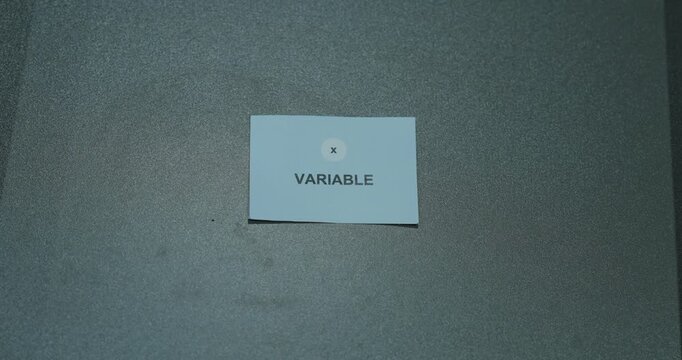
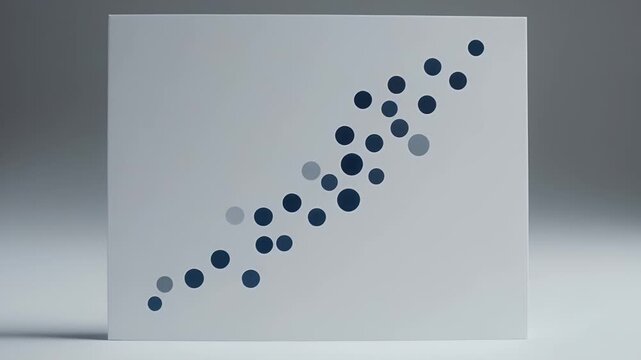
Variable text on a white paper card against a gray background, representing changing factors, data analysis and scientific concepts
00:16
HD
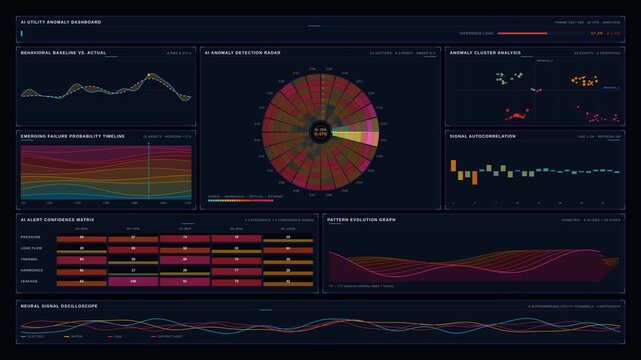
Explore an AI Utility Anomaly Dashboard showcasing unusual network behavior and emerging failure detection with vibrant colors and immersive cybernetic design in 4K resolution.
00:15
HD
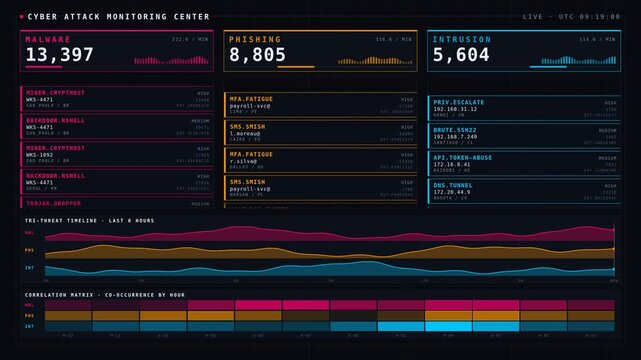
A vibrant 4K cyber attack monitoring center visualizes malware, phishing, and intrusion alerts with a tri-color threat system and dynamic data feeds in real-time.
00:15
HD
Focused view of a vibrant heatmap displaying diverse commodity correlations capturing the intensity of price relationship patterns on a digital monitor.
00:05
HD
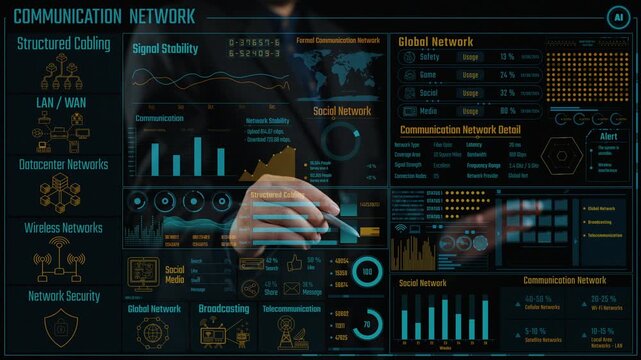
Explore a detailed visualization of a communication network featuring various charts and diagrams on stability, security, and social media for effective technology management. Cipher
00:09
HD
Abstract scatter plot graphic representing data analysis and growth.
00:05
HD
Glowing neon magnifying search icon on glowing neon business graphs and financial growth and profit through data analysis and graph sign animation
00:10
HD
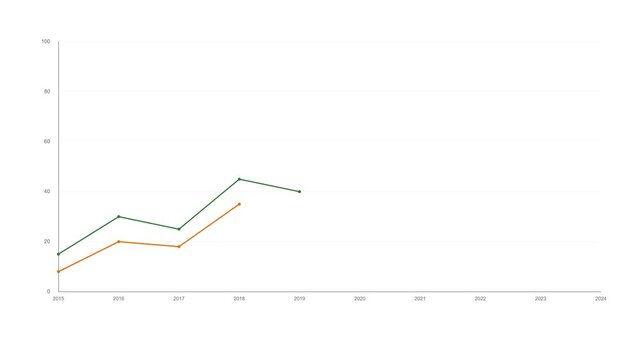
Comparative dual-line chart showing yearly financial value trends, business analytics style
00:15
HD
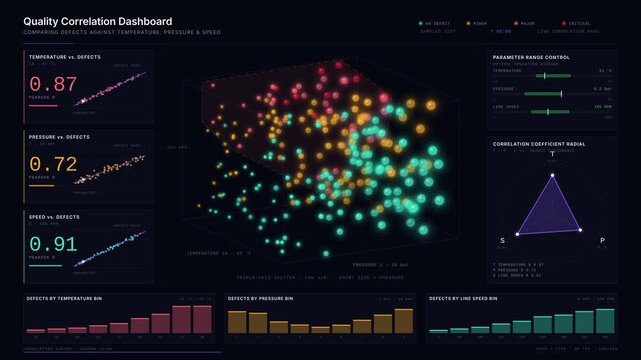
Explore a comprehensive Quality Correlation Dashboard showcasing defects against temperature, pressure, and speed with stunning 3D scatter plots and vibrant color coding.
00:15
HD
Data professional highlights trends through visual analysis in workspace
00:12
HD
Analysis pattern detection HUD with glowing green scattered particle
00:08
HD
Parallel coordinates connecting business metrics in cobalt
00:10
HD
Amber scatter plot falling trend analysis animation dark
00:08
HD
A scatter plot showing a negative correlation between two numerical variables
00:10
HD
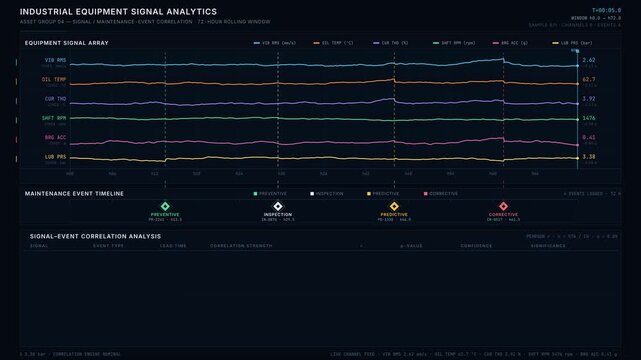
Industrial data dashboard showcasing correlated equipment signals and maintenance events with vibrant color-coded visualizations and analytical insights for effective monitoring.
00:15
HD
Dot particle infographic morphs scatter plot into histogram, donut chart, funnel and world map dashboard
00:15
HD
Scatter plot points converging to trend line animation
00:08
HD
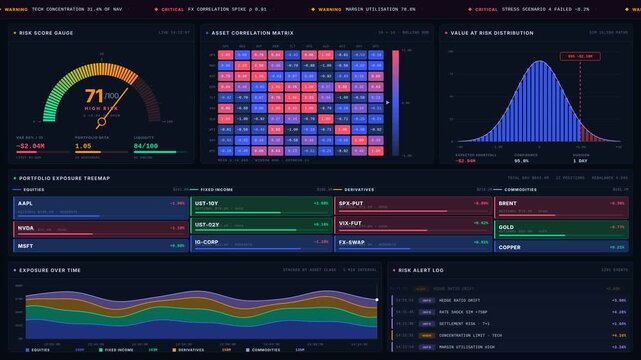
Explore a sophisticated 4K financial risk dashboard featuring a dark interface with vibrant gauges and charts, designed for monitoring risk metrics and alerts effectively.
00:15
HD
Science presentations, educational materials, research articles, and digital marketing campaigns related to data analysis and scientific progress.
00:06
HD
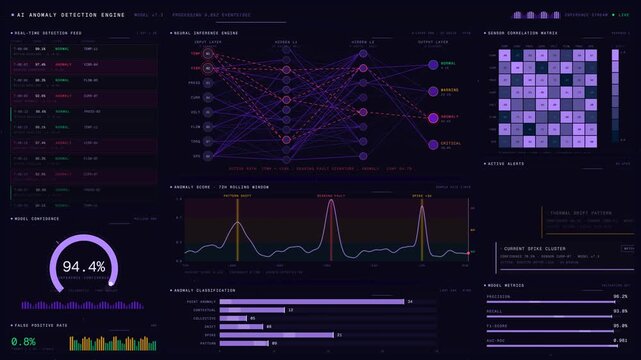
Explore the advanced AI industrial anomaly detection dashboard featuring a neural network visualization with real-time data analysis and dynamic anomaly scoring metrics.
00:15
HD
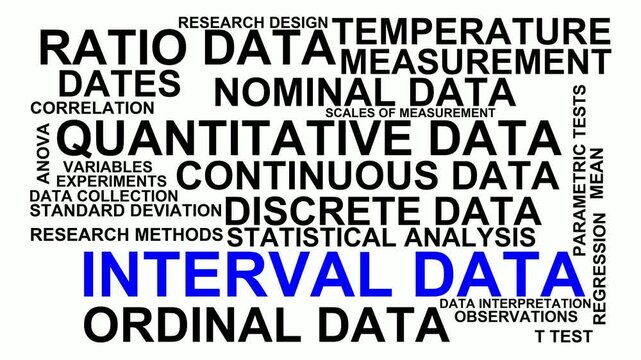
Interval Data Word Cloud
00:11
HD
Digital data correlation scatter plot with glowing points
00:10
HD
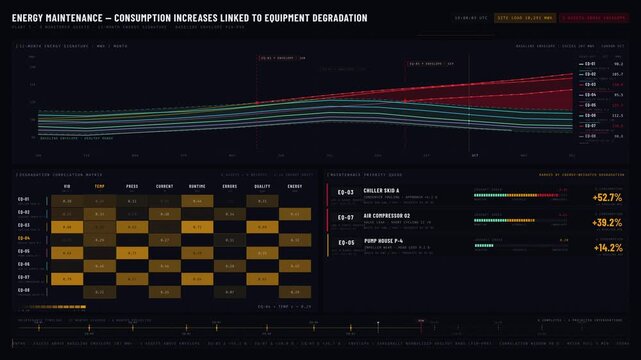
Explore the Energy Maintenance Dashboard showcasing consumption increases linked to equipment degradation with predictive analytics and real-time data visualization.
00:15
HD
Dynamic Molecular Interaction Visualization Amidst Cellular Membrane Featuring Vibrant Blue Particles in an Abstract Biological Setting
00:08
HD
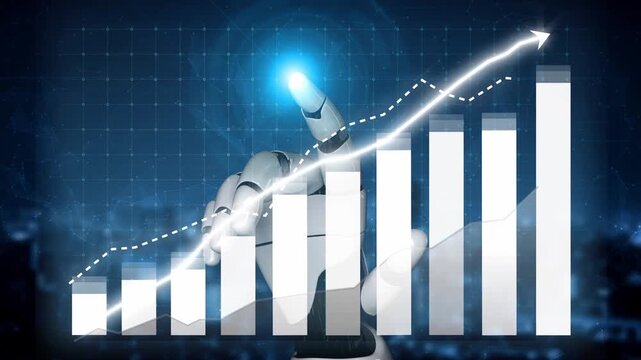
A creative representation of a robotic hand pointing at a rising graph, illustrating technological advancements in business analytics and future growth potential. Copula
00:10
HD
Deep blue data points fading into the dark. Data mining, pattern discovery and statistical modelling background
00:10
HD
glowing neon business data graph bar analysis by magnifying glass icon. business growth concept animation magnifying glass with data analysis icon. 4k video animation.
00:10
HD
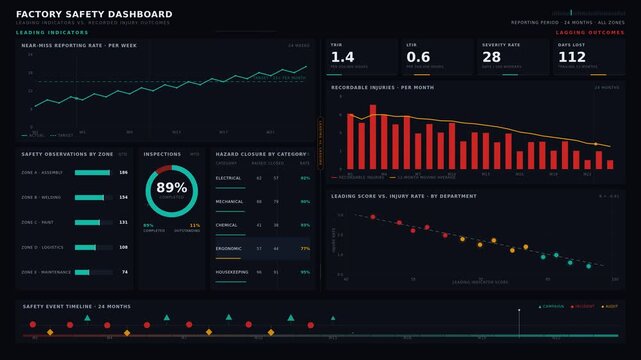
Explore a factory safety dashboard that visually contrasts leading indicators with recorded injury outcomes, featuring detailed charts and KPIs in a dark mode interface.
00:15
HD
Positive correlation concept data analysis, comparison of results, and evaluating different factors contributing to outcomes with scales, a smiling face, and a magnifying glass
00:17
HD
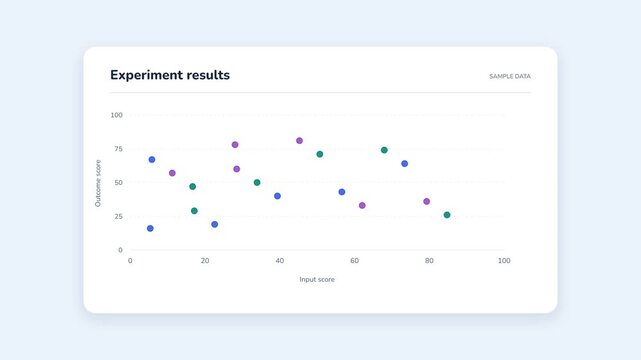
Experiment Results Data Visualization Chart Showing Correlation and Statistical Analysis Points
00:10
HD
Data scatter plot chart with linear regression trend line animation for business analytics and financial growth analysis 4k
00:10
HD
Parallel coordinates connecting business metrics in teal
00:10
HD
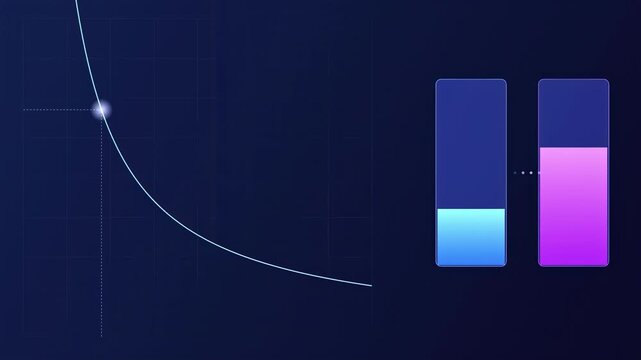
Graph displays decreasing curve, paired with two vertical bars. Bars show color gradients, blue transitioning to purple. Data visualization concept.
00:07
HD
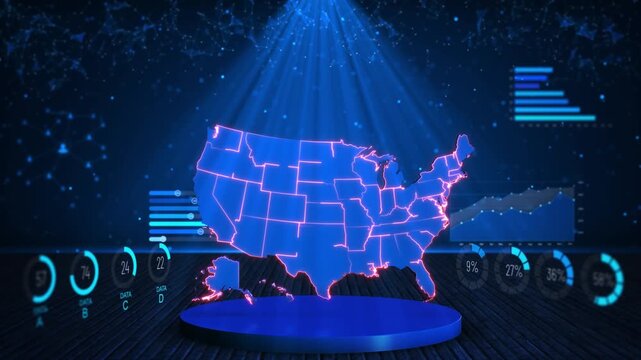
Futuristic America data dashboard a glowing map, charts and performance indicators. for corporate analytics, population research, forecasting, economic reports and strategic planning videos.
00:20
HD
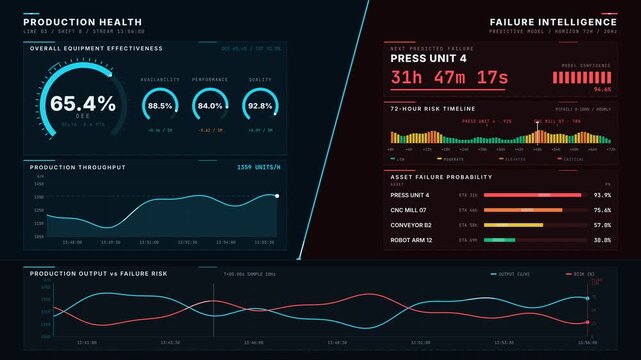
Explore a sleek smart manufacturing dashboard that displays real-time production health metrics alongside predictive failure forecasts in an innovative split-interface design.
00:15
HD
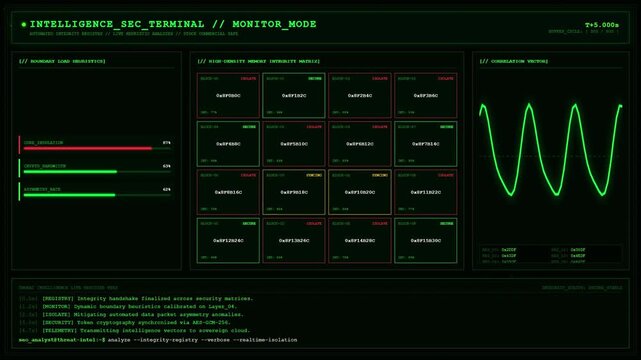
Green Sci Fi Intelligence Security Terminal HUD Interface.
00:15
HD
The man carefully analyzed the graph, searching for trends and patterns in the data presented.
00:06
HD