ระบบได้ส่งลิงก์สำหรับตั้งรหัสผ่านของคุณไปที่: ต่อไปนี้คุณจะต้องใช้รหัสผ่านในการเข้าถึงสินค้าที่คุณได้ซื้อ
รับภาพประกอบ 25 ภาพหรือวิดีโอ 3 รายการเมื่อทดลองใช้ฟรี
เพิ่มตัวกรองใหม่แล้ว
เรียงลำดับตาม

38,098 ผลลัพธ์สำหรับ control chart ใน วิดีโอ

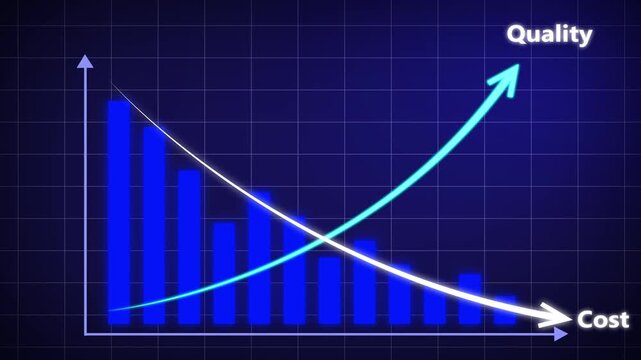
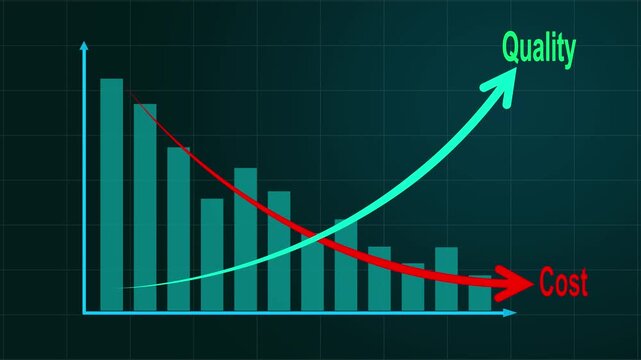
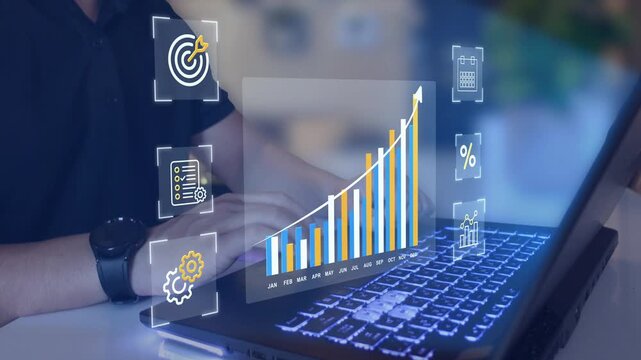
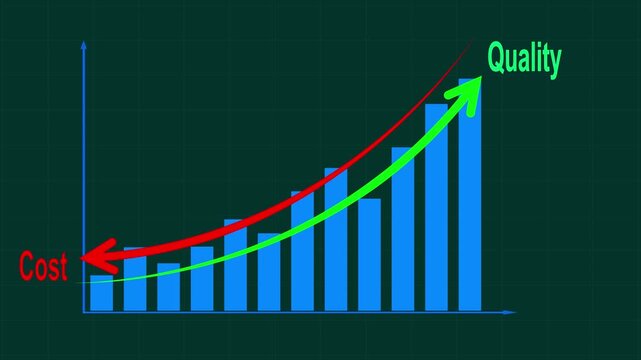
Cost control and quality improvement concept. Blue bar chart with line graph showing cost reduction and improving quality. Successful business strategy, efficiency, product optimization and management


00:10
HD
Diverse business professionals analyzing complex data on large futuristic digital display screens in a modern control room environment showcasing financial charts and graphs with glowing blue
00:10
HD
A powerful dark tech interface with neon blue accents and icons symbolizing business integrity, ethical standards, and a transparent corporate network.
00:10
HD
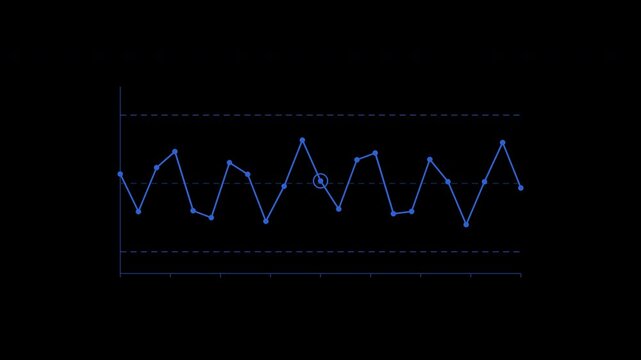
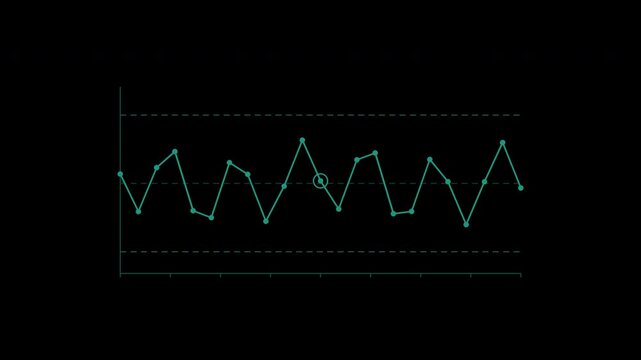
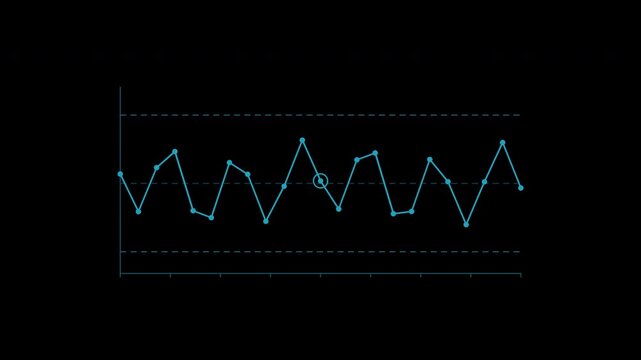
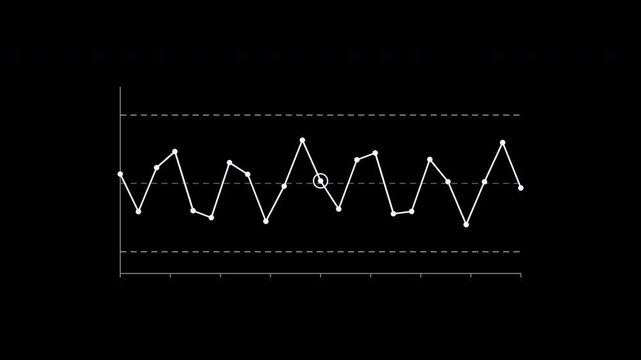
Quality control chart with upper and lower limits in cobalt
00:10
HD
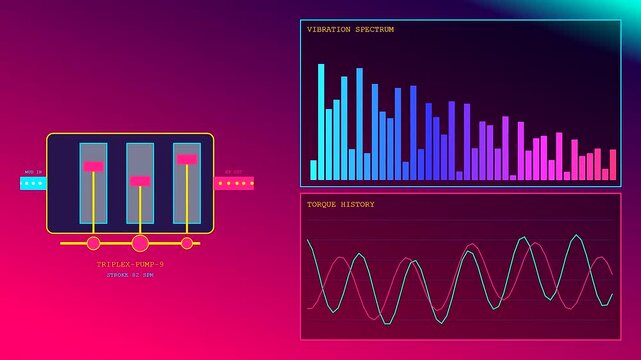
Digital displays showing geothermal drilling data with shifting vibration spectrum charts and fluctuating torque history graphs in a dynamic monitoring system for energy extraction process control
00:06
HD
Corporate professional typing credentials on a secure login interface with a digital shield icon. Concept of cyber security network protection, encrypted server access, and data privacy defense.
00:12
HD
Industrial worker uses a tablet beside a computer monitor displaying colorful production data charts and performance dashboards in a factory office.
00:21
HD
Interactive Technology dashboard combines globe charts and layers
00:14
HD
Close view of eyes and market chart reflection. Attention to price action, market focus and risk control
00:15
HD
Dark store automation monitoring interface showing complex analytical data visualizations and live inventory tracking metrics on a digital display board within an industrial warehouse control room
00:06
HD
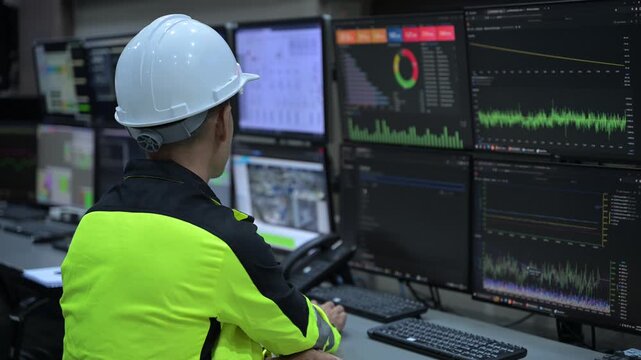
Professional engineer monitoring complex data systems on multiple screens in modern control center. Male worker analyzing digital charts and graphs for security and automation performance.
00:12
HD
Developer typing after live data update, HUD bar charts and gauges floating, confirming result
00:09
HD
Aurora signature liquid glass frosted dashboard with bar chart donut gauge and KPI metrics widgets over aurora gradient, premium visionOS spatial UI background, seamless loop animation
00:10
HD
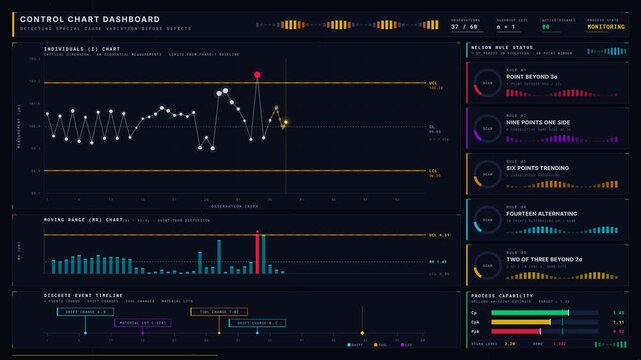
A sophisticated control chart dashboard visualizes special cause variation before defects, featuring luminous data points and dynamic violation alerts on a dark canvas.
00:15
HD
Cost control and quality improvement concept. Teal bar chart with line graph showing cost reduction and improving quality. Successful business strategy, efficiency, product optimization and management
00:10
HD
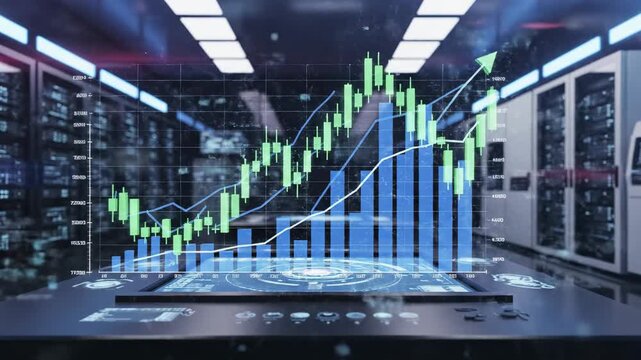
Digital stock market growth chart hologram projected in a modern data center, financial analytics and trading technology
00:08
HD
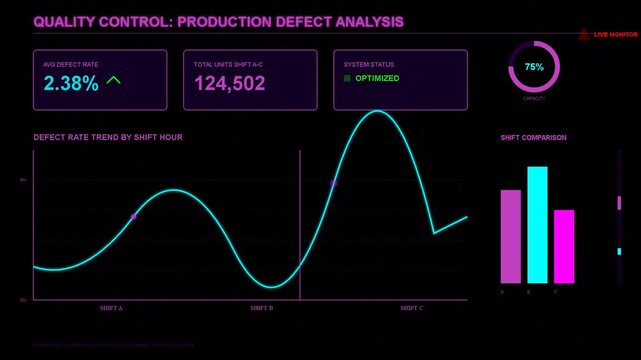
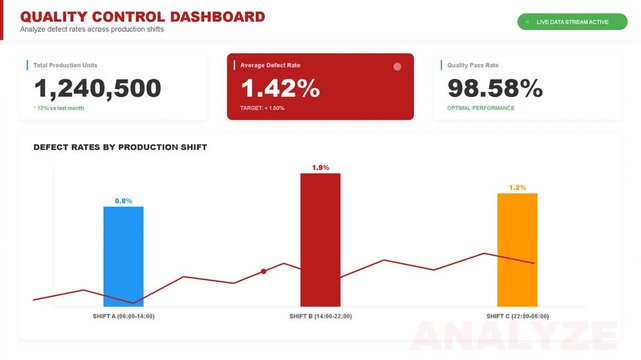
Digital dashboard showing quality control and production defect analysis with animated line graph and statistical bar charts
00:08
HD
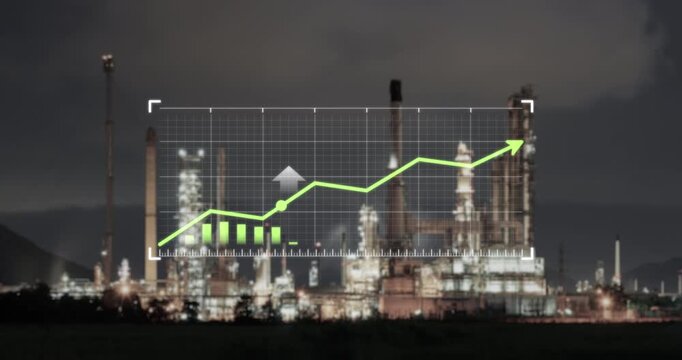
Industrial business concept with rising financial graph overlaying oil refinery plant at night. Symbolize increasing oil prices, refinery operating costs and growth in global power and energy sector.
00:18
HD
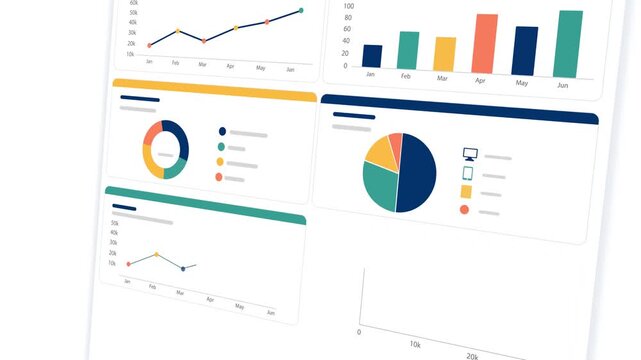
Modern Business Analytics Dashboard Animation with Multiple Data Visualization Panels like Charts, Graphs,  KPI Widgets, And Financial Statistics In A Clean Flat Design. Professional Website Metrics
00:49
HD
Digital project management interface featuring animated Gantt charts and task scheduling timelines.
00:11
HD
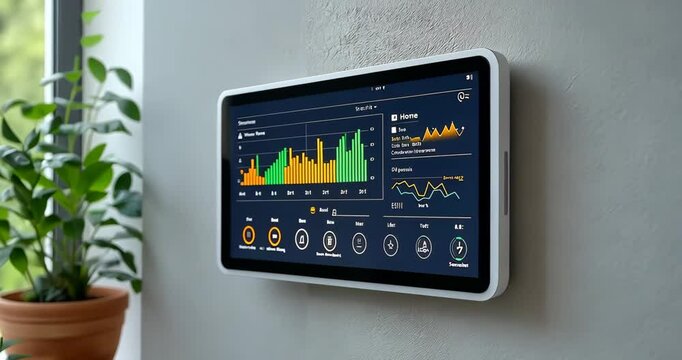
Smart home dashboard user interface with charts graphs and climate control widgets
00:08
HD
Quality control and company cost reduction. Successful organization strategy and management. cost reduction and improving quality. Money loss icon
00:12
HD
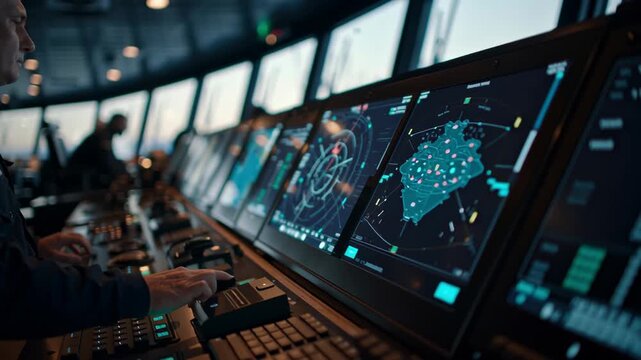
Ship bridge with multiple digital screens and control panels for advanced marine navigation, radar, electronic charting and autopilot systems guiding vessels across open sea
00:05
HD
Quality control chart with upper and lower limits in teal
00:10
HD
Futuristic holographic analytics display showing glowing data chart progression as a digital rocket launches from advanced control room console
00:05
HD
Digital dashboard interface displaying growing bar chart and control sliders for data analysis against clean minimal geometric grid background
00:06
HD
Animated stock trading platform interface with candlestick chart order book and buy sell controls
00:12
HD
Operator selects shield control beneath waveform chart
00:10
HD
Enterprise healthcare compliance dashboard displaying regulatory data tracking and quality control metrics on HUD.
00:14
HD
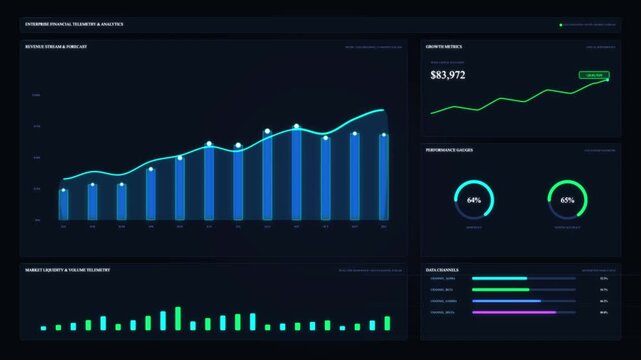
A dark futuristic HUD interface displays glowing blue data channels, numeric readouts and bar graphs across a high-tech control screen.
00:14
HD
Professional engineer monitoring complex data systems on multiple screens in modern control center. Male worker analyzing digital charts and graphs for security and automation performance.
00:13
HD
Circular time chart becomes selected on household dashboard
00:10
HD
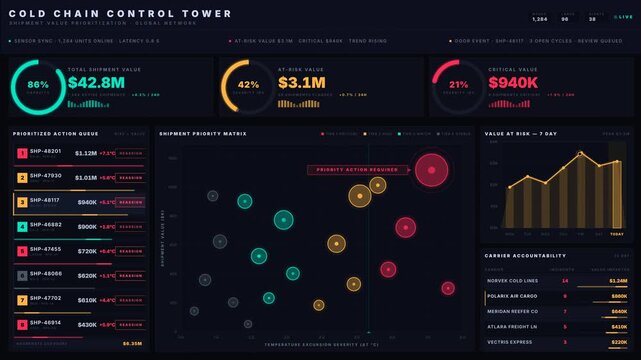
A sophisticated cold chain control tower dashboard showcasing shipment value prioritization with animated KPI rings and a dynamic bubble chart for effective decision-making.
00:15
HD
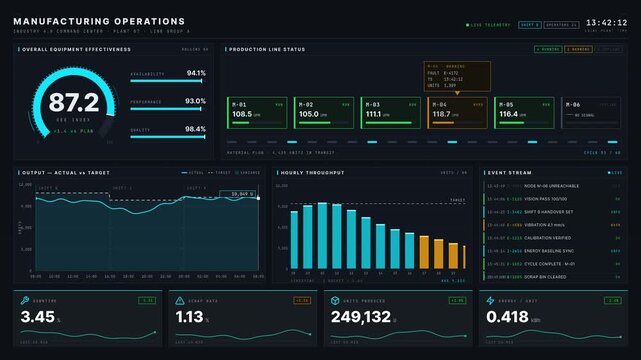
A detailed overview of a dark-mode Industry 4.0 command center dashboard featuring real-time OEE metrics, production line status, and KPI cards in a corporate environment.
00:15
HD
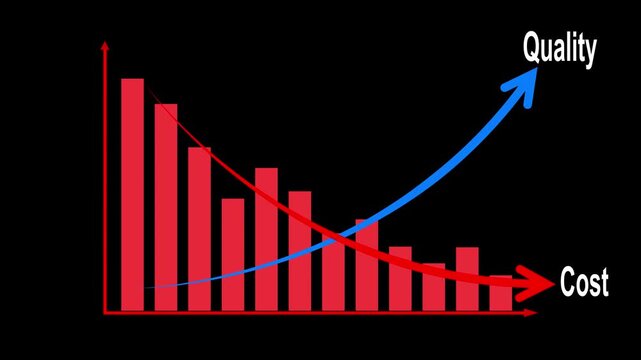
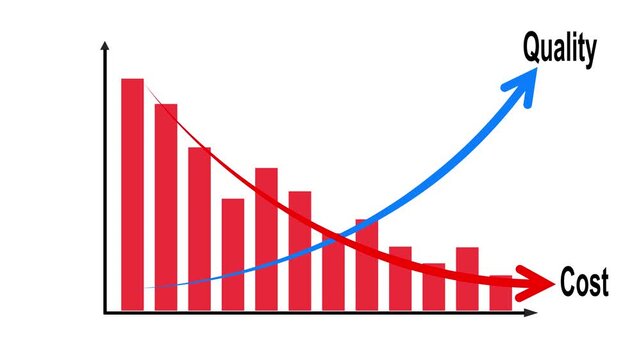
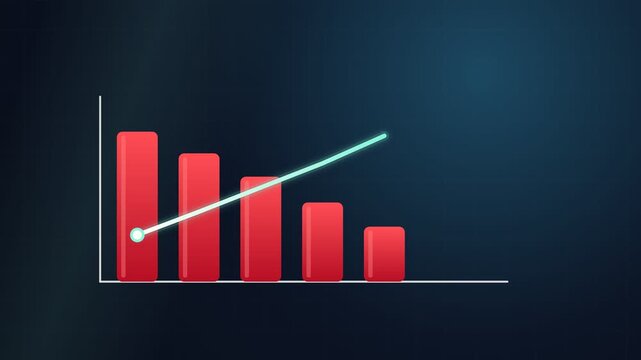
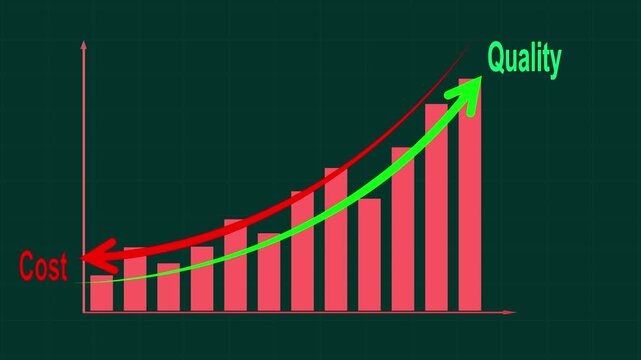
Cost control and quality improvement concept. Red bar chart with line graph showing cost reduction and improving quality. Successful business strategy, efficiency, product optimization and management
00:10
HD
Flat vector illustration of a robot assistant beside a cloud protection dashboard with database, shield, folder, and key icons, representing secure cloud management, access control, and automation.
00:10
HD
Digital quality control dashboard interface with bar charts and data analytics for business performance tracking, metrics, monitoring, statistics
00:09
HD
Digital Security Concept with Data Protection, Privacy Features, and Business Analysis Tools for Safe Online Transactions and Secure Collaboration Gluon.
00:12
HD
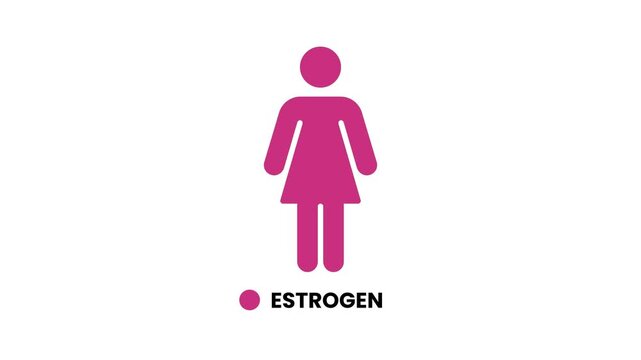
Female body silhouette highlighting estrogen concept animation isolated on white background
00:10
HD
Profit and quality management concepts long term cost planning, product quality, budgeting, financial forecasting
00:14
HD
Futuristic sci-fi holographic user interface control panels with data analytics charts and graphs on a dark background
00:06
HD
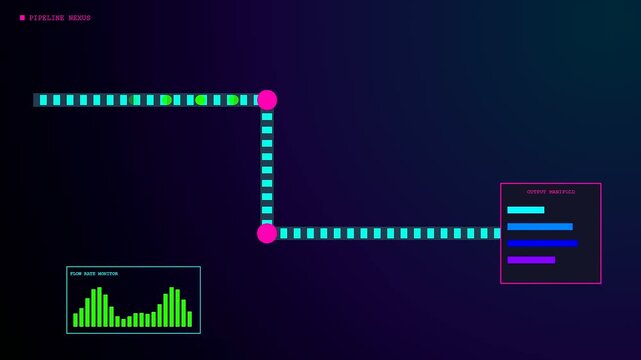
a biofuel refinery control interface flows through digital pipes as pulsating green light segments move across a dark screen displaying changing statistical bar chart data
00:06
HD
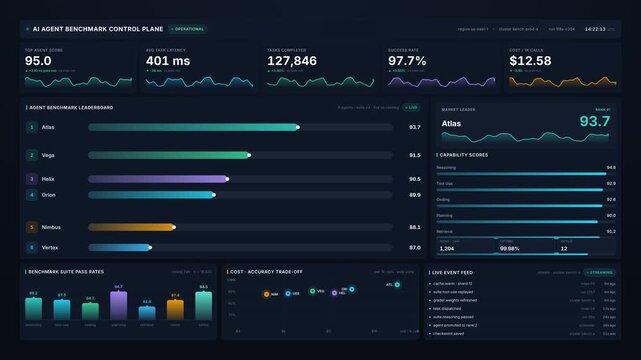
Ai agent benchmark control plane interface for model performance metrics, for artificial intelligence evaluation, automated systems tracking, data analysis, software development
00:20
HD
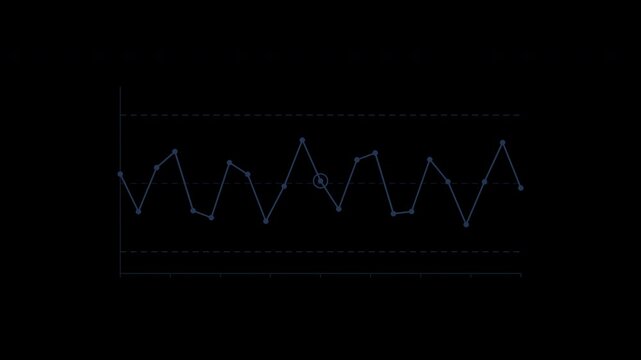
Quality control chart with upper and lower limits in navy
00:10
HD
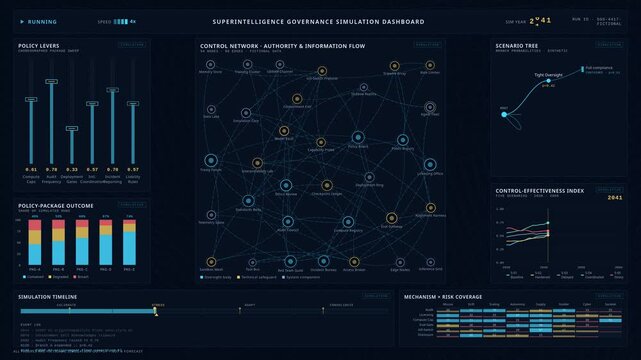
A dynamic simulation dashboard visualizing future AI governance scenarios with control networks, policy levers, and animated data charts against a midnight blue background.
00:15
HD
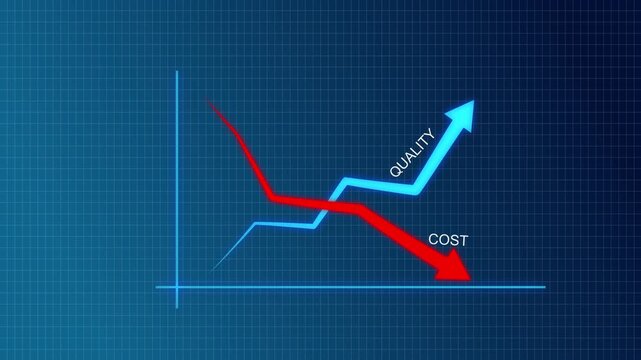
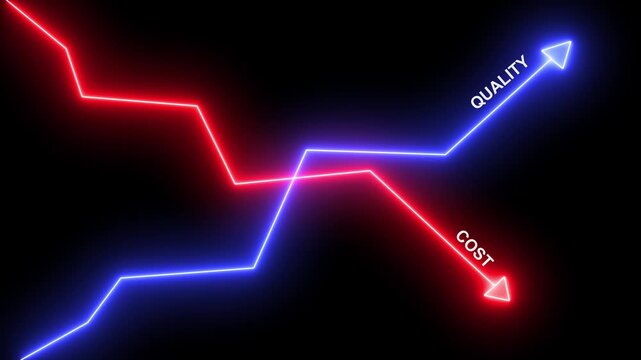
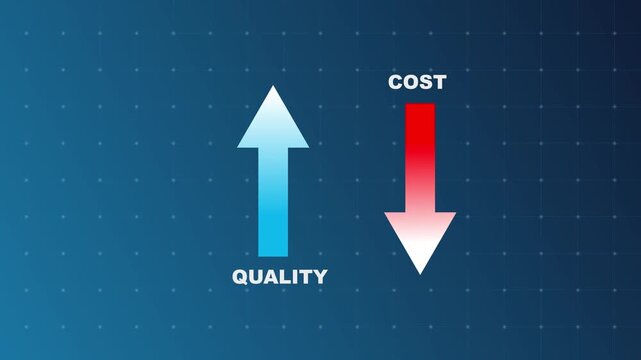
Glowing business chart illustrating rising quality and falling cost with a blue upward arrow and red downward arrow. quality increase, cost control and optimization. Successful business strategy,
00:10
HD
Green Screen Pie Chart Progress 70 Percent Loading Animation UI Element
00:08
HD
Glowing neon Success stairs sign with flag icon animation  Neon glowing Person Climbing Stairs Towards Success flag, Glowing neon business graph chart concept. on black background ,4k video
00:10
HD
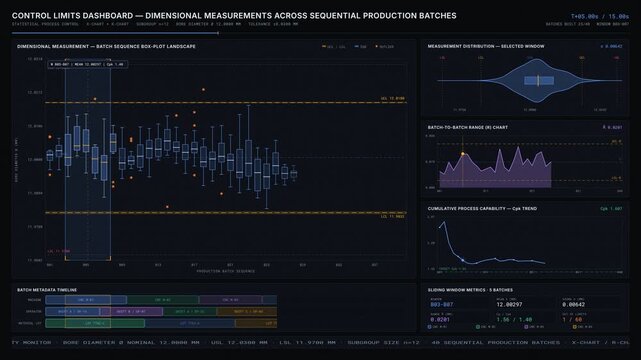
A detailed control limits dashboard visualizing dimensional measurements across sequential production batches with animated metrics and vibrant color overlays.
00:15
HD
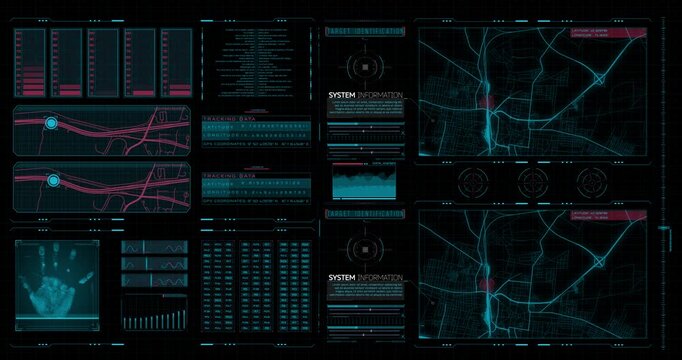
Futuristic digital interface displays city maps with marked locations, a hand scan, data charts and target identification elements.
00:30
HD
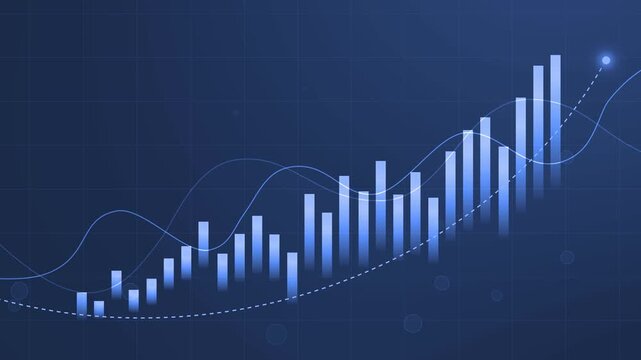
Stylized financial growth chart with rising bar graph, curved trend lines glowing data point animation
00:10
HD
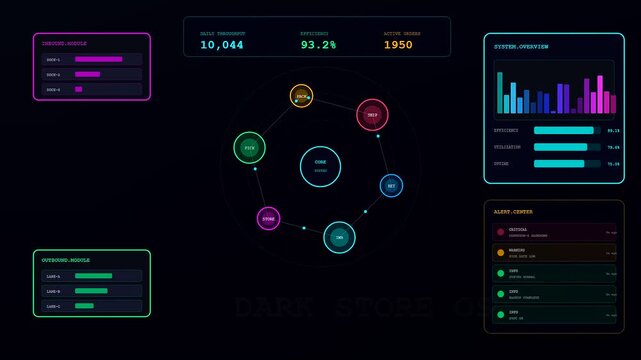
This futuristic digital user interface demonstrates Dark Store Automation with colorful interactive data charts performance statistics and system nodes on a dark background
00:06
HD
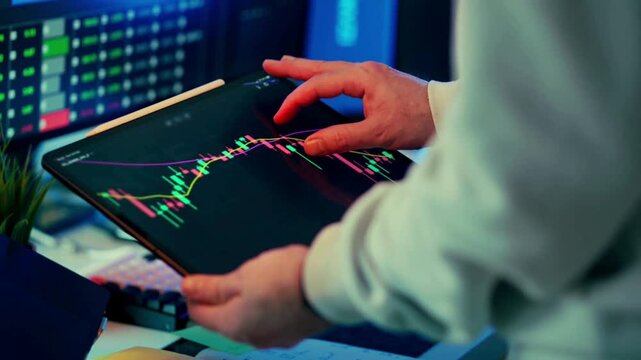
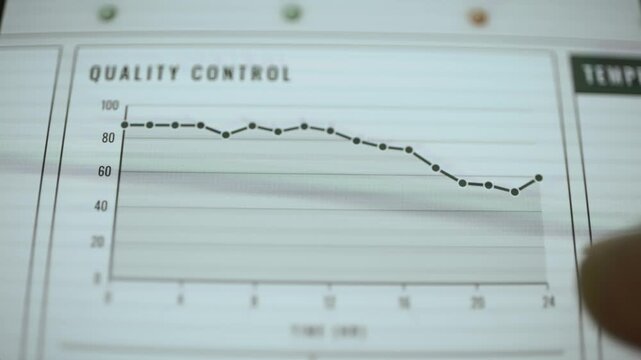
Hand touches downward trending stock chart on a digital tablet in a control room
00:13
HD
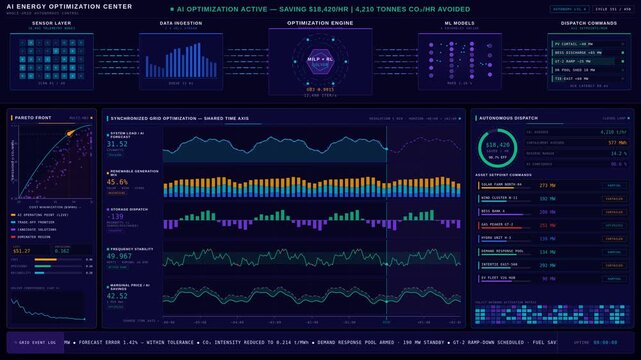
Futuristic AI energy optimization control center with glowing data analytics and autonomous decision dashboard in 4K. professional stock footage for technology, business, and editorial use.
00:15
HD
Cost control and quality improvement concept. Red bar chart with line graph showing cost reduction and improving quality. Successful business strategy, efficiency, product optimization and management
00:10
HD
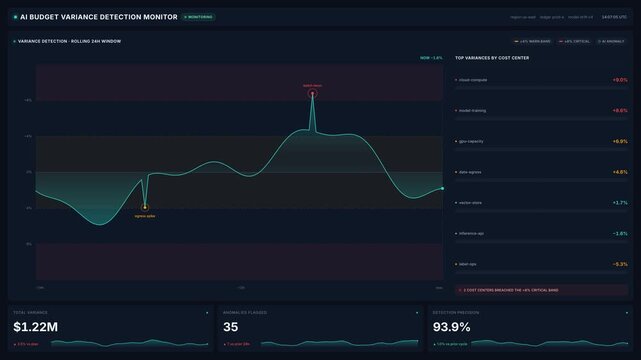
Ai budget variance detection monitor dashboard with 24 hour line chart cost center percentages, for 4k financial analytics, cloud spend tracking budget control
00:20
HD
Digital quality control dashboard interface with statistical charts, performance metrics, and fluctuating data trends, business analytics and monitoring system
00:09
HD
Business growth concept in allusive graph chart showing marketing sales profit increasing to future target . Excellent financial status of corporate business rise up . Finance and money 3D rendering .
00:20
HD
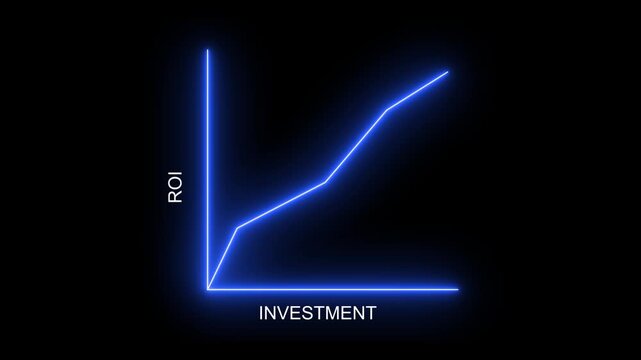
ROI return on investment concept. Neon line graph chart showing financial performance analysis with roi indicators, profit. Keywords: finance, graph, chart, business, economy, money
00:10
HD
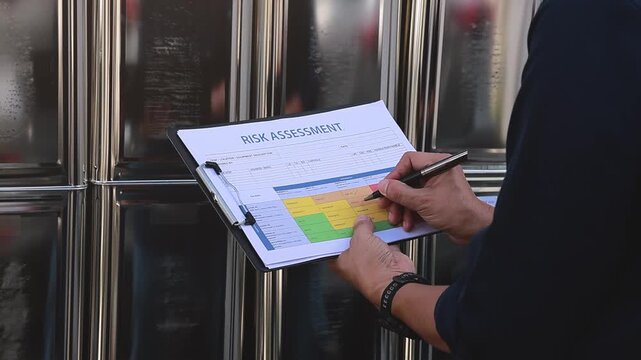
Professional conducting safety hazard identification risk assessment inspection writing on paper document clipboard near  solvent storage drums
00:13
HD
Cost control and quality improvement concept. Red bar chart with line graph showing cost reduction and improving quality. Successful business strategy, efficiency, product optimization and management
00:15
HD
Business cost reduction and market dropdown chart icon , .arrow showing rising quality and decreasing cost. Visualize business performance optimization, 4k
00:10
HD
dashboard analytics growth chart business finance graph ui animation
00:07
HD
Futuristic Sci Fi HUD Side Graph Waveform Telemetry Monitor to Track Real Time Spacecraft Server Network Data on Screen
00:20
HD
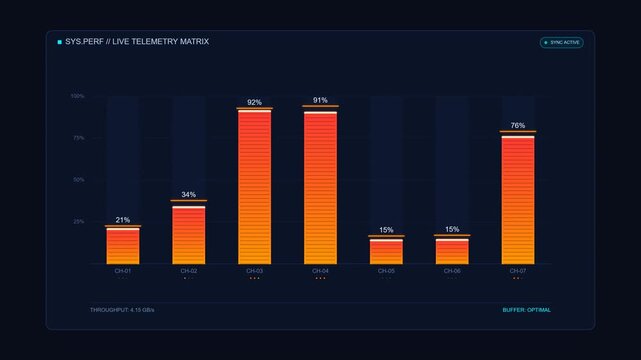
Live telemetry matrix system performance data chart on dark
00:06
HD
Digital neon analysis data business graph icon shows Quality and cost control concept, Cost and quality icons to Improve work efficiency for quality control and company cost reduction. business growth
00:10
HD
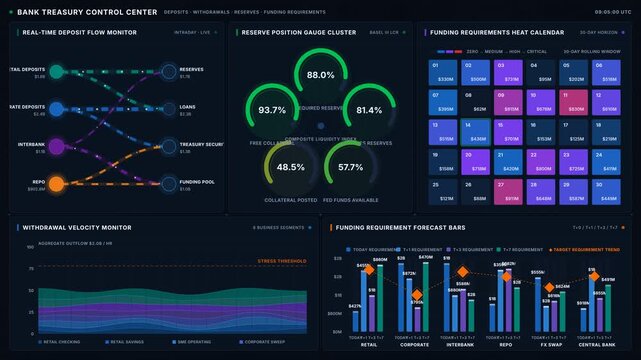
Ultra-premium dark bank treasury control center dashboard showing real-time deposit flow, reserve gauges, funding heat calendar, and withdrawal velocity charts in a seamless 4K loop.
00:15
HD
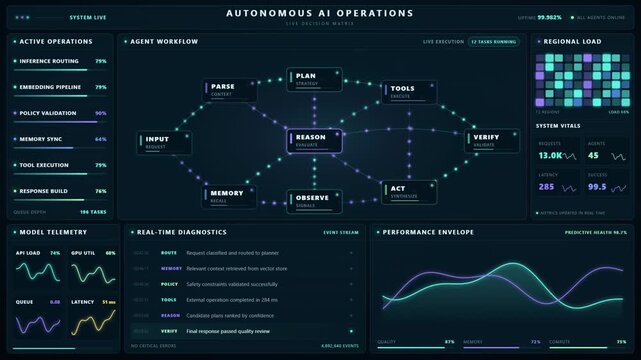
Autonomous AI operations dashboard with agent workflow diagram telemetry charts and diagnostics
00:15
HD
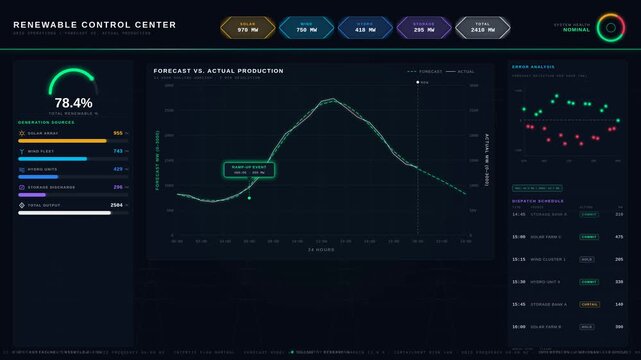
Explore a dark-mode renewable energy control center displaying real-time forecast vs actual production metrics, with vibrant graphs and animated status indicators for dynamic monitoring.
00:15
HD
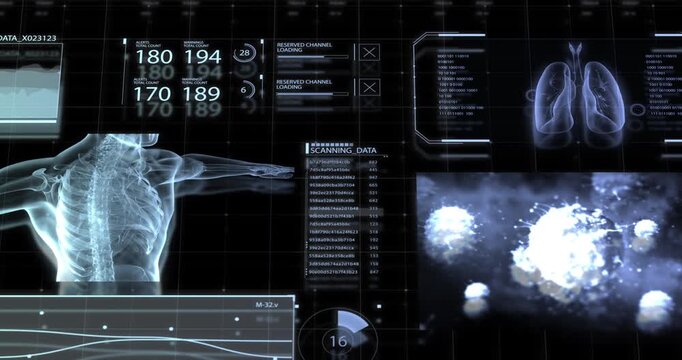
A detailed medical control screen shows an x-ray of a human spine, lung imagery, scanning data, and alert counters.
00:19
HD
Computer monitor with green screen display placed against high tech data center background featuring animated digital chart bars.
00:10
HD
Quality control chart with upper and lower limits in cyan
00:10
HD
Futuristic dark mode dashboard UI, digital data visualization interface with neon charts and graphs, modern software control panel design
00:05
HD
abstract smart city technology background with modern office skyscrapers and floating digital analytics charts.
00:20
HD
Quality control and cost reduction concept. Red bar chart with line arrow quality increase and falling cost. Successful business strategy, efficiency, product optimization and planning management
00:10
HD
4k ai claims analytics control plane dashboard with live pipeline stages, streaming charts approval metrics, for real-time processing workflow efficiency
00:20
HD
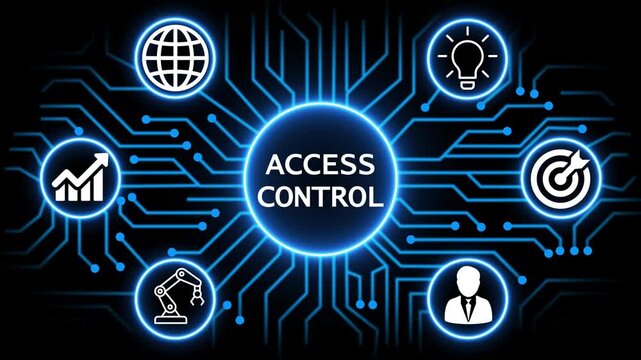
access control concept with circuit lines and digital symbols hovering above a businessman, technology. manufacturing process management all connected in a digital circle like pattern.
00:10
HD
Expense control concept visualizing expense, cost, and spending with emphasis on budgeting, cost control, and financial planning Marrow
00:10
HD
Data visualization dashboard displaying global network performance metrics
00:13
HD
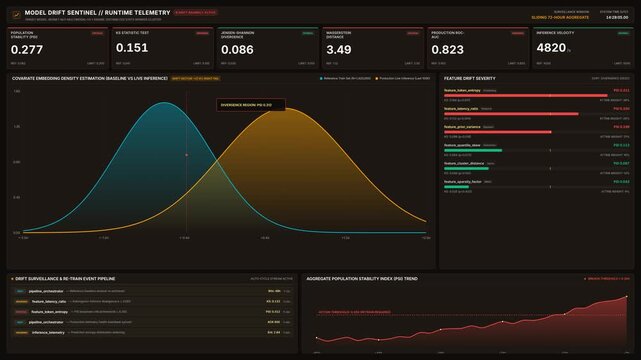
Model drift sentinel runtime telemetry dashboard tracking metrics, for system monitoring, data analysis, performance evaluation, artificial intelligence quality control software
00:20
HD
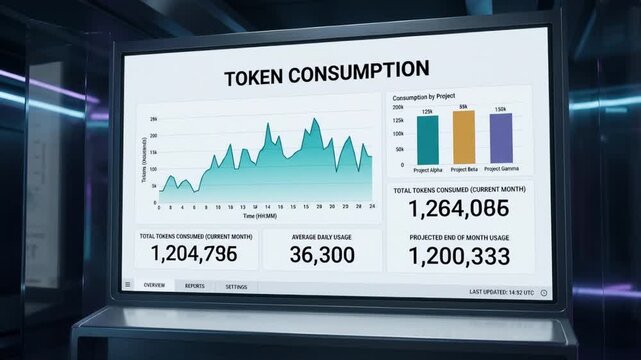
Token consumption dashboard tracks usage on bright monitor. Data tracking display shows line chart, project bars, and monthly totals, with numeric metrics updating in sleek futuristic control room.
00:05
HD
Business cost reduction and market dropdown chart icon , .arrow showing rising quality and decreasing cost. Visualize business performance optimization, 4k
00:10
HD
Stylized financial growth chart with rising bar graph, curved trend lines glowing data point animation
00:10
HD
Quality control chart records changing defect rate
00:11
HD
ROI return on investment concept. Neon line graph chart showing financial performance analysis with roi indicators, profit. Keywords: finance, graph, chart, business, economy, money
00:10
HD
Cost reduction concept. Quality improvement and cost reduction concept. quality increase, cost control and optimization. Successful business strategy,
00:10
HD
Glowing neon Success stairs sign with flag icon animation  Neon glowing Person Climbing Stairs Towards Success flag, Glowing neon business graph chart concept. on black background ,4k video
00:10
HD
Businesswoman hands using smartphone at office desk
00:08
HD
Ensuring corporate financial control compliance via glowing futuristic technological hud interface with security icons
00:20
HD
Corporate governance concept with enterprise compliance, intelligent business management, digital oversight and secure operational frameworks.
00:14
HD
Asian Female With Her Tablet at Financial Trading Control Room, Work Continuously With Her Tablet
00:15
HD
Quality control chart with upper and lower limits in white
00:10
HD
A smart home control panel displays energy consumption data and other information.
00:10
HD
Ship captain operating a modern radar and gps navigation system inside control room bridge of a large vessel, ensuring safe passage and efficient maritime operations
00:06
HD
Quality control and cost reduction concept. Blue bar chart with line arrow quality increase and falling cost. Successful business strategy, efficiency, product optimization and planning management
00:10
HD
Ai orchestration control plane dashboard with active agents compute nodes, for modern artificial intelligence data management systems, enterprise cloud computing, real-time network
00:20
HD
Wooden blocks on desk spell word Pain beside vials and syringe. Woman doctor reads chart writing detailed note about persistent pain control plan
00:13
HD
Digital interface showcasing a checkmark symbol representing verification process alongside records, charts, and spreadsheets for quality assurance tasks. Gluon.
00:10
HD
Quality and cost control concept glowing neon line animation by digital data business graph icon. Cost and quality icons to Improve work efficiency for quality control and company cost reduction.
00:10
HD
futuristic digital dashboard interface with glowing elements, data visualization, and control panel, technology concept
00:06
HD