ระบบได้ส่งลิงก์สำหรับตั้งรหัสผ่านของคุณไปที่: ต่อไปนี้คุณจะต้องใช้รหัสผ่านในการเข้าถึงสินค้าที่คุณได้ซื้อ
รับภาพประกอบ 25 ภาพหรือวิดีโอ 3 รายการเมื่อทดลองใช้ฟรี
เพิ่มตัวกรองใหม่แล้ว
เรียงลำดับตาม

58 ผลลัพธ์สำหรับ circle graph 12 ใน วิดีโอ

Loading white dots circle animation on green screen progress waiting download upload network update. Loading Circle. Twelve animated dots fading in and out in sequence creating a rotating effect. 4k
00:15
HD
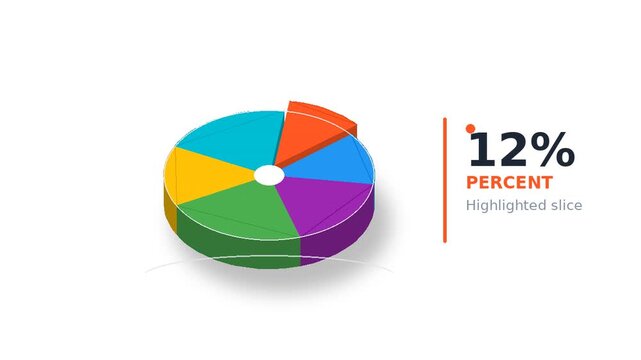
3d pie chart 12 percent
00:08
HD
Animated Circle Graph with incrementing numbers
00:14
HD
digital meter star 12 wing rotation out side element rolling for banner and advertisement
00:11
HD
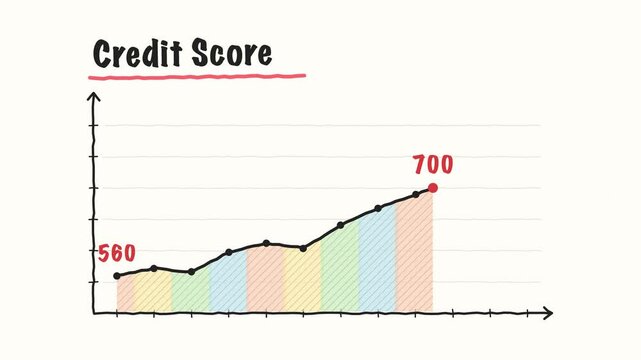
Credit score line chart climbs over 12 months hand drawn marker
00:10
HD
11 percent and 12 percent data representation from a pie chart 4k alpha channel
00:08
HD
12 percent circular loading progress on black background 4k video.
00:10
HD
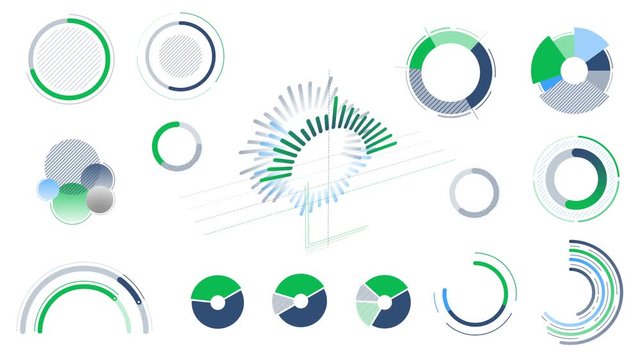
Set of 12 animated pie charts. A luma matte (alpha channel) is included.
00:28
HD
12 percent number loading circle icon pie chart animation 4K video.
00:05
HD
Numerical counting from 0 to 12. Circular progress bar with bright neon light , countdown animation timer circle countdown with rectangle icon, live, stream, exercise, workout transparent background.
00:10
HD
clock icon animation on black background. analog clock timer circle animated. 12 Hours Clock. Clock icon vector animation with clock face,4k video.
00:10
HD
HUD Arc Audio Equalizer Radial Grids Red VJ Loop Animation 12
00:30
HD
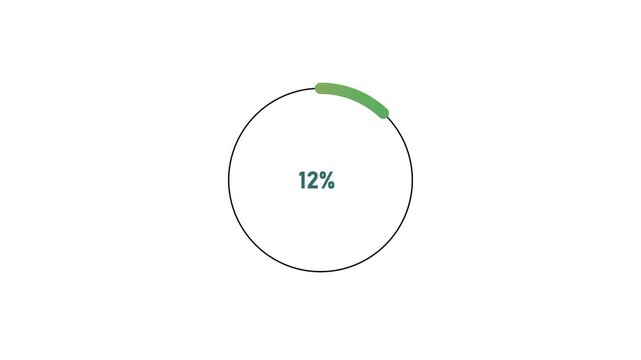
Circular progress indicator showing 12 percent completion on a white background circle percentage
00:10
HD
12% circle diagrams Infographics animation design, 12 Percentage pie charts
00:05
HD
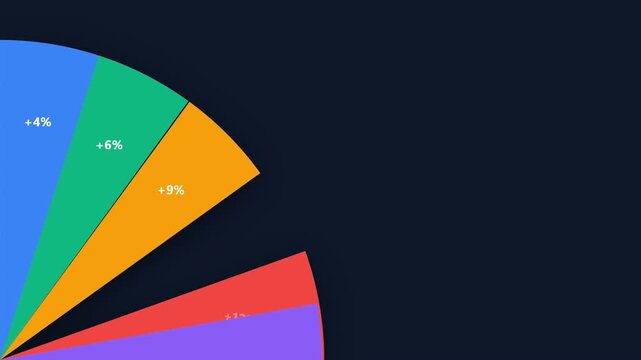
Animated business infographic showing colorful pie chart segments with percentage growth values of four, six, nine, and twelve percent on a dark background for data visualization
00:08
HD
12. black gray line Scientific chemistry pattern Structure molecule research as concept For visuals, biology, biotechnology, chemistry, science, Medicine, cosmetics or as motion background.
00:18
HD
12. 3D_pie_chart_reassembling_20260911021354
00:06
HD
DonutChart presents segmented analytics data showing twelve percent in the center circle positioned on a white rounded card with soft gray surrounding space.
00:10
HD
A distinctive animated business bubble chart featuring twelve distinct circles gently expanding, contracting, and moving into organized positions.
00:10
HD
Digital communication concept with central word EMAIL surrounded by interconnected white representing global connection data analysis security and
00:10
HD
12%12% Bar Chart Animation percentage diagrams modern animation design percentage circle 4K animation. neon circle and cc bal action background.
00:10
HD
Abstract Pie Chart Data Loop Animation with 12 percent. 12 Modern circular pie chart animation showing percentage progress and statistics.
00:07
HD
loading circle animation. loading icon animation, Loading circle icon animation on black background. Loading Circle. Twelve animated dots fading in and out in sequence creating a rotating effect. 4k
00:15
HD
digital meter star 12 wing rotation inside element rolling for banner and advertisement
00:11
HD
4K Light Globe time zone. Business clock counting down 12 hours over 30 seconds. Stock exchange
00:30
HD
Animated Infographics set. Animation of twelve different charts and graphs in orange color presented on monitor mock up isolated on green background. High quality 4k footage.
00:10
HD
0 to from 12% loading loop animation. glowing circular progress on white background .
00:10
HD
Set of 12 animated pie charts. A luma matte (alpha channel) is included.
00:28
HD
Twelve o'clock clock icon white background.
00:10
HD
Round graphs in motion. Circle graph made from plasticine on black background on white board
00:12
HD
clock icon animation on black background. analog clock timer circle animated. 12 Hours Clock. Clock icon vector animation with clock face,4k video.
00:10
HD
12% percent number circle loading pie chart icon modern design animation, on white background 4K video.
00:04
HD
Profit high growth percent icon, stocks, financial, Interest rate and dividend concept. Abstract neon business concept chart icon animation background.12 month increased graph
00:10
HD
12% circle diagrams Infographics animation design, 12 Percentage ready to use for web design
00:05
HD
month chart of 12 graphs, vector infographic template for report, presentation in modern bright colors on dark background
00:10
HD
12% complete loading circle  icon Infographics animation.
00:04
HD
Level 12. animated title with gradient text on green background with bodge effect
00:10
HD
12 percent vertical donut chart. Circle round infographic, graphic animation for mobile social media and tv.
00:06
HD
A premium animated radial business data wheel positioned slightly left of center, with twelve illuminating segments featuring red, teal, and indigo gradients.
00:10
HD
Digital infographic circle with the word STANDARD at its core and twelve white business concept on a dark blue global map background
00:10
HD
12% circular infographic animation design, percentage pie chart with dynamic visualization, business data dashboard for reports, analytics, and statistics in modern 4K animated presentation style.
00:06
HD
Reloj dando las doce horas y mecanismo de ruedas dentadas a la vista
01:00
HD
Loading circle animation Small spinning white circle of dots going in loop animated on transparent alpha layer. Loading Circle. Twelve animated dots fading in and out in sequence. 4k
00:15
HD
Set of 12 animated pie charts. A luma matte (alpha channel) is included.
00:28
HD
Set of 12 animated pie charts. A luma matte (alpha channel) is included.
00:28
HD
4K Business clock counting down 12 hours over 30 seconds. Stock exchange. Four time zone
00:30
HD
A premium animated radial business data wheel positioned slightly left of center, with twelve illuminating segments in cyan, white, navy blue, and amber.
00:10
HD
Profit high growth percent icon, stocks, financial, Interest rate and dividend concept. Abstract neon business concept chart icon animation background.12 month increased graph
00:10
HD
Profit high growth percent icon, stocks, financial, Interest rate and dividend concept. Abstract neon business concept chart icon animation background.12 month increased graph
00:10
HD
12% circle percentage diagrams modern animation design
00:05
HD
12% circle percentage diagrams modern animation design
00:05
HD
Twelve o'clock clock icon black background.
00:10
HD
Digital infographic circle with the word TRUST at its center and twelve white business concept on a dark blue map background
00:10
HD
4K Business clock counting down 12 hours over 30 seconds. Stock exchange. News green background. Four time zone
00:30
HD
Digital communication concept with central word CHAT surrounded by interconnected white representing global connection data analysis security and
00:10
HD
Digital communication concept with central word CONTACT surrounded by interconnected white representing global connection data analysis security and
00:10
HD
Twelve o'clock clock icon green background.
00:10
HD
Digital communication concept with central word GROUP surrounded by interconnected white representing global connection data analysis security and
00:10
HD

เราพบผลลัพธ์ที่ตรงกันสำหรับ circle graph 12 ไม่กี่รายการ ผลลัพธ์ที่เกี่ยวข้องจะแสดงไว้ด้านล่าง

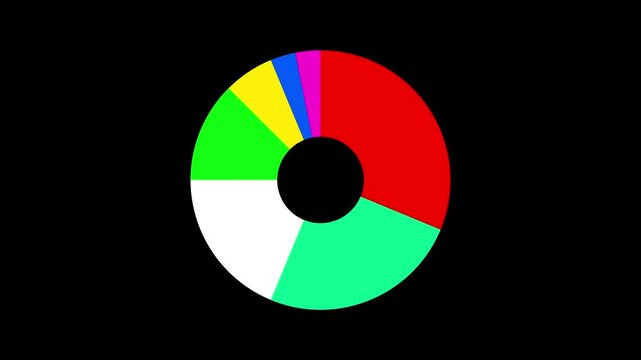
Donutss chart displays data percentages on a grid. This donuts chart visualizes statistical information. Donutss chart animation for analytics and science themes.
00:12
HD
Business graph and chart concept. Colorful data visualization and financial analysis for report and presentation
00:08
HD
Two ring sunburst spinning over green screen for chroma key use
00:08
HD
Futuristic digital interface hud circle with colorful abstract segments and glowing center light
00:10
HD
Abstract circular architectural blueprint with geometric radial design.
00:10
HD
Animation of data processing and statistics over black background
00:15
HD
A large, colorful, segmented circular chart or wheel with text, placed on top of a vintage world map. Concept of global information distribution, data analysis, or international relations
00:05
HD
A glowing D pie chart expanding on a digital grid, with sections representing different international markets, highlighting global expansion
00:10
HD
Donut-style financial infographic depicting 12.4 million dollars in revenue with a circular chart.
00:12
HD
Big Data complex round graph animation. Top view on quantum computing universe. Cyber space of AI technology. Futuristic graph. Digital information presentation.
00:10
HD
Circle charts and diagrams on the alpha channel
00:06
HD
Two 3D circlestep with various diagram chart for presentation(included alpha)
00:11
HD
Rotation chart. Business background. Financial instruments. Close-up
00:17
HD
A digital Organoid Growth Monitoring interface displays real time cellular health status through circular heat maps and medical telemetry data pulsing across a dark clinical screen
00:06
HD
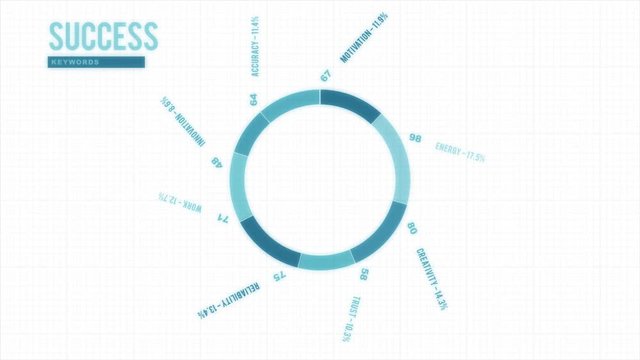
Success Business Keywords Diagram Intro/ 4k animation of an inspiration and motivating success in business infographics background
00:08
HD
Minimalist circular progress bar animation with percentage counter for ui/ux loading circle interface
00:10
HD
Modern Circle Chart Animation
00:13
HD
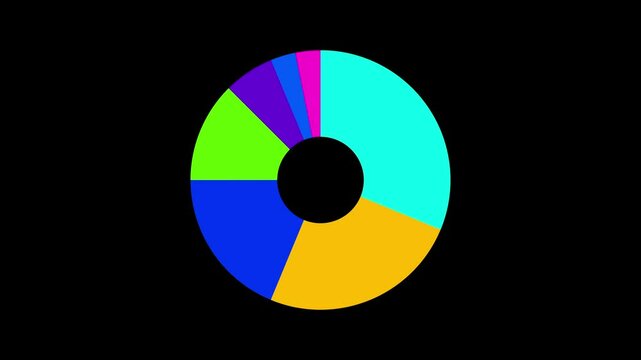
A circle with many colors and a black background. The circle is divided into sections. Clean donut chart infographic showing Medicaid spending distribution, minimal muted style
00:10
HD
Bauhaus Abstract Clockwork Background with Layered Rotating Geometric Forms
00:12
HD
Perspective financial business chart on the desk in the office.
00:20
HD
Data Visualization: A colorful and abstract infographic with a circular design, showcasing data points and insights with a focus on growth and interconnectedness.
00:10
HD
Financial portfolio segments drifting apart in a sunburst on navy
00:08
HD
Digital circular progress bar animation with a rotating sector on black background
00:07
HD
Motion graphic Business Data Analysis with Colorful Bar Graphs Showing Percentages and Trends in Business Performance Metrics
00:05
HD
Pie chart and numbers filling up with colour
00:15
HD
An immersive dashboard interface displaying key performance indicators KPIs of supply chains including carbon footprint analysis resource utilization rates and risk management insights
00:06
HD
Pie charts animation. Grow or success profit diagram concept. 4k black background, pie chart, graph
00:05
HD
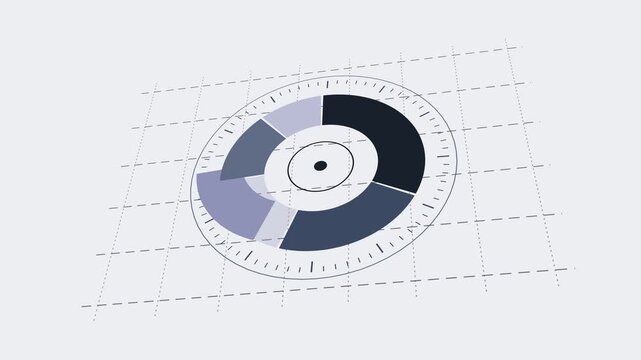
Donut Chart Segments Sweeping on Graph Paper
00:08
HD
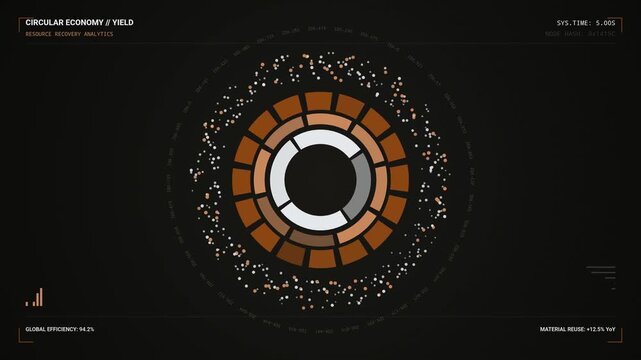
Concentric Data Analytics Sunburst Chart Dashboard with Circular Business Economy Metrics
00:10
HD
Circle charts and diagrams on the white background
00:06
HD
3D animated circular data chart infographic with rotating segments for business presentation de
00:10
HD
Animated Nightingale Rose Polar Area Chart Data Visualization Loop
00:10
HD
Donut chart flipping to show changing shares on a light background
00:20
HD
A digital tournament interface displays circular statistics and data loading screens for sports event management software with glowing neon light indicators on a dark display monitor
00:06
HD
Circular Data Chart Segments Growing With Subtle Blue Glow Against Dark Background
00:10
HD
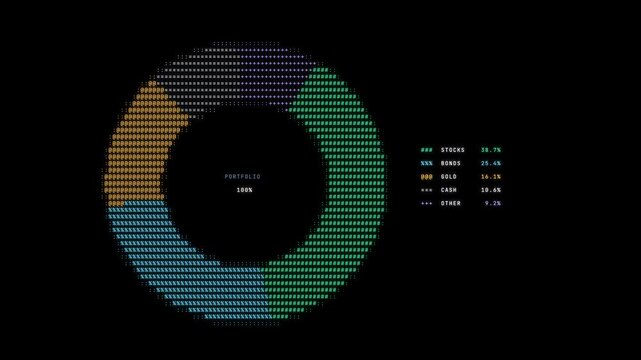
ASCII portfolio donut chart overlay on black background, rotating loop 4K.
00:18
HD
Modern Circle Chart Animation
00:13
HD
A circle with different colors and numbers. The circle is on a white background. Minimal infographic pie chart showing voting outcomes, vote-a-rama clean muted
00:09
HD
90 percent circle cylinder pie chart and various graph chart for presentation templete(included alpha)
00:11
HD
Donut chart illustration with blue, orange, and gray colors, plain style without indicators and data and white background, 2d animation
00:30
HD
animated pie bar chart transparent background
00:08
HD
Rose multi level circular diagram showing nested shares on blush
00:08
HD
An interactive poll visual with vibrant circular charts and data nodes displayed in a dark digital interface showing complex user feedback metrics and flowing wave signals
00:06
HD
vector illustration of an abstract background
00:09
HD
Animation of camera shutter icons over multiple screens with data processing against grey background
00:11
HD
Colorful pie chart on a report showcasing data analysis and distribution.
00:05
HD
Pie charts animation. Grow or success profit diagram concept. 4k black background, pie chart, graph
00:05
HD
Bright corporate bar chart rise motion background, animated statistics bars progress rings
00:10
HD
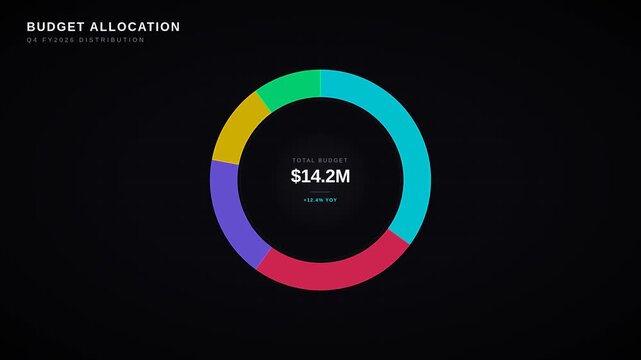
Animated donut chart with corporate budget allocation quarterly financial distribution, for professional data visualization, strategic business planning, investment analysis, fiscal
00:20
HD
Circle infographics - graphs, charts and diagrams
00:06
HD
4K animation of financial bar charts and infographics, camera movement with shallow depth of field. Set of  business graphs for corporate presentation and money investment analysis
00:10
HD
Data visualization interface dashboard analysis technology ui ux design infographic future
00:05
HD
A complex algorithmic trading user interface showing glowing circular graphs with flickering neon data bars during a simulated financial market session on dark digital screens
00:06
HD
Digital Data Visualization on Futuristic Table
00:10
HD
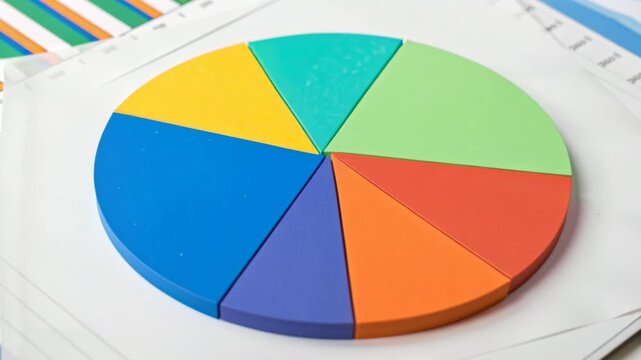
Pie Chart of Possibilities: A vibrant, three-dimensional pie chart composed of color-coded segments represents data visualization, market share, or diverse options. Perfect for business, analytics.
00:10
HD
3d icon of multi circle chart on green background for presentation
00:09
HD
4K Modern Circle Chart Animation
00:13
HD
Ultra Cute Abstract Geometric Motion Video Backgrounds | Pastel Triangle Circle & Quadrilateral Shapes | Soft Dreamy Loop able 4K Stock Background Videos
00:05
HD
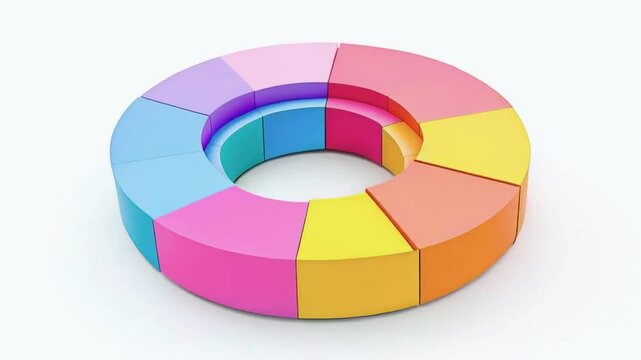
Colourful 3d pie chart
00:15
HD
Data Visualization, Business Analytics, Corporate Strategies, Infographic Design, Digital Environment, Top-Down View, Motion Graphics
00:10
HD
Data wheel chart digital background analysis
00:10
HD
Colorful digital pie chart for real estate distribution, top down, with distinct legends
00:05
HD
Abstract 3d data visualization circular chart showing financial market trends and business analytics
00:10
HD
A vibrant circular arrangement of geometric shapes lies on a polished wooden surface, illuminated by warm sunset light, creating a playful and artistic atmosphere.
00:10
HD
Animation of statistics and financial data processing over grid
00:12
HD
80 percent circle cylinder pie chart and various graph chart for presentation templete(included alpha)
00:11
HD
Female hands hold graphic charts.
00:14
HD
Animated pie chart segments expanding with rotating highlight
00:10
HD
Animated sleep cycle infographic in a modern flat vector style, phases sweeping in a smooth 4K loop. Blank text placeholders and fresh green accents sit on a bright light background so headings and nu
00:07
HD
Circle infographics - charts, charts and diagrams
00:06
HD
A colorful 3D doughnut chart representing data segments in various hues.
00:04
HD
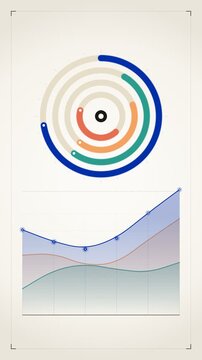
Editorial Fintech Portfolio Donut Gauges and Wealth Growth Spline Wave Chart Seamless Loop Business Infographic 2D Animation Vertical 9 16
00:10
HD
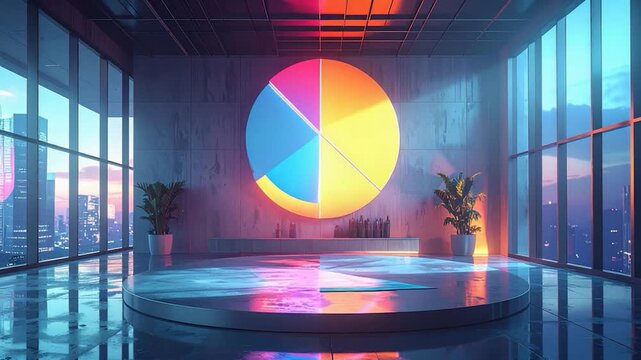
Modern room with pie chart, city views, and plants, with futuristic aesthetics
00:05
HD
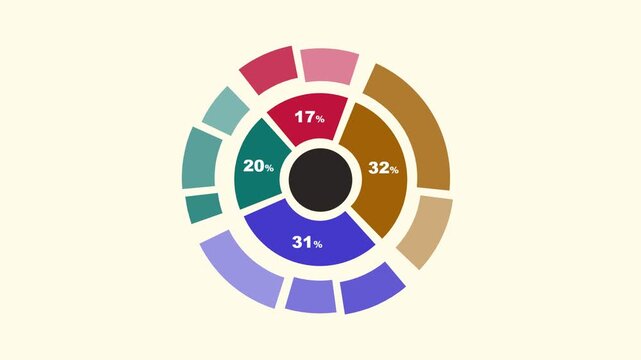
Revenue streams split apart in an ochre and indigo sunburst on cream
00:08
HD
donut chart splits and rebalances, with stacked bars. For investment and asset allocation topics
00:12
HD
Dark futuristic waveform animation with blue neon lines radiating from a circle on a black and white background, creating a dynamic visual effect.
00:07
HD
4K Modern Circle Chart Animation
00:12
HD
Pause effect colorful radial audio spectrum for music tracks
00:10
HD
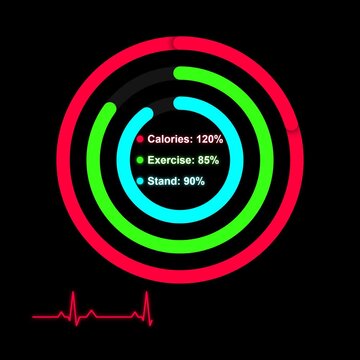
Minimalist digital fitness tracking rings displaying circular progress bars with glowing neon segments against a solid deep black background interface
00:08
HD
Pie Graph Loop Green Lite
00:15
HD
Modern data visualization with charts, graphs, and infographics displaying analytical insights
00:10
HD
Colorful 3D animated pie chart infographic showing data distribution and business growth on white background
00:10
HD
Minimalist abstract circular arcs and sunburst geometric graphic.
00:10
HD
3D Bar Chart Growing Transparent Alpha Video Animation
00:08
HD
Moving molecules and moving upwards over eye of woman
00:12
HD
70 percent circle cylinder pie chart and various graph chart for presentation templete(included alpha)
00:11
HD
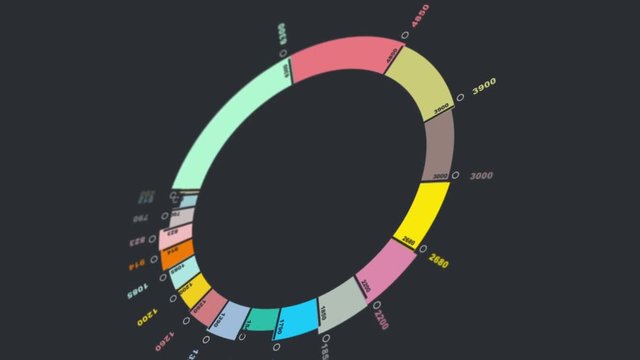
Tilted 3D Donut Segments Animated Background
00:20
HD
Hands Holding Glowing Colorful Pie Chart Display
00:10
HD
Abstract graphic displays data visualization. Concentric circles, horizontal bars present information using vibrant purple, blue hues. Modern design.
00:07
HD
Round graphs, charts and diagrams on the white background
00:06
HD
Bar graph and circular graph.
00:15
HD