ระบบได้ส่งลิงก์สำหรับตั้งรหัสผ่านของคุณไปที่: ต่อไปนี้คุณจะต้องใช้รหัสผ่านในการเข้าถึงสินค้าที่คุณได้ซื้อ
รับภาพประกอบ 25 ภาพหรือวิดีโอ 3 รายการเมื่อทดลองใช้ฟรี
เพิ่มตัวกรองใหม่แล้ว
เรียงลำดับตาม

4,787 ผลลัพธ์สำหรับ candlestick pattern ใน วิดีโอ

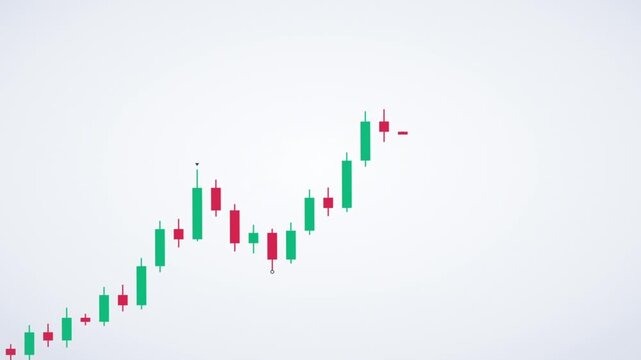
Animated Stock Market Candlestick Chart Sequence
00:15
HD
Stock market candlestick pattern hammer
00:10
HD
Animated colourful candlestick chart pattern graph with rotating globe infographic dashboard showing word economy modern design business stock market backrground
00:16
HD
Digital financial candlestick chart displaying market trends, stock trading analysis, investment data and economic forecast
00:07
HD
Minimalist green candlestick chart pattern on a solid black background
00:10
HD
Animated stock trading candlestick chart featuring a classic 'Triple Bottom' tap and rebound pattern with a strong breakout, green bullish and red bearish candles, dynamic market line wave, and smooth
00:10
HD
Golden candlestick bar floating with technical line chart, gold trading investment strategy, bullrish commodities market price trend graph, uptrend financial economic growth profit 3d rendering
00:18
HD
A dynamic stock market chart visualizes financial data with candlestick patterns and glowing orange lights. ..Created with Generative AI, not depicting real subjects.
00:10
HD
Digital financial trading chart with candlestick patterns and trend lines on a dark blue background
00:10
HD
Dynamic stock market chart with candlestick patterns and real-time financial data on a digital screen ideal for illustrating investment trading and economic analysis
00:08
HD
Minimalist financial candlestick chart pattern isolated on a black background
00:10
HD
Minimalist financial candlestick chart pattern on a dark background
00:10
HD
Traders monitor the volatile fluctuations of financial markets by observing shifting candlestick patterns displayed on a digital screen to assess global economic performance during active
00:15
HD
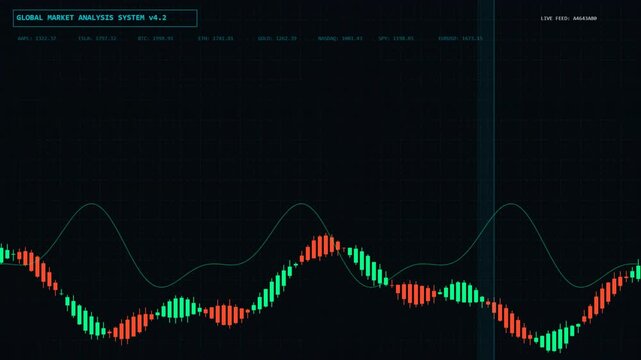
Financial trading chart with red and green candlestick bars fluctuating in a sinusoidal wave pattern on a dark background for market analysis and stock exchange data visualization concept
00:10
HD
Neon Yellow Candlestick Pattern Stock Chart with Numbers Loop 4K
00:13
HD
Animated Candlestick Chart Rising Market Trend
00:08
HD
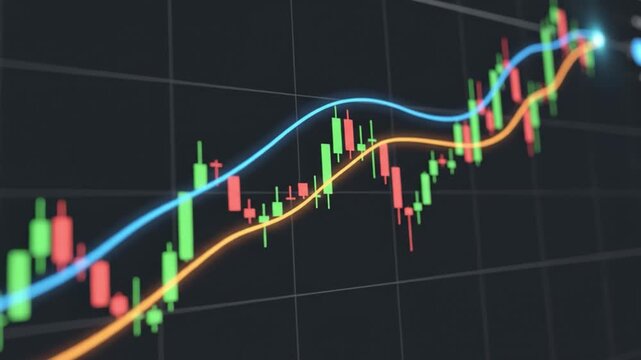
Stock market chart with candlestick pattern and moving average lines showing financial data trends and analysis for investment decisions including blue line orange line green candle red candle graph
00:08
HD
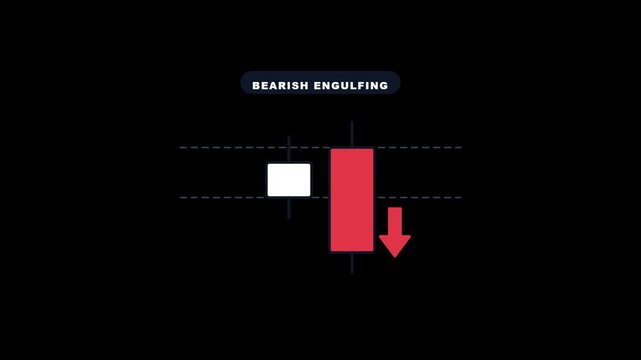
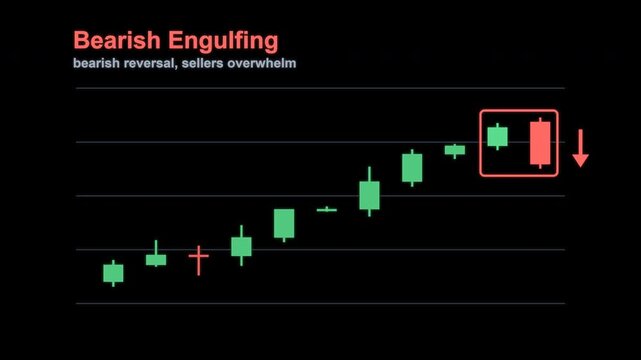
Bearish engulfing candlestick pattern with red down arrow on black chart
00:05
HD
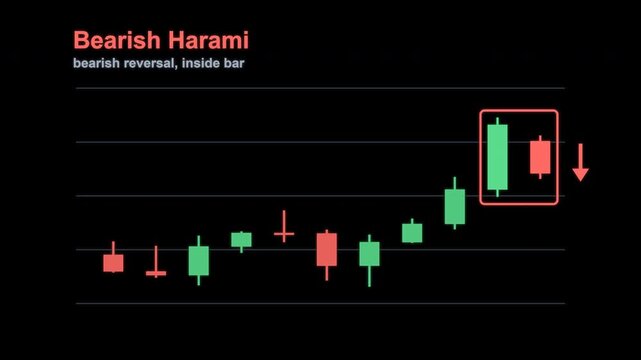
Bearish Harami Candlestick Pattern Trading Chart Labeled Animated Overlay Alpha 4K
00:07
HD
A glowing neon green graphic of a hammer candlestick pattern against a dark background.
00:10
HD
Financial market chart with candlesticks and line graph, Abstract financial chart with candlestick bars and line graphs market analysis growth and data trends animation
00:10
HD
Abstract financial chart with glowing digital candlestick data points moving across dark screen representing stock market volatility investment analysis business growth and economic trends.
00:10
HD
Holographic financial candlestick chart with hs pattern
00:10
HD
Digital candlestick financial chart displaying market trend fluctuations
00:05
HD
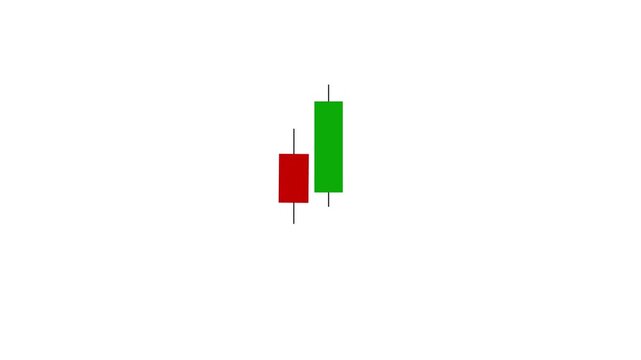
Bullish engulfing candlestick pattern
00:10
HD
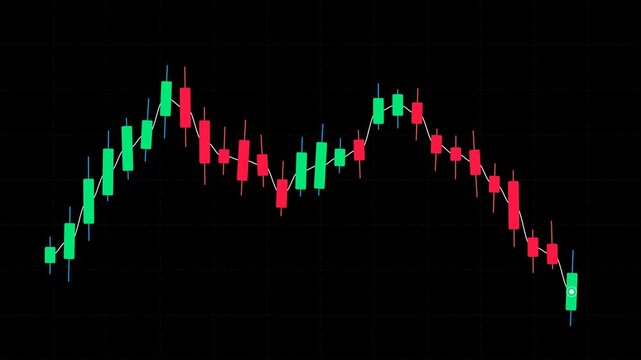
Animated stock trading candlestick chart featuring a classic 'M' pattern or double top reversal that builds exhaustive resistance and finishes with an explosive bearish breakdown, green bullish

00:10
HD
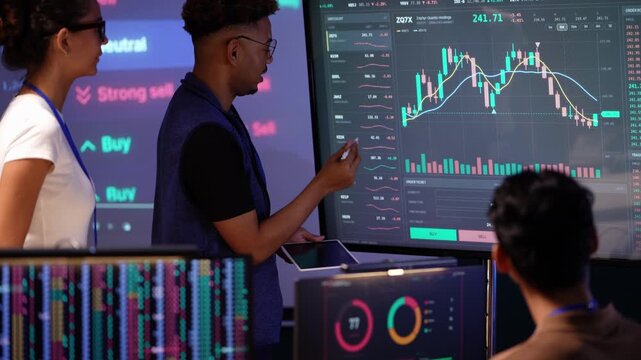
Black analyst in a blue vest gestures at an upward candlestick pattern, then writes on a tablet and speaks while a Latina colleague listens and an Asian man looks on
00:19
HD
Stock market candlestick pattern hammer
00:10
HD
Abstract financial trading chart with candlestick and line graph motion graphics
00:05
HD
Financial Stock Market Data Chart with Candlestick Pattern and Volatility Analysis Background
00:12
HD
Bullish Reversal Candlestick Pattern on Futuristic Digital Trading Interface
00:15
HD
Cryptocurrency candlestick trading chart with positive trend counter overlay
00:07
HD
Stock market chart with candlestick patterns and trend lines illustration
00:06
HD
Digital Artist Drawing Cryptocurrency Candlestick Chart on a Tablet
00:14
HD
Animated Financial Candlestick Chart With Volume Bars And Moving Average Line. Professional Forex And Crypto Trading Interface Animation.
00:15
HD
financial stock market trading chart with candlestick patterns and upward trend analysis for investment data
00:07
HD
colourful candlestick chart pattern graph with rotating globe infographic dashboard showing word economy modern design business stock market backrground
00:16
HD
Animated Candlestick Chart With Crossing Trend Lines
00:08
HD
Tweezer Top Candlestick Pattern Trading Chart Labeled Animated Overlay Alpha 4K
00:07
HD
Bullish engulfing candlestick pattern with upward arrow on black background
00:05
HD
Financial market chart with candlesticks and line graph, Abstract financial chart with candlestick bars and line graphs market analysis growth and data trends animation
00:10
HD
White Japanese candlestick chart on dark blue gradient field. Financial white Japanese candlestick chart for stock trading analysis. Corporate white candlestick chart.
00:10
HD
Digital candlestick chart showing a bullish engulfing pattern
00:10
HD
Financial Stock Market Candlestick Chart Animating Upward Trend Line Digital Dashboard Data Visualization
00:08
HD
Bitcoin price trend line chart illustrating market data with candlestick patterns suitable for cryptocurrency market analysis.
00:06
HD
Animated stock trading candlestick chart featuring a classic Head and Shoulders bearish reversal pattern that culminates in a dramatic, accelerating crash below the neckline, green bullish
00:10
HD
Abstract financial trading chart with candlestick patterns and trend lines on a dark blue digital background
00:10
HD
Stylized financial chart with candlesticks animation, bar graphs and line plot on black background
00:12
HD
Abstract red stock market candlestick patterns moving downwards across a dark digital screen
00:07
HD
Double bottom trading chart candlestick pattern animation on green background. Candle chart trading goes up animation. Financial market analysis and stock trading motion graphic with alpha channel
00:06
HD
3D animation of a financial candlestick chart showing market trends, stock prices, and percentage gains. Features a dark blue bokeh background with glowing particles for trading themes.
00:15
HD
Digital candlestick chart pattern featuring green and red bars on a dark background illustrating financial market trends and investment analysis
00:15
HD
Stock market candlestick pattern gravestone dogi
00:10
HD
Global Financial Network World Map Candlestick Charts Trading Connections
00:05
HD
Set of eight candlestick financial charts showing stock market volatility and trading patterns on dark background
00:20
HD
Dynamic financial chart glowing stock market upward arrow trend digital data visualization abstract investment growth trading candlestick pattern futuristic finance background economic success
00:05
HD
4K Ultra HD Financial trading chart with candlestick patterns and data analytics on a digital screen in a modern office environment video
00:10
HD
Colorful candlestick chart with vertical bars in dark background
00:12
HD
Bearish Engulfing Candlestick Pattern Trading Chart Labeled Animated Overlay Alpha 4K
00:07
HD
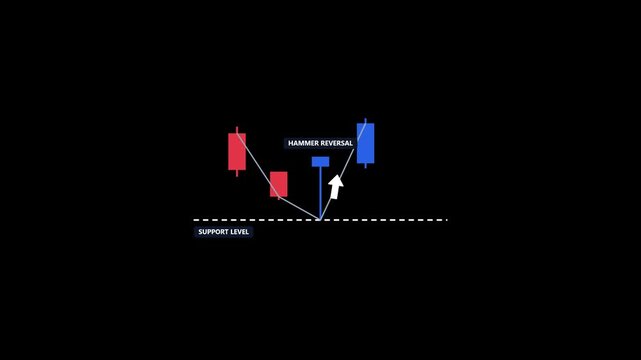
Hammer reversal candlestick pattern at support level in stock market chart
00:05
HD
Stock market price chart with candlestick patterns and trend lines
00:10
HD
colourful candlestick chart pattern graph with rotating globe infographic dashboard showing word economy modern design business stock market backrground
00:16
HD
Financial trading chart showing bearish candlestick pattern
00:10
HD
A financial stock market candlestick chart showing a cyclical wave pattern with green and red bars against a dark background
00:10
HD
Animated financial candlestick chart showing upward trend with red dotted gradient background.
00:14
HD
Abstract finance chart showing various candlestick patterns and a smooth moving average line.
00:15
HD
Financial stock market chart showing a strong bullish uptrend with green candlestick patterns on a dark digital interface
00:12
HD
Head and shoulders pattern forming on candlestick chart, neckline breakdown and zoom out on white
00:16
HD
Closeup of a digital tablet displaying a financial stock market trading chart with candlestick patterns and technical analysis indicators
00:12
HD
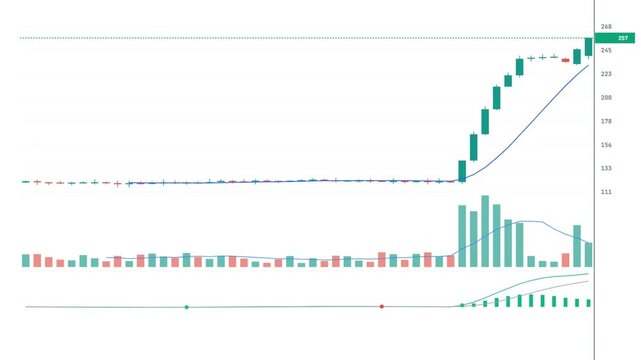
Professional clean financial technical analysis chart displaying asset simulating short squeeze market condition with prominent bullish engulfing formation.
00:09
HD
This image illustrates a financial chart with colorful candlestick patterns layered over a keyboard, representing digital trading and investment evaluations vividly. Copula
00:10
HD
digital financial dashboard with stock market charts, candlestick graphs, data analytics and trading metrics
00:07
HD
Stock market candlestick pattern hammer
00:10
HD
Blue financial candlestick chart stock trading finance graph showing upward trend and dynamic
00:05
HD
Bullish symmetrical triangle pattern forming on stock market candlestick chart indicating potential price increase
00:08
HD
Real-Time Financial Candlestick Chart Animation for Trading Platform UI
00:14
HD
Financial Stock Market Candlestick Chart Animation
00:15
HD
Stock market trading chart with candlestick patterns and financial data analysis background
00:05
HD
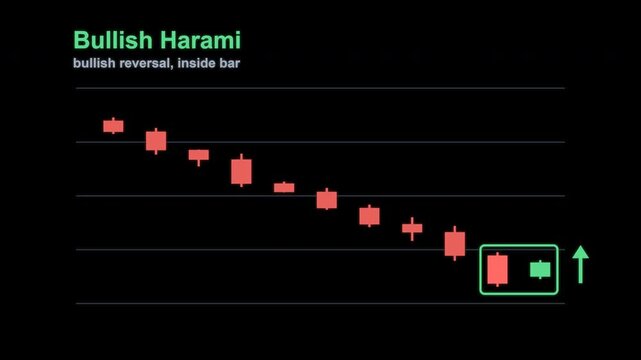
Bullish Harami Candlestick Pattern Trading Chart Labeled Animated Overlay Alpha 4K
00:07
HD
A seamless pattern golden kwanzaa kinara candle holder on black background
00:08
HD
Algorithmic trading interface displaying complex financial candlestick patterns and neon wave oscillation charts on a dark digital screen to visualize real time market price volatility fluctuations
00:06
HD
A financial graph shows market trends with blue and green lines. The candlestick patterns vary in height and color, representing different market movements.
00:10
HD
Digital stock market chart showing fluctuating green and red candlestick patterns on a dark blue background to represent financial trading trends and volatility for global investment analysis.
00:10
HD
Abstract financial market chart with colorful candlestick patterns and dots
00:10
HD
Financial candlestick chart showing a bullish reversal pattern
00:10
HD
Financial stock market crash chart with red bearish candlestick patterns and digital data visualization
00:10
HD
Live financial candlestick chart with an upward trend, financial analysis tool
00:12
HD
Bear flag pattern explained on candlestick chart with labeled flagpole, flag, breakdown and target on beige
00:16
HD
A dynamic financial chart animation with green and red candlestick bars, moving averages, and market volume data against a dark background with floating bokeh.
00:10
HD
Dynamic video concept of a stock market graph, shot at a close-up angle, showcasing fluctuating data lines and candlestick patterns. Live desktop wallpaper.
00:09
HD
This image showcases financial trading analysis with a candlestick chart and a visible upward trend line, symbolizing successful market strategies and investment growth. Copula
00:10
HD
Financial stock market chart with glowing trend lines, candlestick patterns, and data analysis elements
00:07
HD
Stock market candlestick pattern dragonfly dogi
00:10
HD
Stock market chart with glowing candlestick graph, financial data analysis, blue background, investment and trading trends, economic growth, digital financial chart, stock market graph, investment
00:10
HD
Abstract financial chart with bullish candlestick patterns on white digital background.
00:15
HD
An upward trend candlestick chart pattern motion graphic.
00:08
HD
woman analyzing finance data in virtual interface, displaying neon line charts and bar graphs
00:10
HD
Financial stock market chart with candlestick patterns and fluctuating prices on a white background. Concept of economic analysis, trading strategies, financial growth, and market trends.
00:10
HD
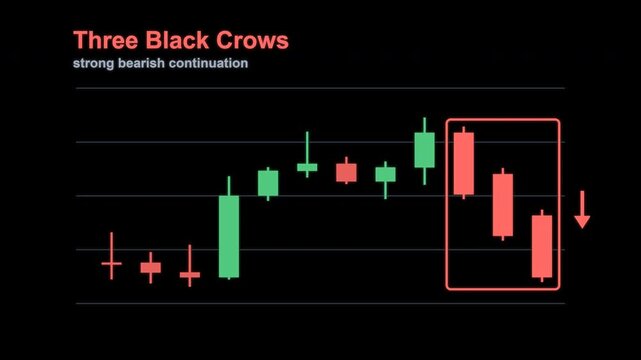
Three Black Crows Candlestick Pattern Trading Chart Labeled Animated Overlay Alpha 4K
00:07
HD
Time lapse clip of candlestick pattern on the computer screen
00:13
HD