ระบบได้ส่งลิงก์สำหรับตั้งรหัสผ่านของคุณไปที่: ต่อไปนี้คุณจะต้องใช้รหัสผ่านในการเข้าถึงสินค้าที่คุณได้ซื้อ
รับภาพประกอบ 25 ภาพหรือวิดีโอ 3 รายการเมื่อทดลองใช้ฟรี
เพิ่มตัวกรองใหม่แล้ว
เรียงลำดับตาม

294 ผลลัพธ์สำหรับ Retail Sector Evolution ใน วิดีโอ

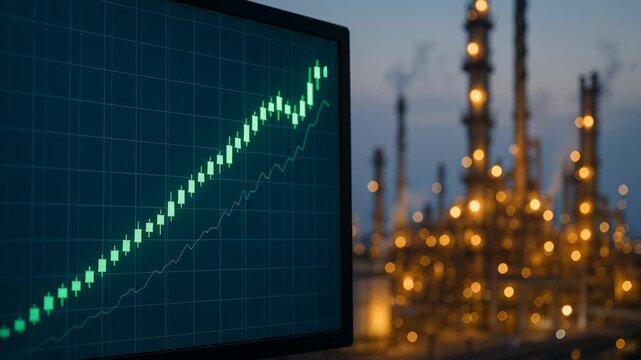
Financial chart overlays power plant and oil refinery, symbolizing global energy economic growth. Represent rising market prices, increased production and demand for petroleum and power generation.
00:18
HD
Pumpjack appear United States flag and deep blue scenery. energy graphic connects domestic petroleum extraction themes of supply, industrial capacity, national resources economic independence. 3D 4K
00:20
HD
Mauritania Oil Revenue Growth 3D Economic Infographic for Energy Sector
00:11
HD
Icons representing various industries and services over world map animation
00:12
HD
Business Woman holding a shop in her hands. Support for small businesses and entrepreneurship. Economic resilience and retail sector stability. SME support programs, economic development
00:19
HD
Drone establishing overview of large retail and commercial sector in Atlanta Buckhead under soft blue hour dusk sunlight glow, building lights shine on
00:08
HD
Futuristic Business Insights with Digital Cityscape and Animated Growth Graph for Modern Urban Development and Economic Success. Entropy.
00:10
HD
Aerial view of low-rise private villas and public high-rise apartment blocks in Singapore
00:29
HD
glowing neon pie chart displaying percentage statistics for retail sectors on a digital interface screen with futuristic data visualizations and hud elements in a dark cybernetic background
00:06
HD
Oil rig development and production schedule set against the US flag. Increase in crude oil production in the United States. Rising oil barrel prices. Boost in exports of American petroleum products
00:07
HD
Retail sector consultants analyzing product lifecycle and packaging solutions to enhance circular economy practices
00:05
HD
White house icon with dollar sign symbolizing rising home prices and real estate market growth
00:10
HD
A realistic portrayal of a real estate market analysis session with experts examining illuminated reports and graphs on property trends highlighting investment returns and sector growth strat
00:05
HD
Oil price movement in emerging markets illustrated by oil pump jack and financial chart reflecting market trends background
00:05
HD
Credit Life Insurance Analyst Word Cloud
00:11
HD
Visual representation of data analytics showing a barrel and graphs related to oil industry trends and market analysis
00:10
HD
Economic Liberalization animated word cloud;text design animation tag kinetic typography seamless loop.
00:18
HD
Business and Industrial Real Estate Investment Trust. Concept Real Estate Investment Trusts, Business Investments, Industrial Properties, Investment Strategies, REITs
00:04
HD
A robot shops for fresh produce in a modern supermarket, showcasing innovation
00:10
HD
Abstract measuring device. Arrow points to Target green sector of scale. Planning, performance, and business goals concept.
00:09
HD
Industrial business concept with rising financial graph overlaying oil refinery plant at night. Symbolize increasing oil prices, refinery operating costs and growth in global power and energy sector.

00:18
HD
Commercial jet approaching with wings spread against blue sky and clouds, flight direction and transport network theme, vertical orientation. Aviation sector facing increasing fuel expenses and
00:07
HD
Credit card panorama displays parts, evolving into a full "SAVE25" card held by hand. It represents card concept, discount, retail, shopping, marketing, offer
00:08
HD
A vibrant stock market graph showcasing an upward trend in neon colors, symbolizing financial growth and success in investment strategies and market analysis.
00:05
HD
The store brings in profit and fills the budget with taxes. Growth of retail trade. Contribution to local economy. Increase in budget revenues. Support for community development.
00:40
HD
Energy market fluctuations are showcased through the depiction of barrels illuminated by a warm, industrial glow, illustrating the dynamics of supply and demand
00:04
HD
Team Collaboration in Office with Urban Skyline Visualization for Data-Driven Decision-Making and Business Strategy Development. Entropy.
00:20
HD
Economic Trends and Urban Landscape: A visualization of economic fluctuations overlays a bustling cityscape, portraying the dynamic interplay between financial markets and urban development.
00:05
HD
Digital Financial Market Trends Analyzing Global Data, Statistics, and Graphs to Showcase Rising Stock Prices and Market Fluctuations
00:05
HD
Close-up view of a stock market chart displaying fluctuating prices and trends
00:10
HD
Property Investment Strategy: Businessman Analyzing Real Estate for Profit Generation
00:10
HD
Abstract representation of stock market data and price trends on a digital screen.
00:06
HD
digital cityscape at night with colorful sound waves illuminating a futuristic street
00:10
HD
Oil prices impact trade developing nations pumpjack barrel energy demand economic growth market trends silhouette sunset
00:05
HD
A panoramic banner illustrating the petrochemical industry and the oil and gas energy sector, emphasizing soaring price charts, growing crude oil production, and key statistics
00:07
HD
Financial growth energy sector oil price graph refinery industrial background upward arrow silhouette symbol trending economic development
00:05
HD
Economic Liberalization animated word cloud-text design animation tag kinetic typography seamless loop.
00:18
HD
Indian Flag with Stock Market Fluctuations and Data Visualization in the Background
00:08
HD
A blurred image of a stock market chart showcases candlestick patterns, hinting at market trends and fluctuations in trading activity. Insights into financial dynamics await.
00:05
HD
Graphs display financial data from a recent market analysis. The image shows trends and statistics through line and bar charts with various values.
00:10
HD
Top down aerial view of residential house construction site overlaid with downward trend graph, symbolizing declining market value, reduced demand and economic slowdown in real estate sector.
00:12
HD
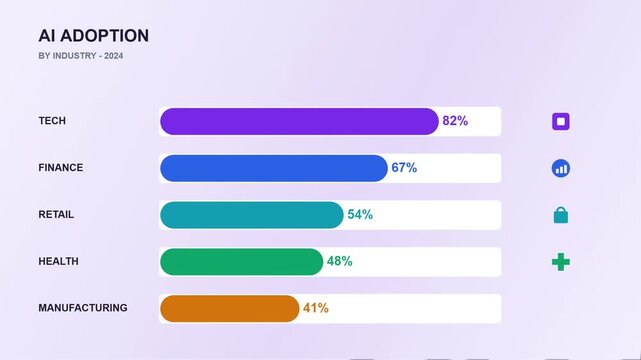
Artificial Intelligence Adoption Rates by Industry Infographic for Twenty Twenty Four Showing Tech and Finance Leads
00:10
HD
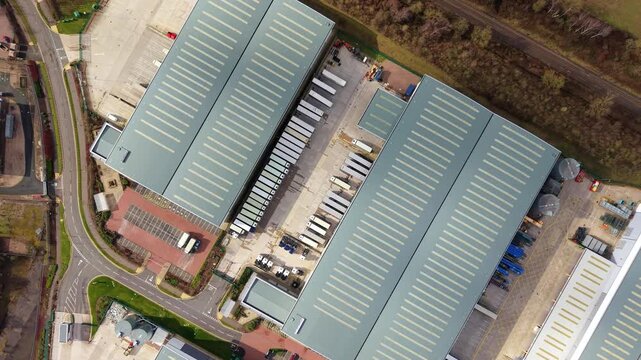
Top-down aerial drone view of a large distribution centre in Birmingham, UK, featuring rows of HGVs waiting at busy warehouse loading bays.
00:12
HD
Small house model surrounded by coins with stock market charts in background
00:15
HD
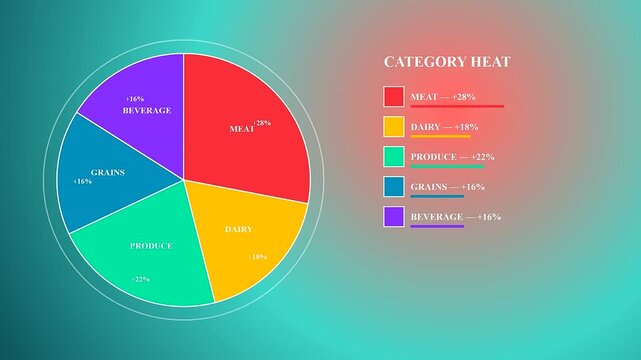
Grocery price rises are illustrated through dynamic animated pie charts that depict evolving percentage changes for various food categories in a sleek modern digital data presentation
00:06
HD
Bar chart showing upward trend with alternating colors representing growth.
00:08
HD
Futuristic Robot Hand Holding Holographic Chart Diagram Representing Data Analysis and Business Growth in Digital Environment. Entropy.
00:10
HD
A vibrant stock market graph displaying fluctuating prices and trends, symbolizing financial activity, investment, and analysis
00:05
HD
Positive Trend in Energy Stock Market Growth and Investment Opportunities in Gas Finance
00:05
HD
Commercial jet flying in open sky, international air transport concept. Airlines facing higher fuel expenses and operational pressure. Energy market instability impacting aviation sector
00:12
HD
A vibrant display of oil market trends intertwines with a bustling urban background, showcasing the interplay of financial activity and energy commodities
00:04
HD
Investors strategizing to analyze potential profits in real estate sector due to rising interest rates in property financing. Concept Real Estate Investment, Interest Rates, Profit Analysis
00:05
HD
Rainbow arching across a soft pastel background, evoking a sense of joy and tranquility
00:10
HD
Oil prices impact trade developing nations with barrels pumpjacks symbolizing energy economy market shifts and industry growth
00:05
HD
Abstract financial chart with data trends and graphs illustrating market fluctuations.
00:10
HD
Canadian flag superimposed on stock market data represents canada s economic landscape and trends
00:05
HD
Economic Liberalization animated word cloud;text design animation tag kinetic typography seamless loop.
00:18
HD
Stock market graph with financial data overlay classical building and cityscape skyscraper background showing dynamic vibrant trading and market
00:05
HD
Consumer behavior impacting commerce, resources, and digital analytics, with purchasing trends influencing sustainable practices and market analysis across various sectors
00:17
HD
World map with digital icons showing different global activities and services for various industries and sectors
00:10
HD
Stock market trends highlight an upward movement in various sectors. Graphs display consistent growth over different periods, indicating positive economic activity
00:10
HD
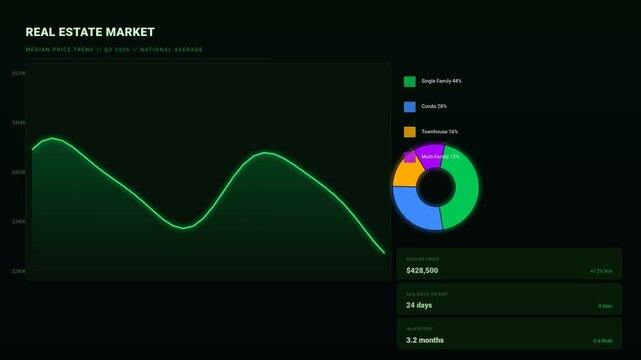
Real Estate Market Data Analytics Dashboard with Line Chart and Donut Graph
00:15
HD
Top-down aerial drone view of a large distribution centre in Birmingham, UK, featuring rows of HGVs waiting at busy warehouse loading bays.
00:13
HD
A stock market chart displayed on a computer screen illustrates market trends and fluctuations, providing valuable insights for investors and analysts in real-time.
00:05
HD
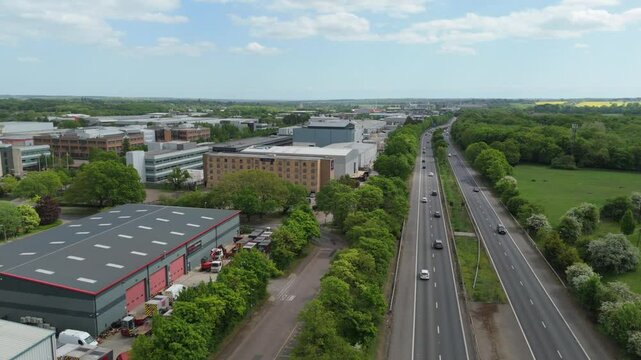
Aerial drone view of warehouses and industrial units near Stevenage England in the logistics sector
00:12
HD
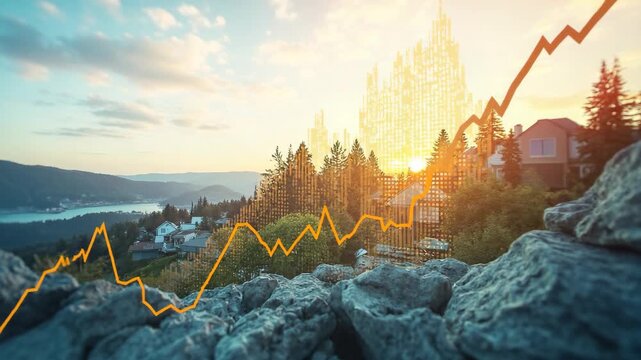
A scenic mountain village with houses bathed in sunlight, combined with a dynamic stock market chart overlay, symbolizing rising real estate prices and investment growth in the housing sector.
00:10
HD
Futuristic robotic hand interacting with holographic house icon, representing technology, smart homes, and digital transformation in real estate sector Gluon.
00:10
HD
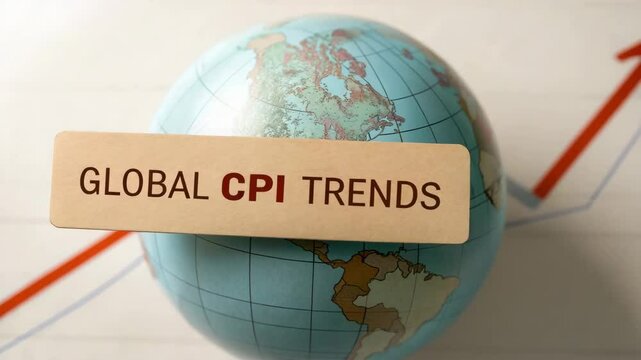
Global CPI trends reveal customer behavior and price fluctuations, providing crucial data and analysis on inflations impact on world economy.
00:05
HD
Global Financial Market Trends Indicate Upward Movement in Stock Prices and Investment Opportunities Reflecting Economic Growth
00:05
HD
A financial chart displaying price movements and trading volume over time.
00:10
HD
Oil rig rising arrow of growing economic of oil market, illustrating the connection between energy production and market growth. ..Created with Generative AI, not depicting real subjects.
00:10
HD
Oil Reserves - Endless Rows of Barrels. Storage and Oil Production Abstract 3d Animation. A lot of Oil Barrels Zoom Out. Business and Industry Concept 4k UHD 3840x2160.
00:12
HD
digital sound wave visualization with colorful peaks representing audio frequencies
00:10
HD
Escalator in mall. Concept Shopping Mall, Moving Stairs, Urban Architecture, Retail Environment
00:04
HD
Algeria Oil Revenue Growth 3D Economic Infographic for Energy Sector
00:11
HD
Canadian flag superimposed on stock market data represents canada s economic landscape and trends
00:05
HD
Economic Liberalization animated word cloud-text design animation tag kinetic typography seamless loop.
00:18
HD
Ancient classical bank architecture with columns and pediment reflecting investment trends red financial stock market chart showing upward
00:05
HD
A silhouetted wind turbine stands before an orange sky overlaid with a financial chart showing price fluctuations
00:08
HD
A video showcasing a genuine discount offer on a white background
00:08
HD
Oil Industry Growth: A pump jack, silhouetted against a fiery sunset, is juxtaposed with a rising financial graph, symbolizing the ascent of the oil industry, economic strength, and energetic growth.
00:05
HD
Sunset over Industrial Area
00:15
HD
Energy sector insights oil and renewable resources financial trends global market analysis
00:10
HD
Hands place medical pills over stacks of US hundred dollar bills
00:15
HD
Column chart with ascending curve shows a positive development in the financial sector with figures and binary data in the background - on black
00:20
HD
Exploring data visualization and analytics trends from various industries in 2023
00:10
HD
Digital Financial Growth Concept with Graphs and Charts Displayed on Laptop Keyboard for Business Analysis and Market Research. Entropy.
00:10
HD
Price Index and Customer Sentiment Analyzing Inflations Impact on Economy with Financial Statistics and Chart Trends
00:05
HD
Investment Opportunity in Energy Stocks Growth in Market Driven by Gas Prices and Solar Innovation
00:05
HD
Searching Pharmaceutical Industry on the Internet, Computer Screen Macro
00:11
HD
Economy grunge concept
00:10
HD
Miniature houses surrounding a pie chart representing housing market share
00:05
HD
Audio waveform illustration showcasing sound frequencies in a colorful spectrum
00:10
HD
Visual Representation of a Booming Real Estate Market with Growing Property Investments and Sales Prices. Concept Real Estate Market Trends, Property Investments, Sales Prices, Booming Markets
00:04
HD
Bangladesh Oil Revenue Growth 3D Economic Infographic for Energy Sector

00:11
HD
Oil prices impact developing nations energy market with global demand economic growth and world map showing oil pumpjack
00:05
HD
Economic Liberalization animated word cloud;text design animation tag kinetic typography seamless loop.
00:18
HD
Iran country typography on the black backdrop with yellow underline, highlighting 4k animation
00:09
HD
Industrial drone perspective of a busy freight distribution centre, illustrating the precision of loading bay operations and HGV logistics.
00:16
HD
Oil Barrels Falling Seamless on Black Background. Looped 3d Animation of Oil Reserves Moving Down. Growing Prices and Volume of Oil Production. Business and Industry Crisis Concept 4k UHD 3840x2160.
00:10
HD