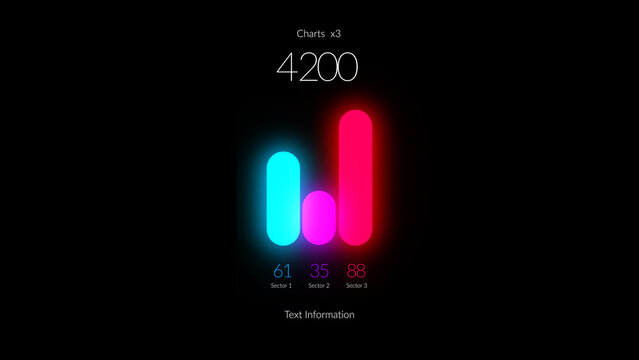
HUD Neon Infographics Chart Bars x3

Organizational Org Chart Infographic Template
8 Infographics Elements

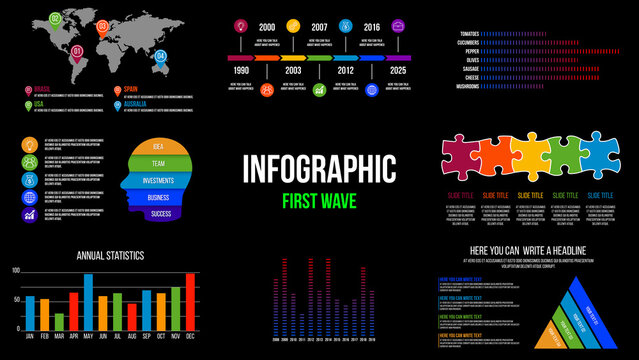
Modern Business Infographic Elements Set

Account Service Dashboard

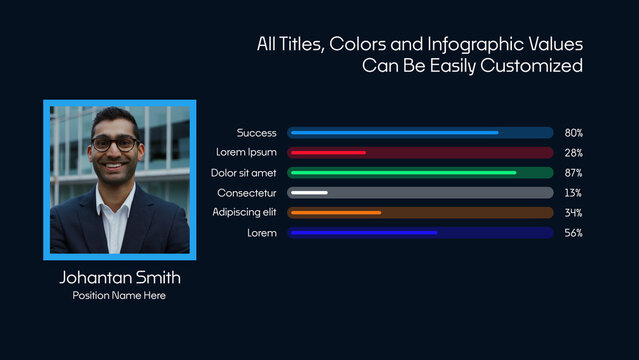
Modern Business Infographic Template with Connective Workflow Chart and Photo Placeholders

Blue Clean Fintech Invoice And Letterhead
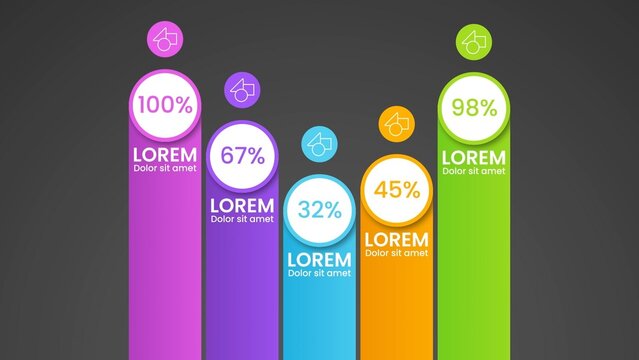
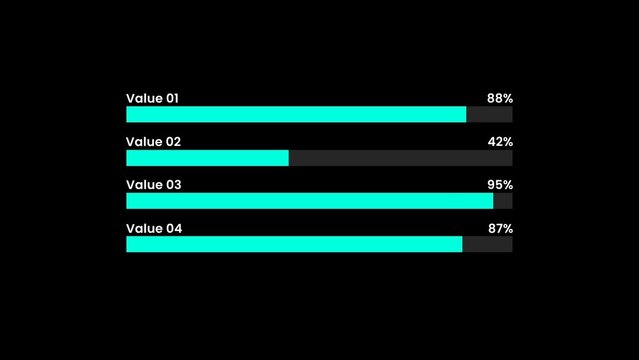
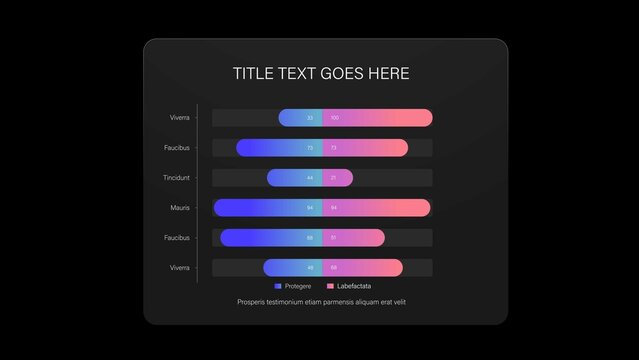
Gradient Graphic Bar Value Comparison Infographic

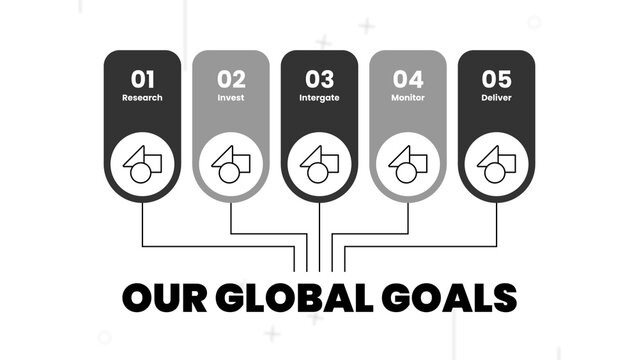
Business Growth Strategy Plan Infographic Template
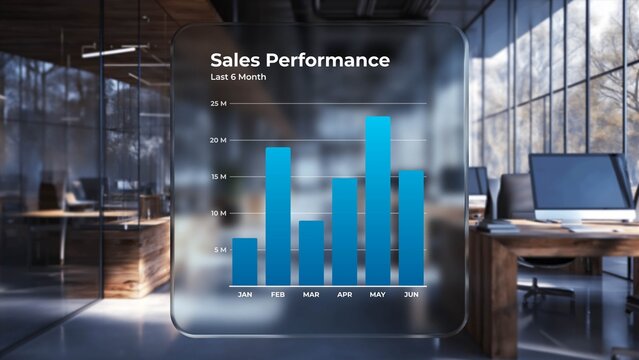
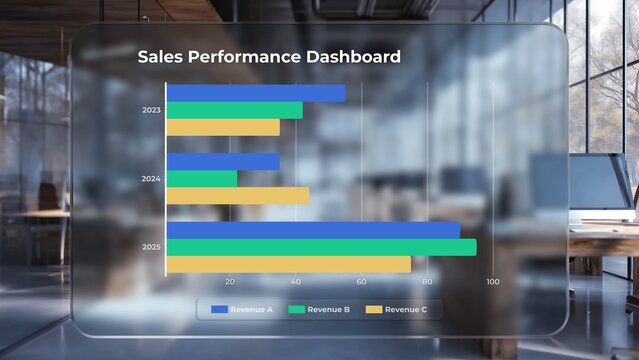
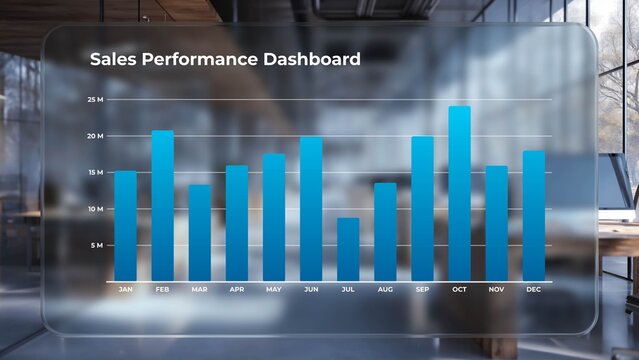
Glassmorphism Sales Performance Dashboard
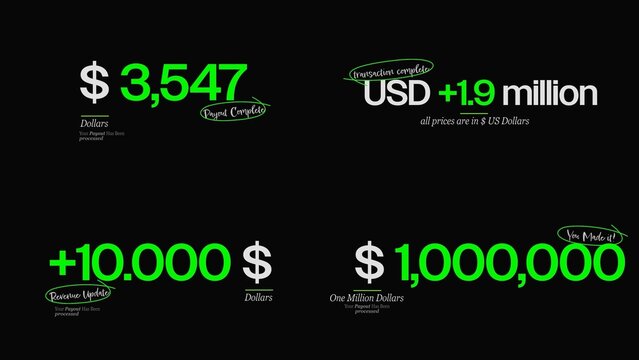
Currency Counters Text Animations | Animated money values, exchange rates & price displays for finance & banking.

Dark Curved Flow Infographic Template

Professional Corporate Funnel Chart Infographics for Business Marketing Strategy

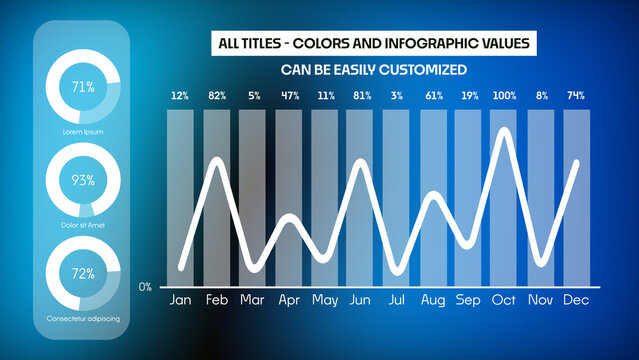
Bright And Bold Color Infographic Layout
ฟรี

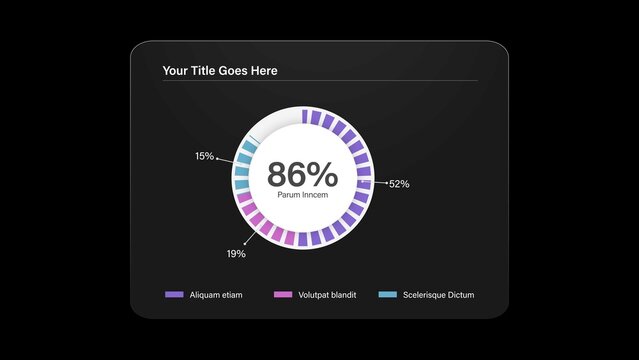
Circular Third Progress Infographic
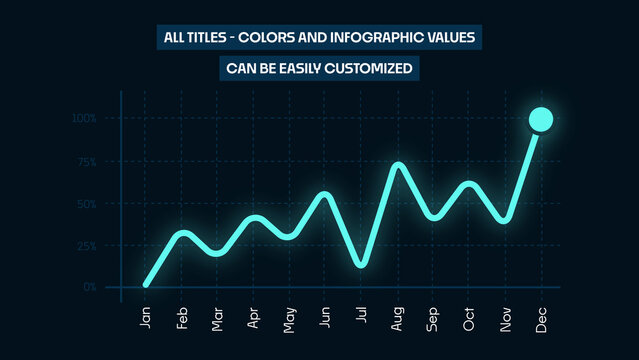
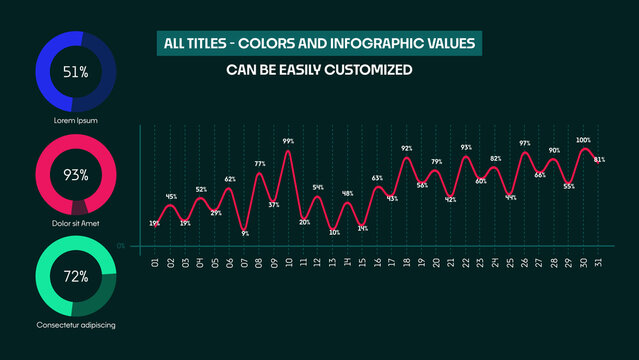
Animated Line Chart Infographics | Business Data Visualization and Analytics Graph

Client KPI Dashboard Presentation Infographic
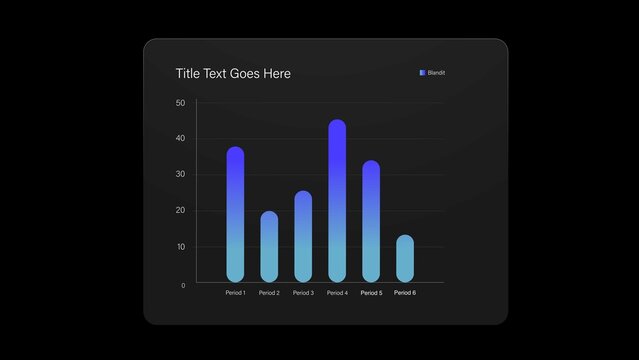
Infographic Bar Chart Video Template

Data Analytics Management Dashboard

Editable Graph Elements for Data Visualization Layouts
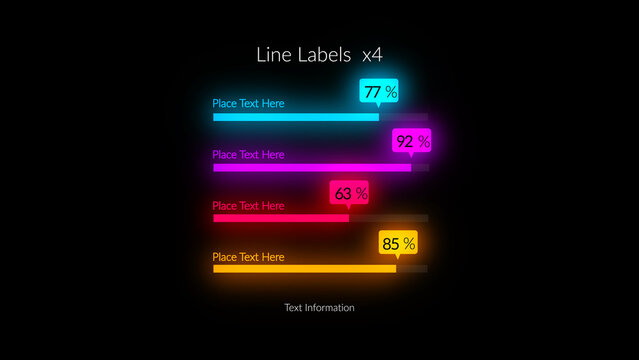
HUD Neon Infographics Lines Labels x4

Bar Graph Infographic Template
8 Infographics Elements

Minimal Data Table Infographic Template Design for Business Financial Report Presentation

Modern Analytics Dashboard UI Design for Business Management

Business Infographic Template with Five Colorful Arrows and Circle Icons
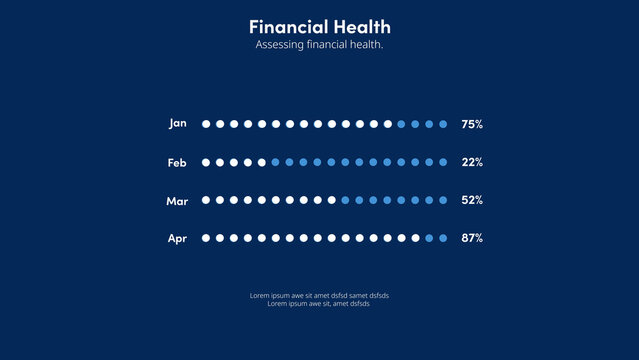
Financial Health | with Control Panel
Corporate Business Infographic
ฟรี
Business Growth Infographic Template with Illustration of Vision
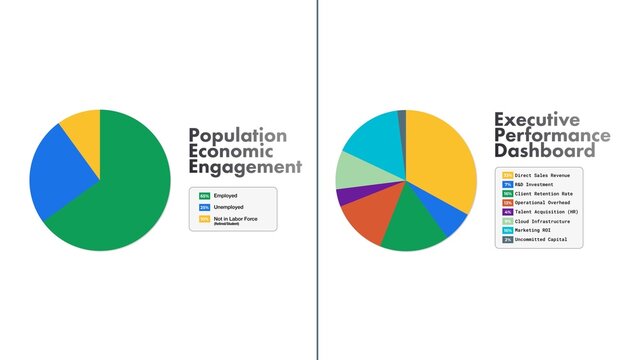
Pie Chart Analytics Dashboard
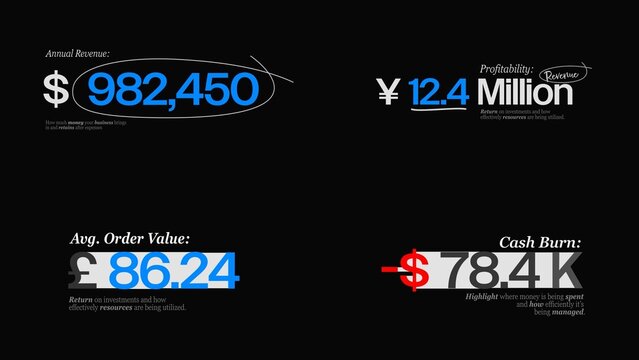
Finance Business Counters Text Animations | Animated KPI numbers for revenue, profit & corporate growth presentations.

Business Chart Slideshow
Modern Corporate Annual Report Presentation with Financial Infographics & Charts
Colorful Peta Minda Data infographic Illustration Set
Circle Breakdown Infographic
Daily Data Infographics
Bar chart infographic template with clean layout
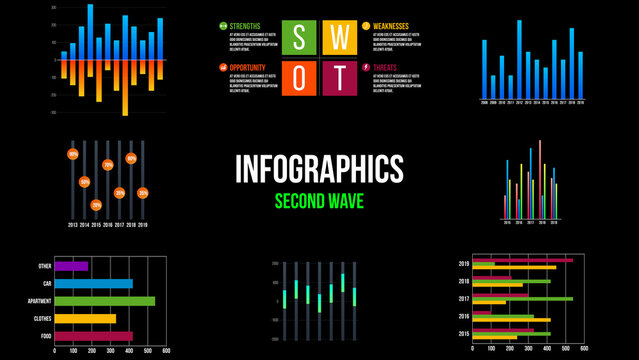
Infographics
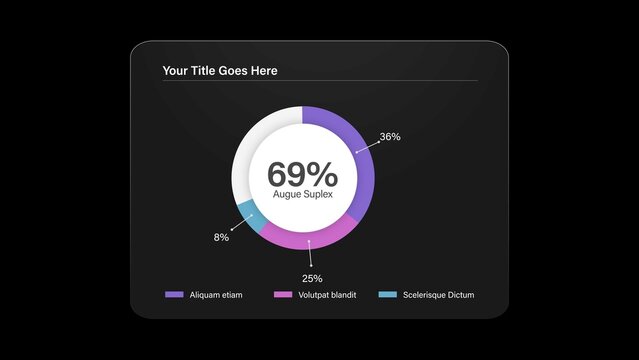
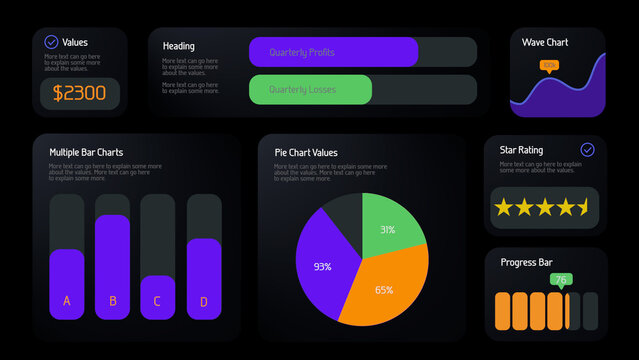
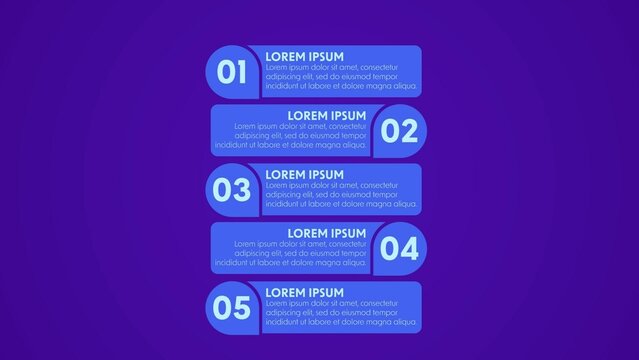
Dark-themed Infographic with Purple Accents
Infographic Pie Chart Animation Template
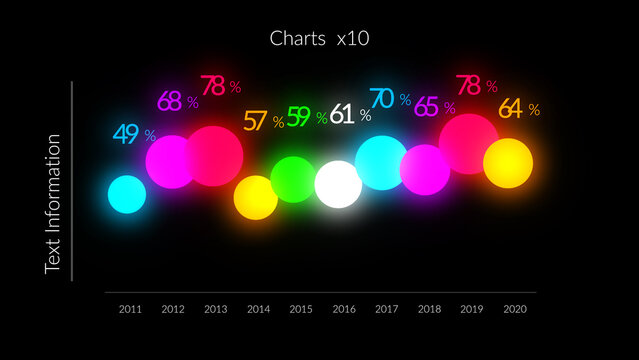
HUD Neon Infographics Chart Bars x10
Bento Box Business Infographic Template For Dashboard Report, KPI Metrics, Data Visualization
Dynamic Pricing Plan Infographic Set Template
Modern Organization Chart Infographic Template for Corporate Structure and Team Presentation
Nightingale Rose Infographic with Blue and Yellow Accents
Colorful Seven Steps Horizontal Infographic Template
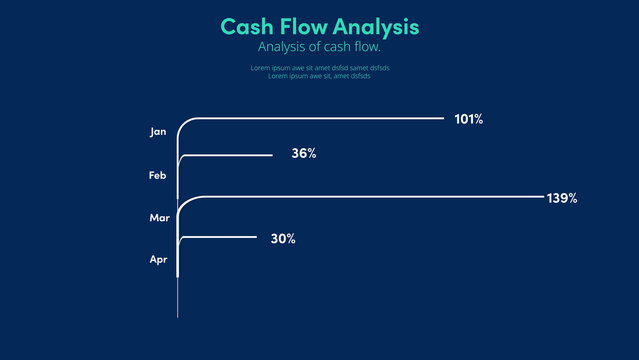
Cash Flow Analysis | with Control Panel
Animated Bar Chart Universal Infographic
Editable Radar Chart with Increments Infographic Template
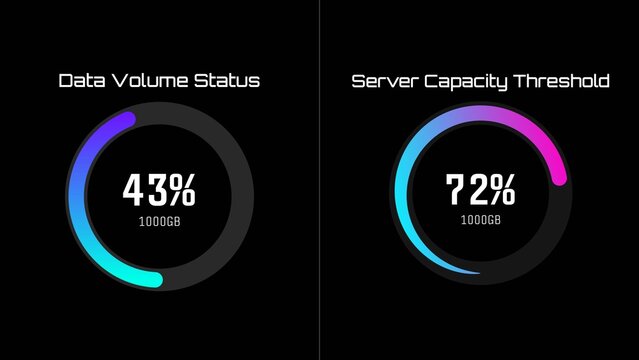
Modern Tech Circular Progress Infographic
Three-Color Infographic Elements Set 1
Infographics Elements.
Family Tree and Organizational Structure Infographic Presentation Template
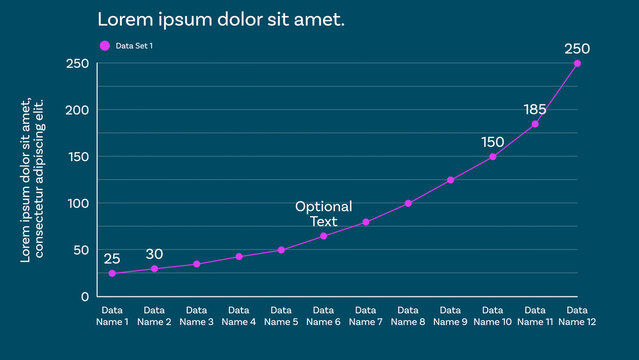
Responsive Line Graph for Clean and Modern Data Visualizations Design and Slide Presentations with up to 12 Animated Data Points and Optional Labels to show Percentages, Whole Values, and Custom Texts
Segmented Perspective Infographic
Corporate Infographics
Infographic Elements Presentation
Dynamic Sales Analytics Dashboard UI Kit
Purple Bold Infographic
Infographic Pie Chart Animation Template
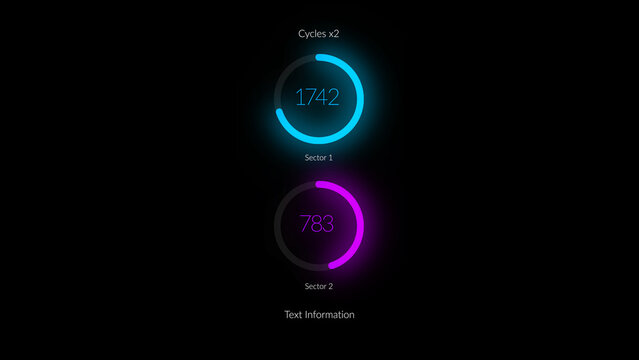
HUD Neon Infographics Cycles 2
Bento Box Business Infographic Template For Dashboard Report, KPI Metrics, Data Visualization
Annual Report Template Layout
Modern Annual Report Presentation Template for Corporate Business & Finance
Longform Infographic Set
ฟรี
Seven Steps Vertical Infographic Template with Colorful Banners
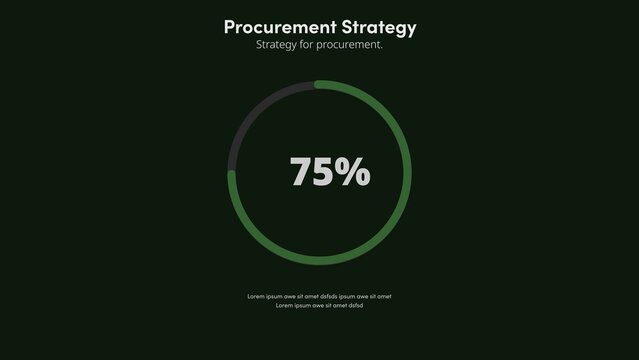
Procurement Strategy | with Control Panel
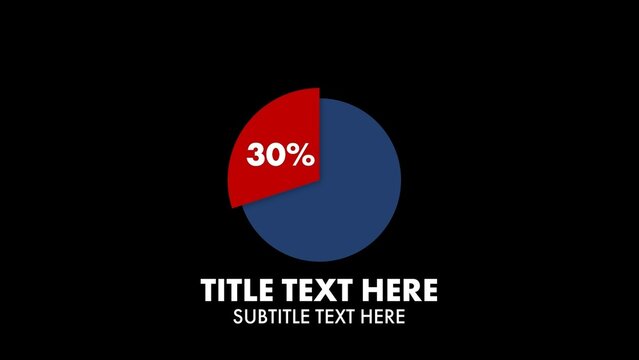
Animated Infographics Pie Chart Percentage
Business Strategy Minimal Design Infographic Template with Growth Illustration
Glass UI Business Analytics Chart
Three-Color Infographic Elements Set 2
Bento Widget Infographic Tabs
Modern Genealogy Family Tree Infographic and Business Org Chart Presentation Template
Five Options Infographic Layout
Three Data Branches Infographic
Personal Success Infographics | Animated Charts & Data Visualization for Achievement Analysis
Five Steps Business Statistics Infographic Layout
Clean And Minimal Real Estate Analytics Dashboard
Widget Style Infographic
Infographic Bar Chart Video Template
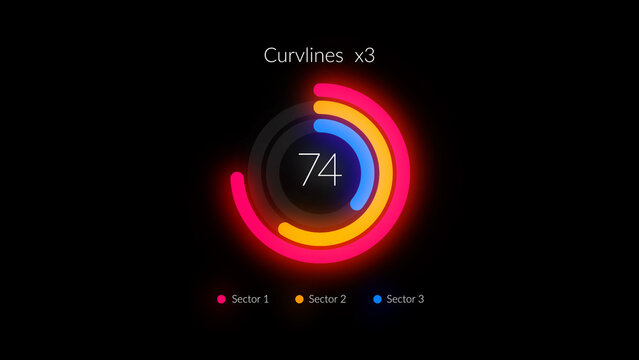
HUD Neon Infographics Curve Lines x3
Process Flow Infographic Template in Modern Minimal Style
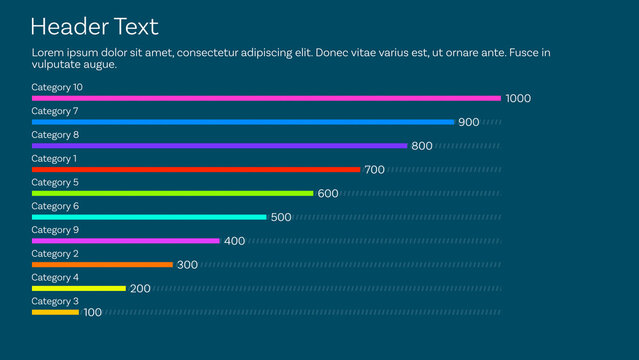
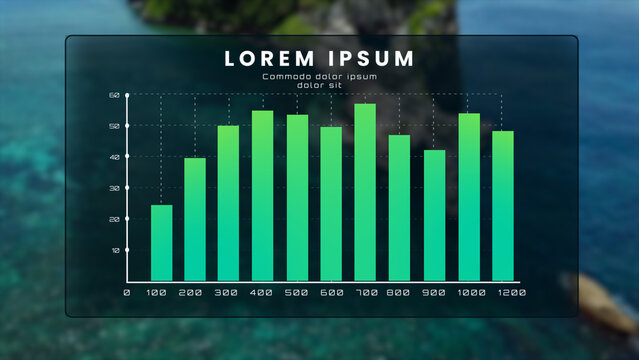
Horizontal Bar Chart for Design and Data Visualization Design and Slide Presentation and with 10 Animated Data Points + Responsive Custom Text + Color with Ordering Options and 3 Options for Bar Width
Global Business Growth Timeline Infographic Template with World Map Illustration
Editable Graph Elements for Data Visualization Layouts
Business Infographic Timeline Template with World Map Background and Photo Placeholders
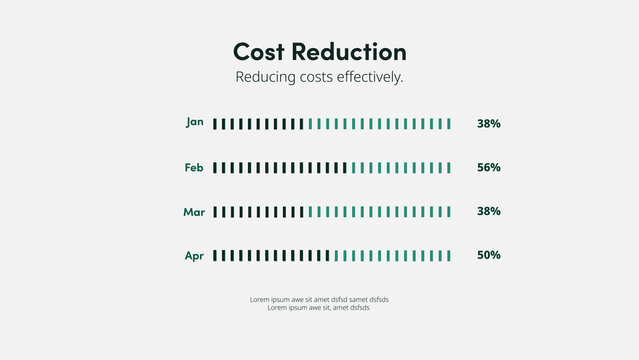
Cost Reduction | with Control Panel
Clean Modern Points With Details Infographics Template
Business Pie Chart Infographic Template with Minimal Illustration
Corporate Glass Bar Chart
Colorful Modern Business Infographic Data Statistics Presentation Template
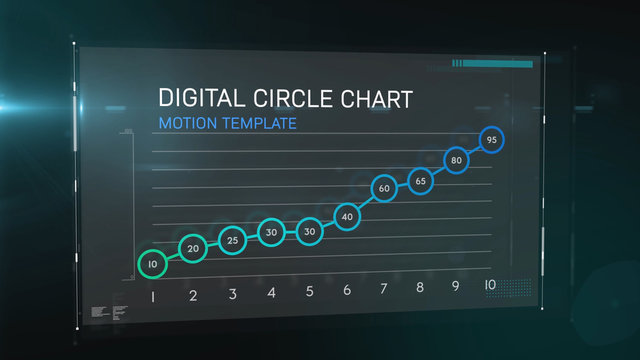
Digital Circle Chart
Editable Family Tree and Org Chart Infographic Template for Modern Presentation Design
Minimal Business Table Layout with Simple Icons
Ribbony Circular Loop Infographic
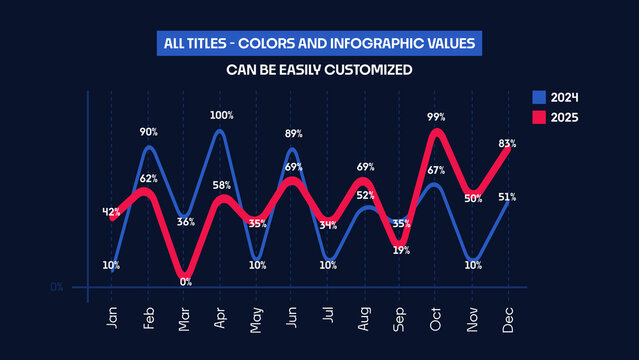
Animated Infographics Comparison Chart | Dynamic Line Graph for Business Finance and Marketing Data Visualization
Infographic Layout For Five Steps
Professional Bank Account Management Dashboard
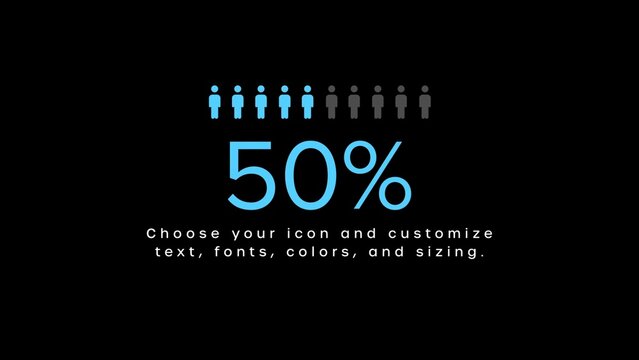
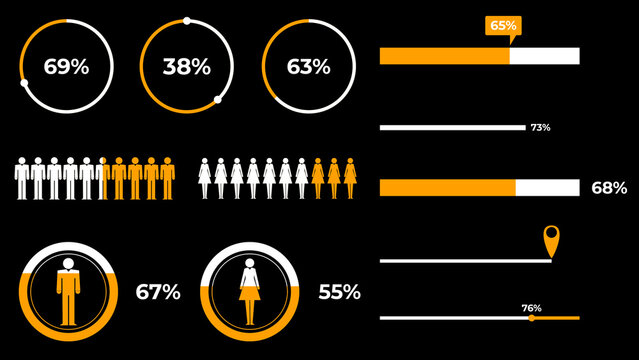
Infographic Maker with Percentage
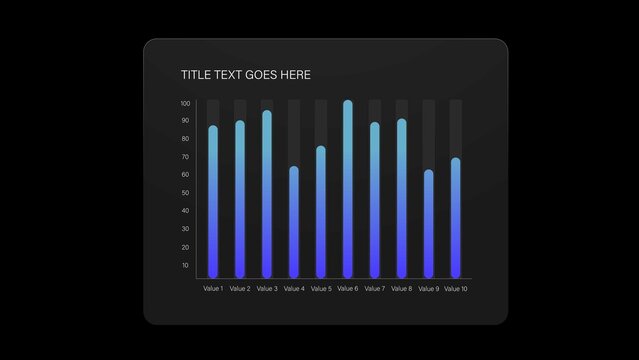
Infographic Bar Chart Video Template