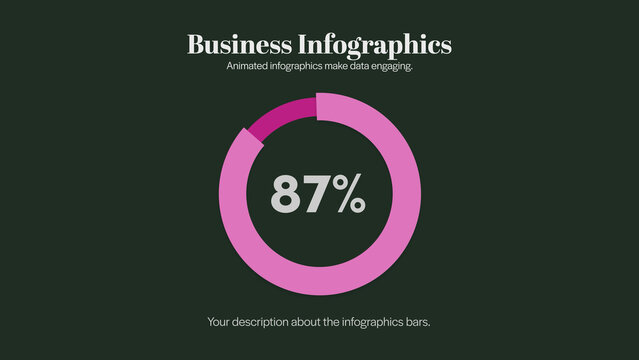
Clean Professional Value Number Increase Kinetic Title

Business Growth Infographic Template with Illustration of Vision

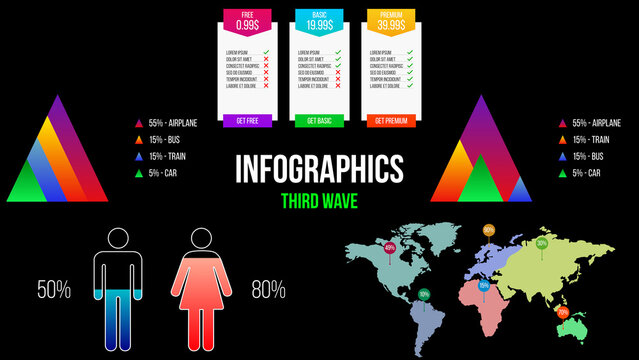
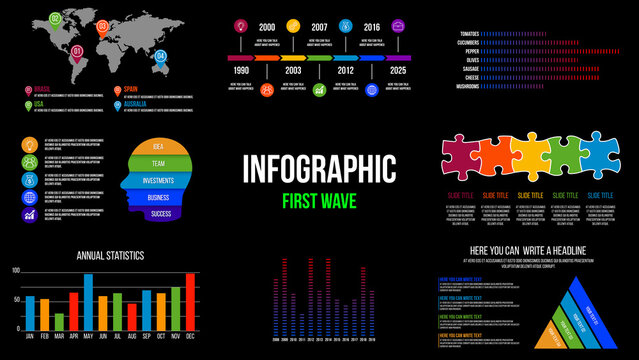
Infographic Design Template Layout

Data Table Infographic Template

Modern AI Dashboard UI Wireframe Design with Analytics Panels and Data Visualization Layout

Halftone Heatmap Photo Effect

Multipurpose Circle Timeline Infographic Template

Roadmap Infographic Layout

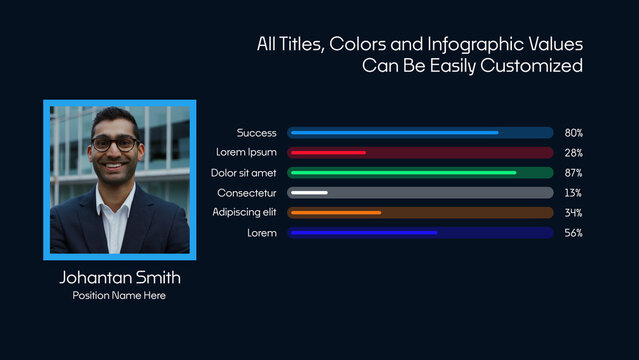
Corporate Presentation Information Titles

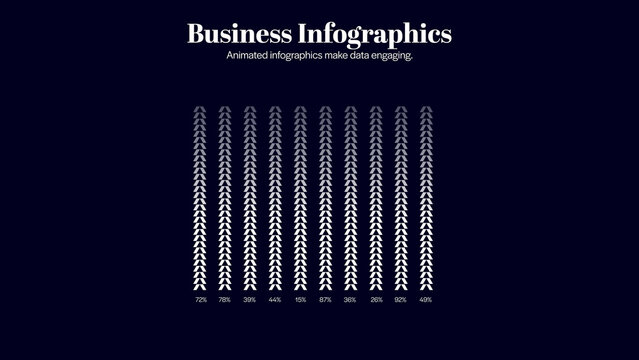
Rising Growth Arrow Data Visualization

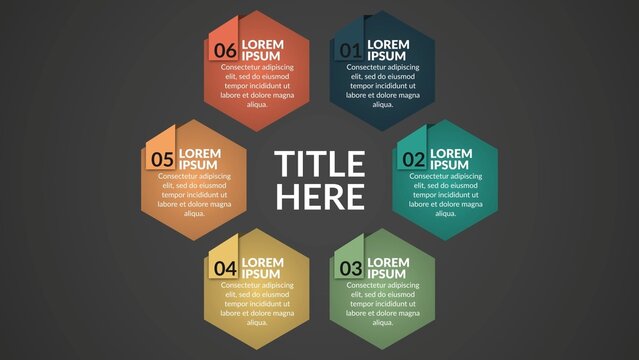
6 Step Business Project Journey Infographic

Process Cycles Lines x4 – Animated Workflow Steps, Business Timeline and Flowchart Presentation, Modern Corporate Infographic for Strategy and Marketing
5 Infographics Elements

Editable Medical Infographic Template with Human Anatomy Elements and Data Visualization Statistics for Healthcare Reports.

Data Analyst Resume

Professional Corporate Funnel Chart Infographics for Business Marketing Strategy

Blue Clean Fintech Invoice And Letterhead

The Fitness Reality Infographic

Horizontal Chart Table Layout with Dark Background
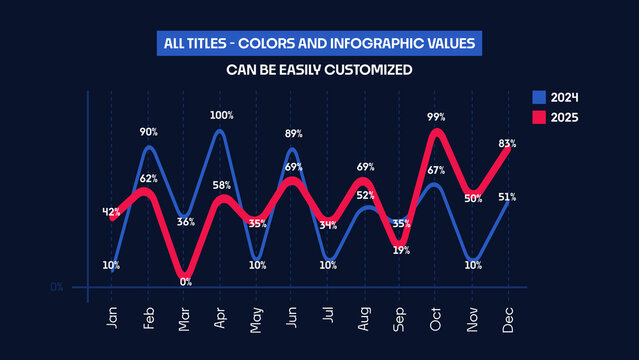
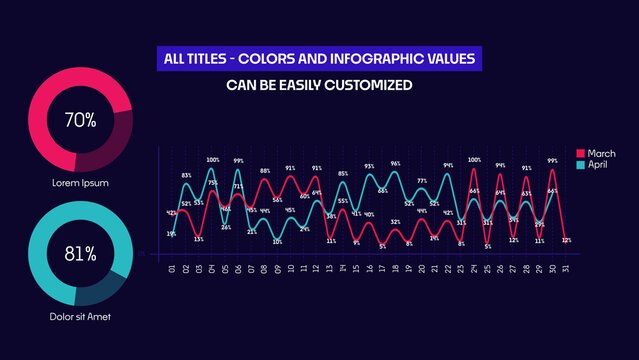
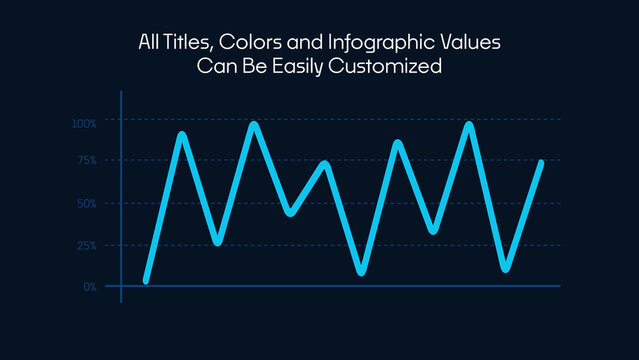
Animated Infographics Comparison Chart | Dynamic Line Graph for Business Finance and Marketing Data Visualization
Clean Data Visualizer
Financial Risk Assessment | 5 Different Resolutions with Control Panels

Creative Brief Presentation Template Design

Minimalist Area Chart Infographic Template

Modern Analytics Dashboard UI Kit Wireframe Design

Dual Input Loop Infographic
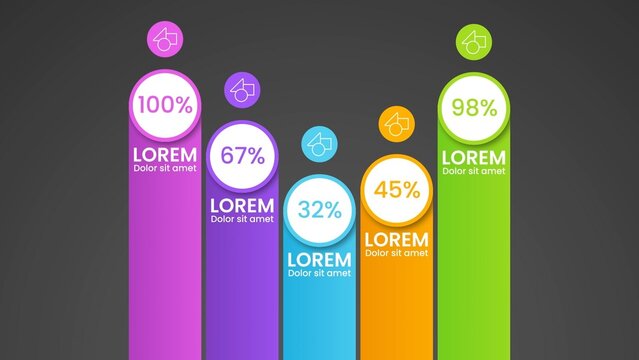
Modern Business Infographic Template with Five Colorful Data Points
Timeline Infographic Template
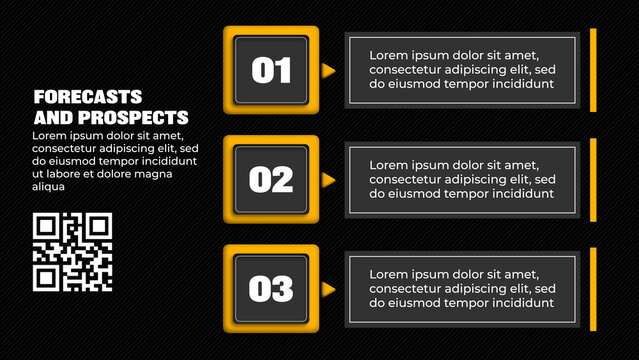
Informational Corporate Presentation Titles
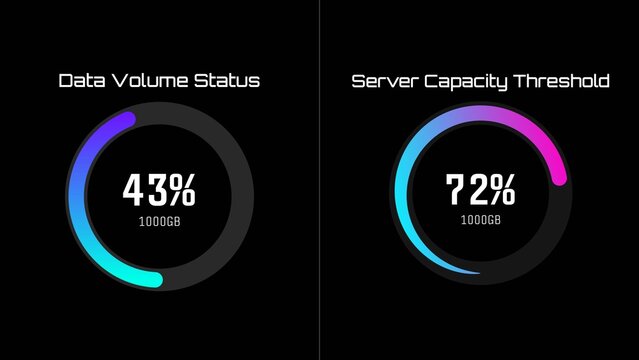
Modern Tech Circular Progress Infographic
Business Acquisition and Merger Infographic Template
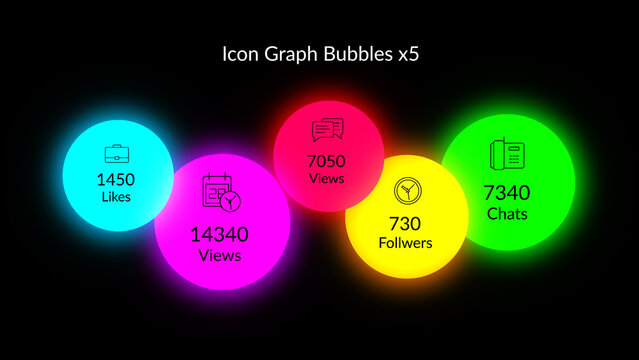
HUD Neon Icon Graph Bubbles x5
8 Infographics Elements
Big Data Website Hero Image Layout with Colorful Waves
Account Service Dashboard
Modern Business Growth Strategy Infographic with Purple Stairs Vector Illustration
Cyber Security Dashboard
Annual Report Presentation Template
Editable Chart Design with 6 Months Option
Daily Data Comparison

Clean Professional Value Number Increase Kinetic Title
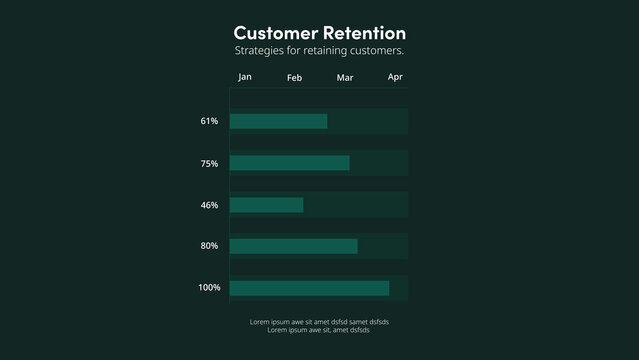
Customer Retention | with Control Panel
Bright Infographic Layout with Simple Graphics
Donut Doughnut Chart Infographic Template
Business Report Infographic Layout
Circular Third Progress Infographic
Modern Vertical Timeline Template Infographic for Business Presentation
Modern Business Growth Infographic Template with Data Visualization Elements

Blue Dawn - Particle Cinematic Titles
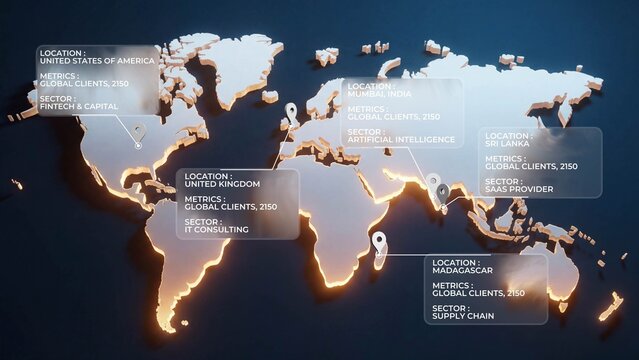
World Map Data Visualization
Business Growth Strategy Plan Infographic Template
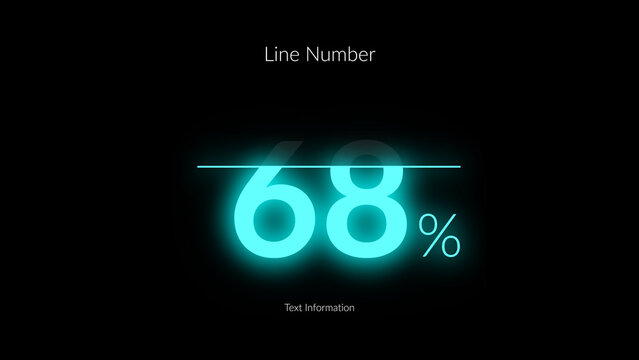
HUD Neon Infographics Line Number x1 – Futuristic Sci Fi Data Interface, Glowing Digital Dashboard Elements, Cyberpunk Analytics Charts, Tech UI Visualization Pack
8 Infographics Elements
Colorful Shiny Waves Big Data Network Concept
Educational Dashboard Template
Minimal Iceberg Infographic Design for Business Data Visualization
Medical Dashboard Design Template
Client KPI Dashboard Presentation Infographic

Business Chart Slideshow
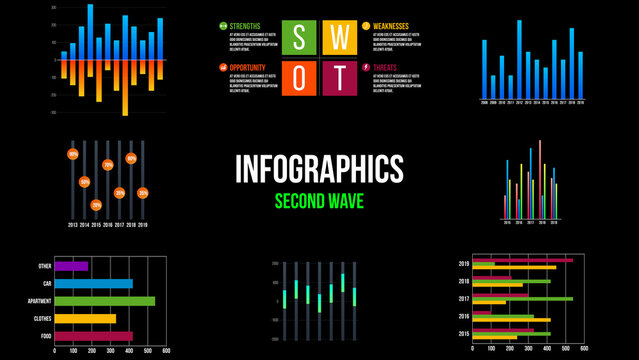
Corporate Infographics Template | Dynamic Data Visualization, Business Marketing and Statistical Graphs for Presentations

Clean Professional Value Number Increase Kinetic Title
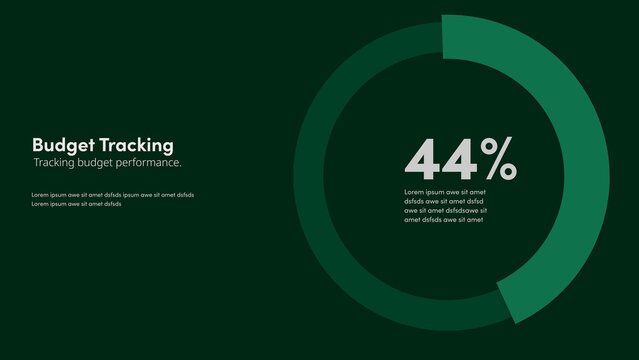
Budget Tracking | with Control Panel
Bright And Bold Color Infographic Layout
ฟรี
Line Graph Time Series Chart Infographic Template
Nightingale Rose Infographic with Blue and Yellow Accents
Circle Parts Description Infographic
Abstract Winding Timeline Infographic Template with Gradient Path
Modern Corporate Annual Financial Highlight Report Brochure Template
Data Visualization Technology Layout
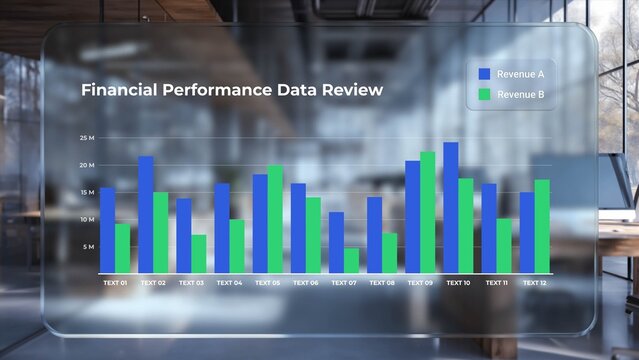
Glass Dashboard Bar Chart Infographic Template
Business Merger and Acquisition Deal Infographic Template
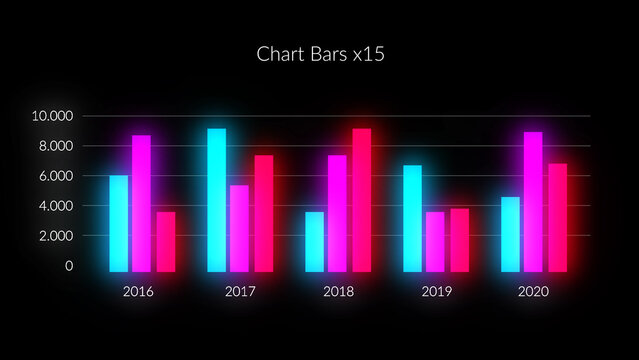
HUD Neon Infographics Chart Bars x15
Presentation Layout
Big Data Website Hero Image Layout with Rays Concept
Financial Data Overview
Dark-themed Infographic with Purple Accents
Cryptocurrency Dashboard Template
Infographic Layout For Five Steps
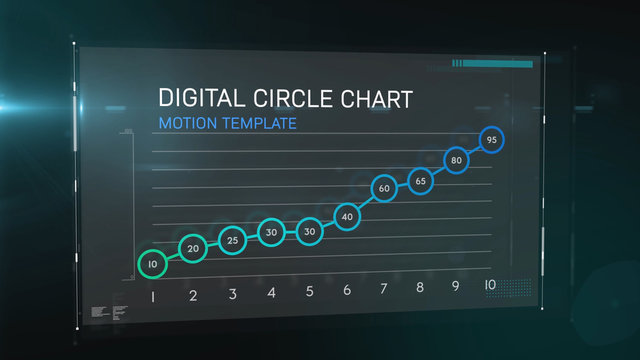
Digital Circle Chart
Personal Success Infographics | Animated Charts & Data Visualization for Achievement Analysis
Gradient Graphic Bar Value Comparison Infographic
Profit Margin Analysis | 5 Different Resolutions with Control Panels
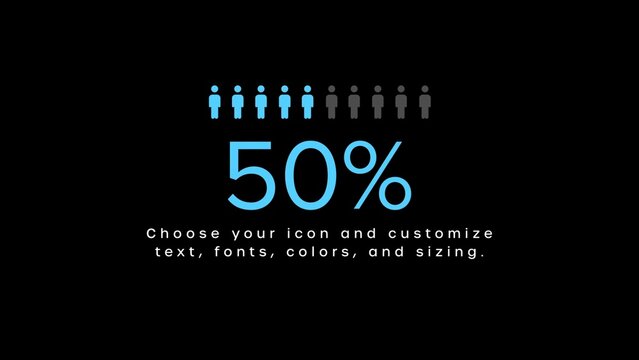
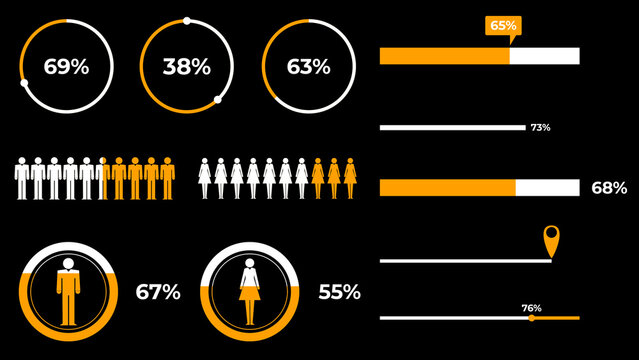
Infographic Maker with Percentage
Iceberg Infographic Template
Minimalist 2 Step Percentage Circle Infographic Diagram for Business Plan and Execute Strategy
Segmented Perspective Infographic
Modern Five Step Business Infographic Template with Wavy Arrow Flow
Minimalist Timeline Infographic Template
Annual Report Template Layout
Colorful Annual Overview Layout with Graphs
Process Flow Diagram Infographic Template Minimal Design
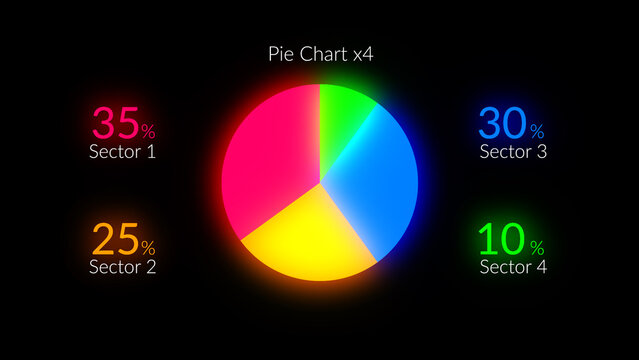
HUD Neon Infographics Pie Chart x4 – Futuristic Sci Fi Data Interface, Glowing Digital Dashboard Elements, Cyberpunk Analytics Charts, Tech UI Visualization Pack
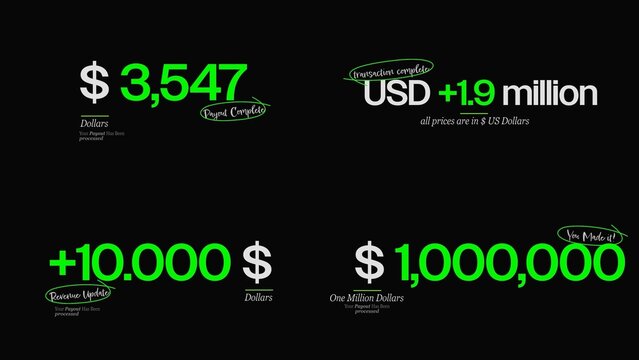
Currency Counters Text Animations | Animated money values, exchange rates & price displays for finance & banking.
Big Data Website Hero Image Layout Concept
Data Analyst Resume
Infographics Elements.
Education Dashboard Design Template
Five Steps Business Statistics Infographic Layout
Five Options Infographic Layout
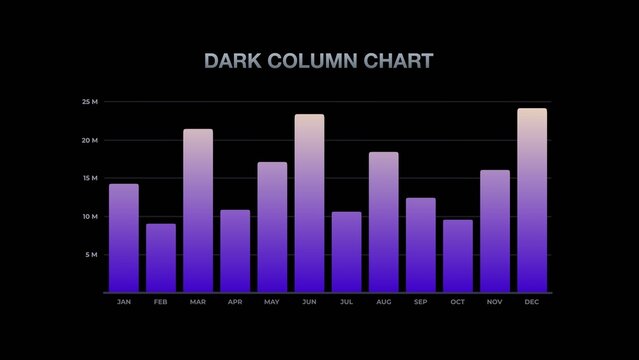
Modern Gradient Dark Column Chart