

Account Service Dashboard

Creative Startup Pitch Deck Presentation Template for Investor Slide Decks & Fundraising Roadmaps

Annoul Report Brochure Template
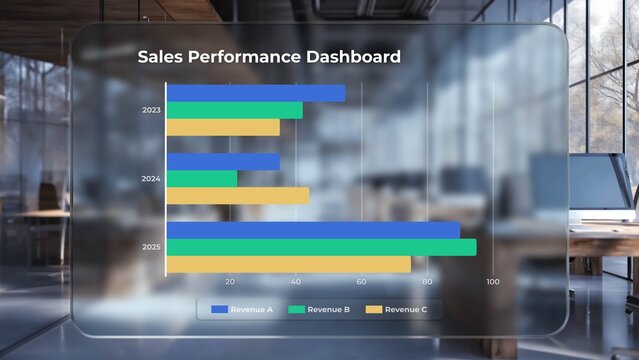
Glass UI Business Analytics Chart

Project Management Dashboard Layout

Hud Generic

Professional Tablet Mockup Showing Business Analytics Dashboard in Hands

Admin Dashboard Template Layout

Financial Sale Dashboard Design Layout

AI Agency Social Media Carousel
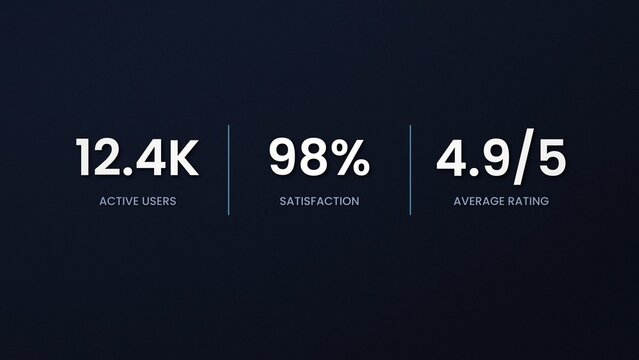
Statistics Trio Score Rating Numbers Infographic

Social Media Report Presentation Template Design

High End Classy Capital Investment Presentation Deck Template with Illustrations

Bento Box Dashboard UI Template, Modern Analytics Infographic Widgets, Admin Panel, App Dashboard Layouts

SaaS Titles | Modern and Dynamic Text Animations for Website Presentation and Mobile App Promo with Colorful Background | with Auto-Resize Box

Marketing Strategy Presentation Template
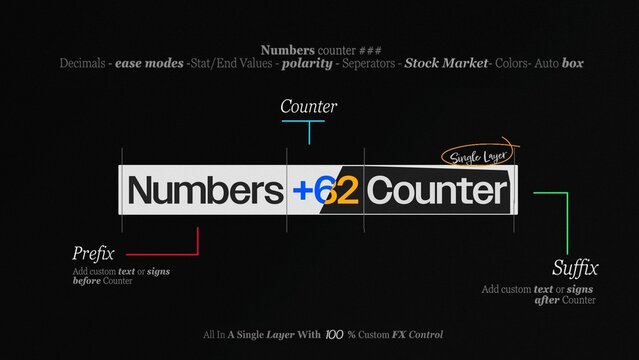
Number Counter Text Animation Maker | Universal Tool for count ups , countdowns , rolling percent stats and more

Mobile App Interface Display Mockup PSD

Colorful Infographic Template with Transparent Speech Bubbles and Business Icons
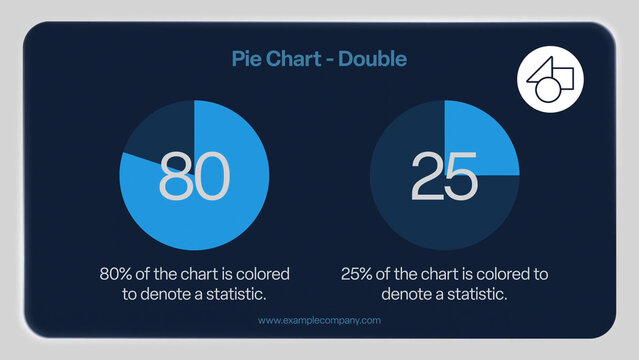
Elegant Double Pie Chart Infographic Slide

Business Growth Social Media Story Post Template Set Design

Business Analysis Presentation Template, Corporate Report Pitch Deck & Company Profile Analytics

Modern Annual Report Business Layout
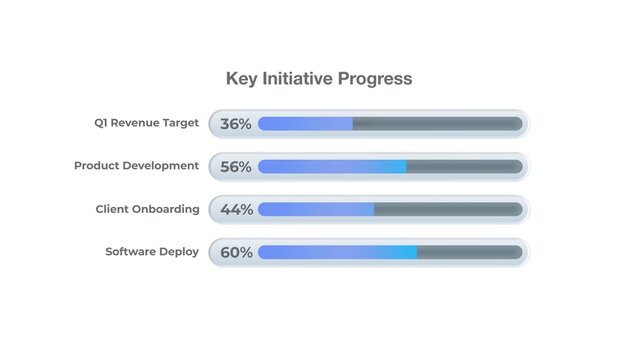
Modern Gradient Progress Bar Infographics

Business Social Media Carousel Template

HUD Neon Infographics Chart Bars x8 – Futuristic Sci Fi Data Interface, Glowing Digital Dashboard Elements, Cyberpunk Analytics Charts, Tech UI Visualization Pack

Minimalist Office Workspace Mockup Featuring Corporate SaaS Dashboard on Monitor
Clean And Modern Business Analytics Dashboard UI
Digital Marketing Proposal Layout Template
Data Analytics & Big Data Icon Set
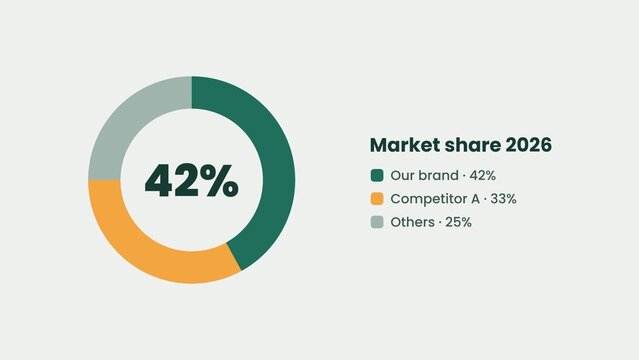
Donut Circle Split Pie Chart Market Share Infographic

Stat Infographic with Increase and Decrease
Waterfall Chart Infographic Template with Minimal Design
Minimal Corporate Growth Infographic Layouts with Steps and Business Success Illustrations

Corporate Presentation Animation Template
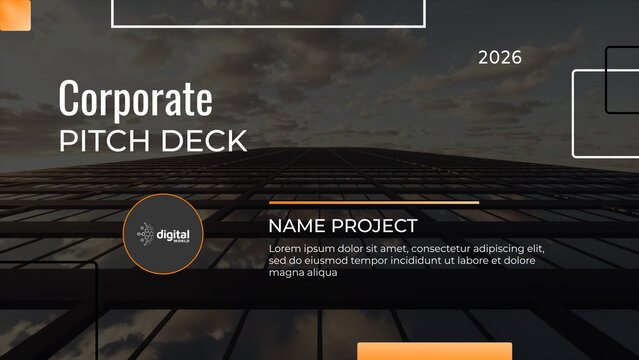
Information Pitch Deck Corporate Titles
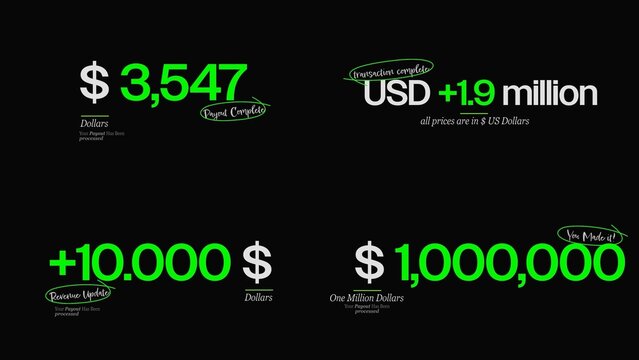
Currency Counters Text Animations | Animated money values, exchange rates & price displays for finance & banking.
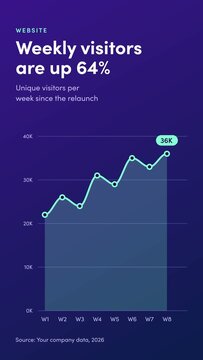
Infographic Vertical Weekly Visitors Area - Professional vertical 9:16 glass area chart infographic animation on indigo for weekly website visitors, traffic growth and analytics reports
Business Infographic Set
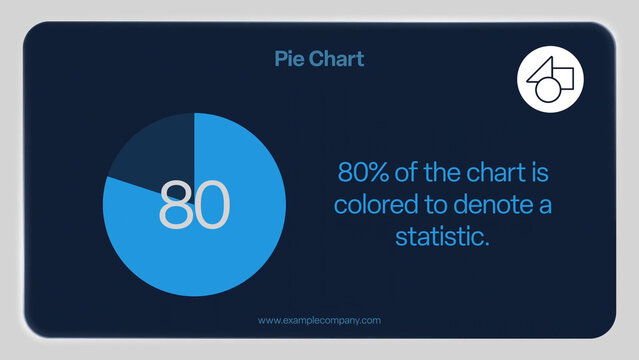
Elegant Pie Chart Infographic Slide
Business Growth Social Media Post Template Set Design
Modern Business Presentation Template For Minimalist Proposal Pitch Deck, Startup Sales Deck & Company Profile Presentation Layout
Digital Business Plan Presentation Template
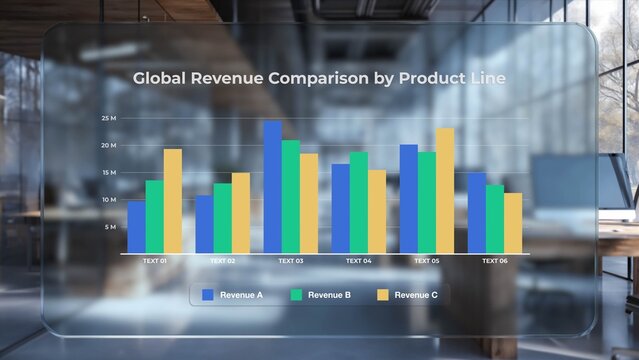
Modern Business Analytics Bar Graph Template
Modern Admin Dashboard UI Design Template
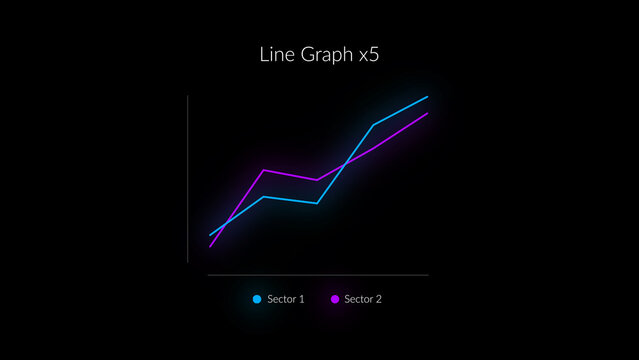
HUD Neon Infographics Line Graph x6
Cyber Security Dashboard
Modern Dark Analytics Dashboard UI
Vector illustration of analytics and research flat line design concept.
Finance & Banking Icon Set

Clean Professional Value Number Increase Kinetic Title
Orange And White Marketing Campaign Report
Letter Bussiness Proposal Marketing Layout
Marketing Strategy and Business Planning Icon Set

Corporate Presentation
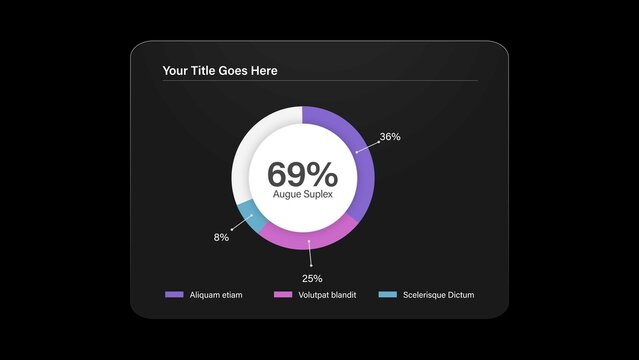
Infographic Pie Chart Animation Template
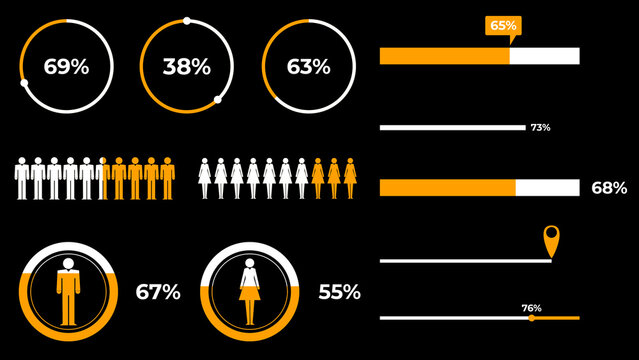
Infographics Elements.

Industry Growth Predictors | 5 Different Resolutions with Control Panels
Creative Flow Management Dashboard UI Template for Tracking
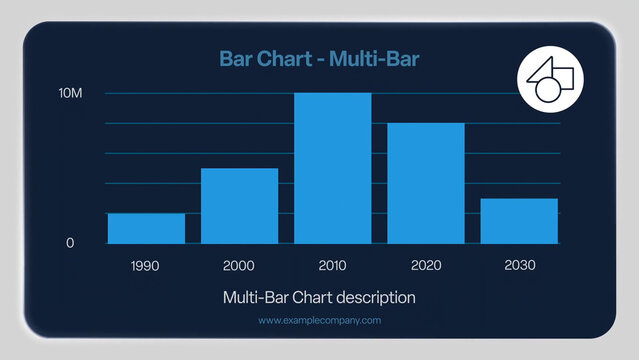
Elegant Multi-Bar Chart Infographic Slide
Corporate Annual Report Design Template
Business Presentation Template in Corporate Dark Black & Orange Theme For Company Profile Pitch Deck
Pitch Deck Presentation Template
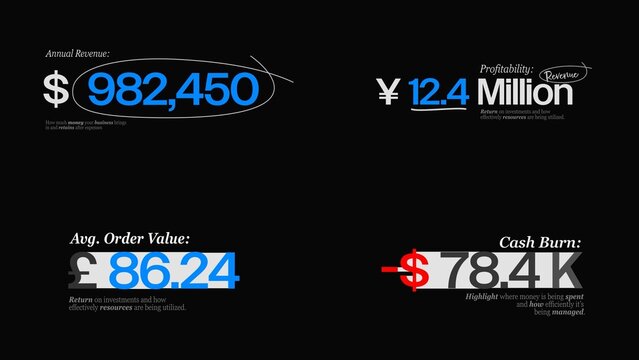
Finance Business Counters Text Animations | Animated KPI numbers for revenue, profit & corporate growth presentations.
Sustainable CSR Performance Dashboard Design
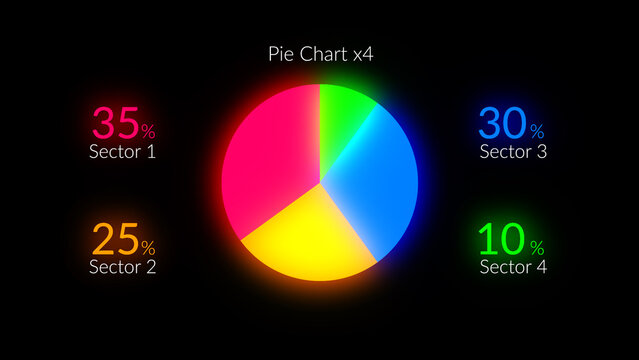
HUD Neon Infographics Pie Chart x4 – Futuristic Sci Fi Data Interface, Glowing Digital Dashboard Elements, Cyberpunk Analytics Charts, Tech UI Visualization Pack
Project Management Dashboard
Modern Admin Dashboard Template Layout
Infographic Layout Set with Blue and Green Elements
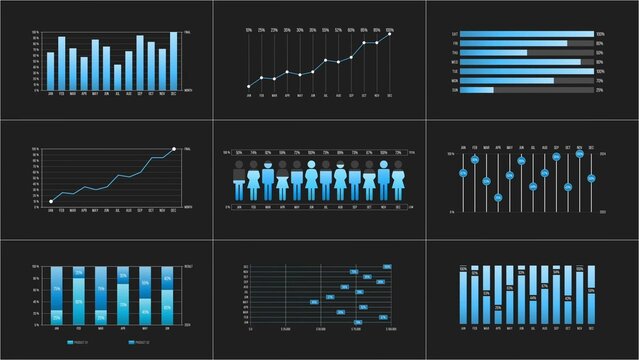
Elegant Infographic Charts

Rising Profit Line Graph Sales Growth Infographic
Data Analytics 30 Blue Dual Color Flat Icons Set
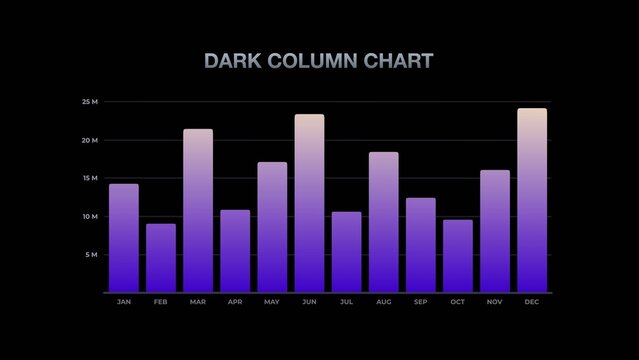
Modern Gradient Dark Column Chart
Saas Platform Stroke Icons

Clean Infographics Slide | Animated Data, Charts & Diagrams for Presentations
White And Purple SaaS Analytics Dashboard Overview UI Kit
Business Growth Infographic Set with Steps, Arrows and Success Concept
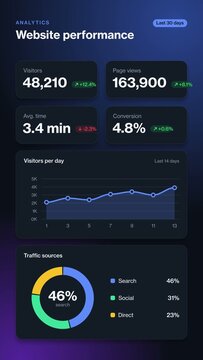
Infographic Vertical Website Analytics Dashboard - Professional vertical dark website analytics dashboard infographic animation with KPI cards, a line chart and donut for traffic reports and app demos
People Percentage Statistics Infographic
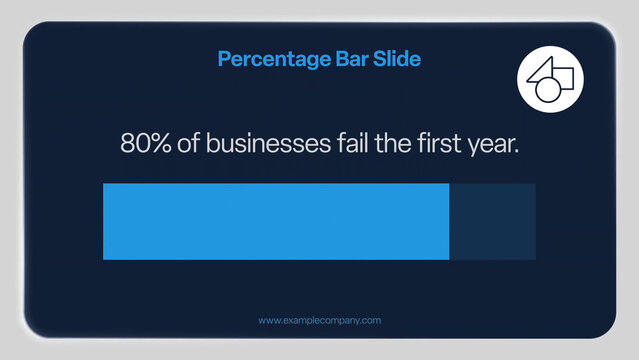
Elegant Percentage Bar Infographic Slide
Social Media Report Template for Marketing Analytics
Black Presentation Template in Minimal Dark Hues & Modern Minimalist Corporate Style
Social Strategy Presentation Template
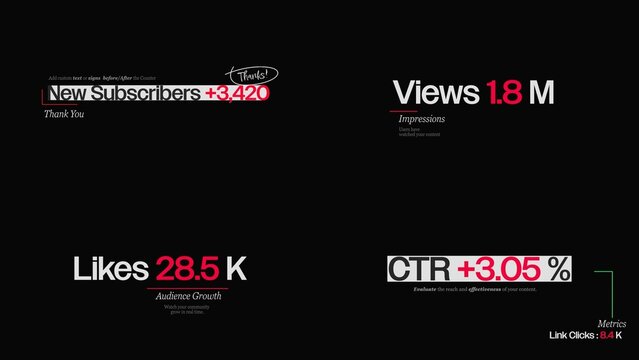
Social Engagement Counters Text Animations | Live count animations for likes, comments, shares & reaction totals.
Admin Dashboard Template Design For ECommerce Business

Hud Human
Desktop Monitor Mockup with Admin Dashboard UI Design
2026 Year End Business Review Presentation Template
Blue And Purple Performance Report
Geometric Element Eight Page Infographics Kit
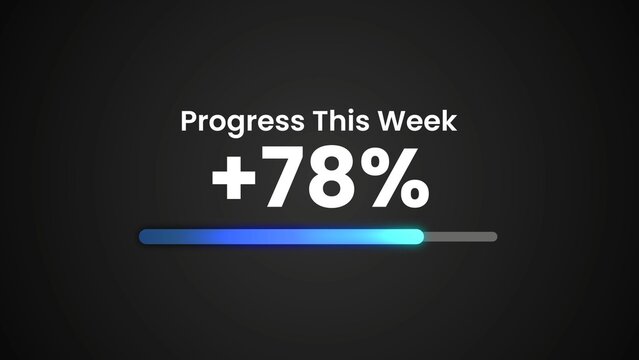
Clean Professional Value Number Increase Kinetic Title
Data Analytics Black and White Outline Style Icons Set
Editable Infographic Dashboard Layout with Dark Background
Retail Store and E-commerce Icon Set

Animated Business Infographics | Charts, Graphs and Reports
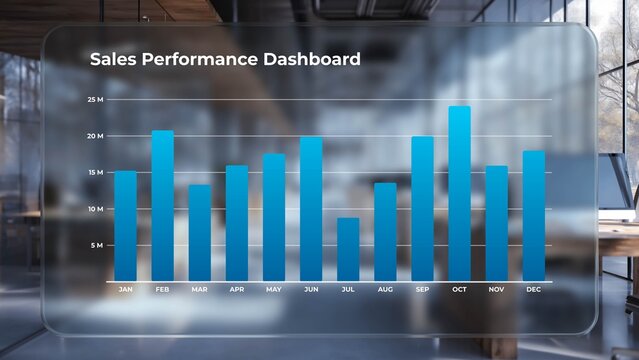
Corporate Glass Bar Chart
Business Analysis Report Cover Template
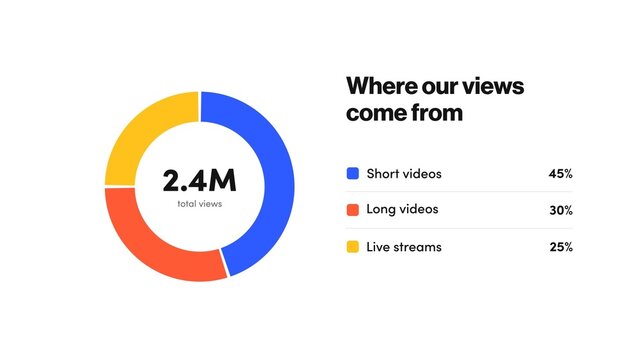
Infographic Donut Chart - Professional animated donut chart infographic with editable percentages and legend for reports, analytics presentations and social media stats
Infographic Brochure

Digital Data Glitch Intro Title