A link to set your password has been sent to: To access your purchases in the future you will need a password.
Get 10 Stock images with a free trial
New filters added
Sort by

53,369 results for scatter plot in all

4,387 results in video
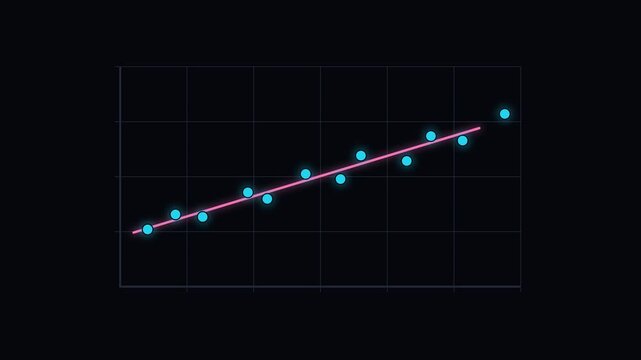
Scatter plot dots converging into trend line on black background
00:05
HD
ait Scatterplot Scatter Plot Chart Infographic for Business Presentation Layouts
scatter plot animated icon
00:06
HD
Data Analysis: Residual Scatter Plot for Model Evaluation
00:05
HD
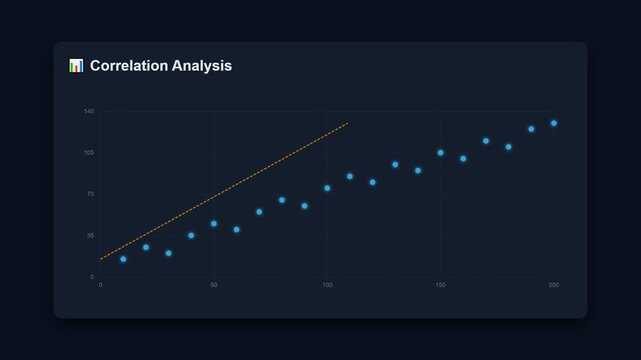
Correlation analysis scatter plot chart animation dark ui
00:10
HD
Data visualization scatter plot graph showing statistical analysis and research trends
00:10
HD
ait Scatterplot Infographic Vector – Data Visualization Chart, XY Scatter Graph Template for Analytics, Statistics, and Reports

Animated bar chart and scatter plot data visualization for business growth analysis and financial market trends animation 4k
00:10
HD
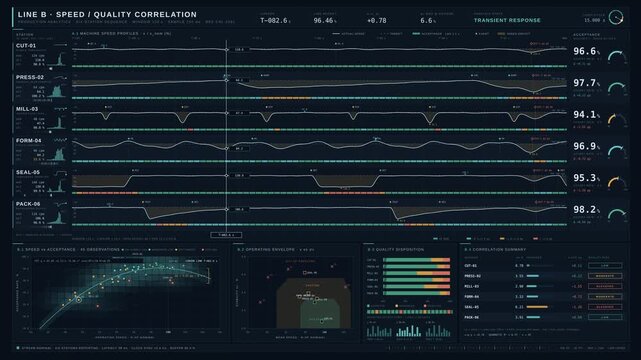
4K production line dashboard comparing machine speeds and quality acceptance rates with waveforms and scatter plots in dark blue interface for commercial creative technology and business use.
00:15
HD
Digital line graph tracks upward moving corporate revenue. Interactive line graph demonstrates successful financial forecasting. Economic growth concept with corporate line graph.
00:10
HD
Minimalist data visualization with animated trend lines and scatter plot points on grid animation 4k background
00:10
HD
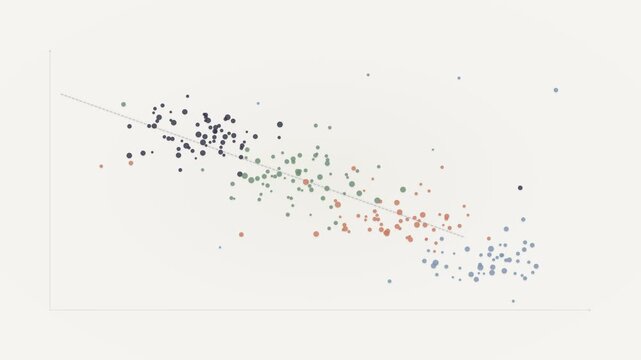
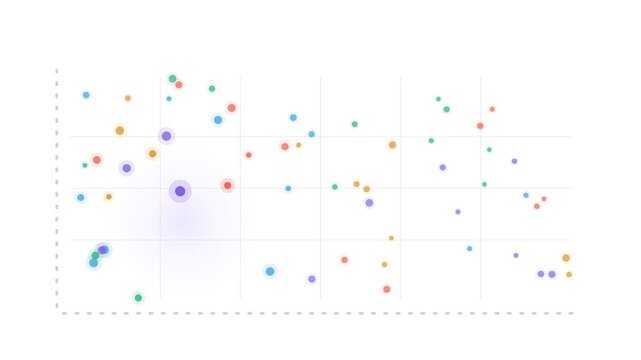
Animated Scatter Plot with Colorful Data Points
00:08
HD
Cyan scatter plot dots with rising trend line on dark background
00:08
HD
Glowing constellation scatter plot network animation seamless loop, glassmorphism data science and neural network background
00:15
HD
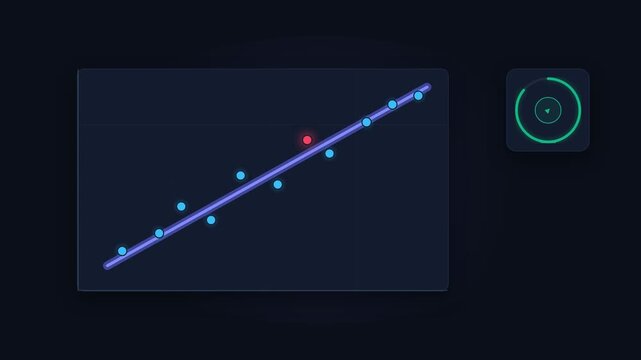
Animated scatter plot with regression line, data points tracking, and circular progress indicator, symbolizing analysis, growth, prediction, and digital insight
00:08
HD
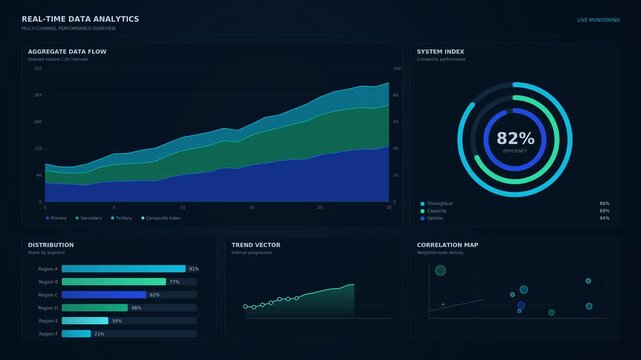
Data analytics dashboard animation, area chart, donut gauge, bar graph and scatter plot building up on dark blue UI screen
00:12
HD
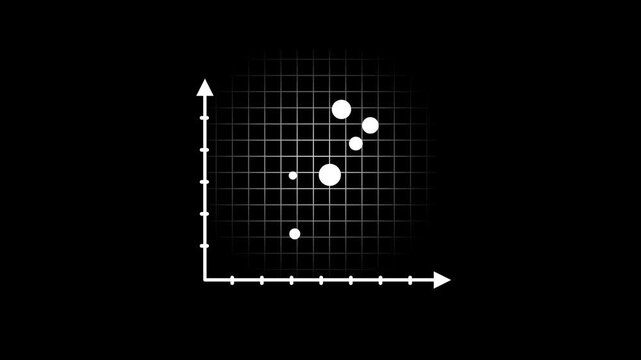
A scatter plot chart displays several white dots of varying size positioned along an axis grid representing simple data distribution analysis view
00:10
HD
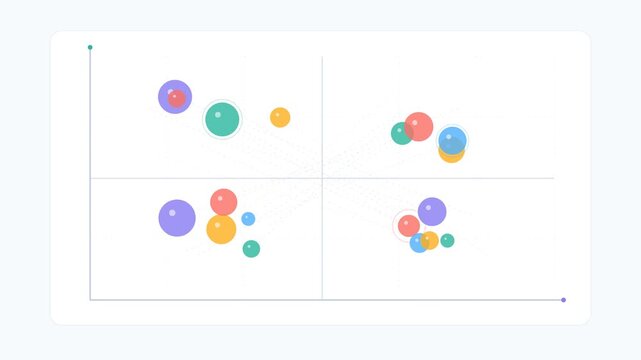
Bubble scatter plot migrating across business quadrants
00:10
HD
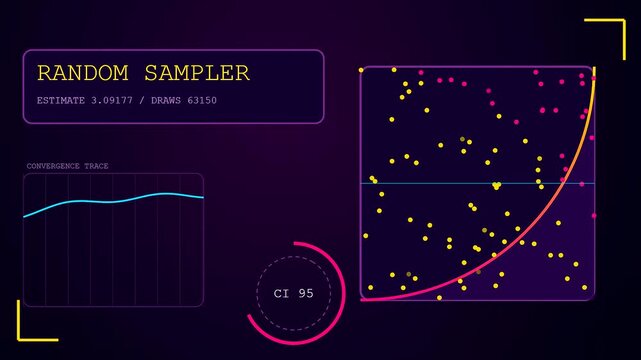
A digital probability modeling process shows growing scatter plot clusters and increasing point density across three distinct interface windows against a deep dark purple background
00:06
HD
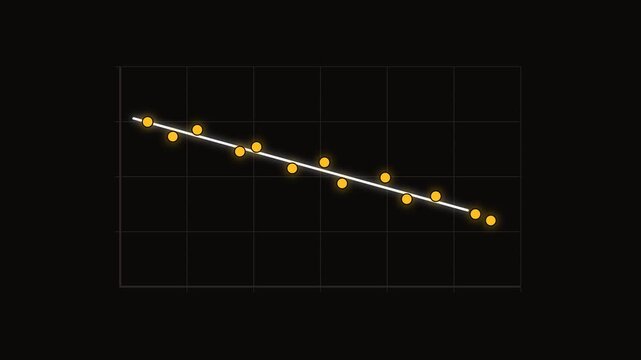
Amber scatter plot falling trend analysis animation dark
00:08
HD
scatter plot animated icon
00:06
HD