A link to set your password has been sent to: To access your purchases in the future you will need a password.
Get 10 Stock images with a free trial
New filters added
Sort by

8,694 results for quant in all

1,917 results in video
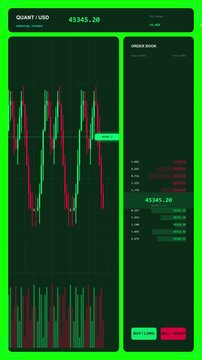
Cryptocurrency Perpetual Futures Trading Dashboard Interface
00:05
HD
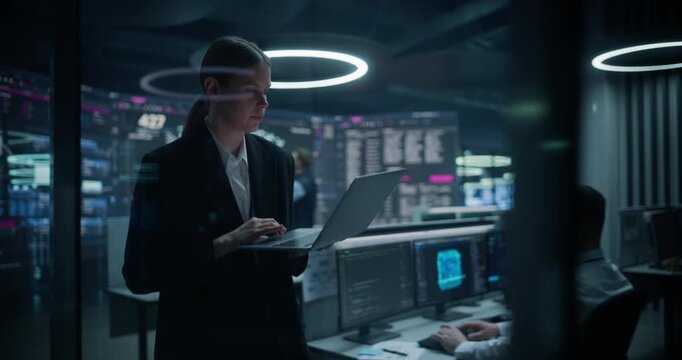
Quantitative Analyst Working on a Laptop to Boost Ecommerce Conversion and Payment Flows While Male Specialists Track Neural Network, Freight and Threat Defence Walls in a Big Data Command Centre.
00:10
HD
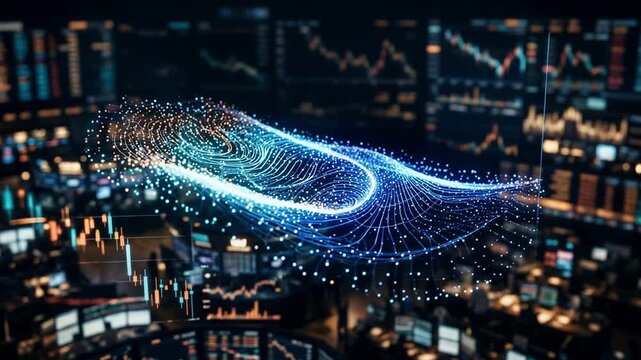
Focused display of a sophisticated multiasset riskreturn frontier generated by quantum algorithms with blurred financial dashboards creating depth.
00:05
HD
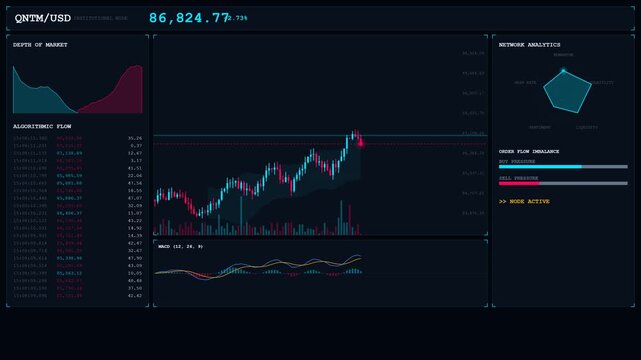
An ultra-complex 4K institutional quant trading terminal. Features algorithmic order flow, Depth of Market (DOM) mountain charts, MACD oscillators, Bollinger Bands, and a procedural polygon radar scan
00:10
HD
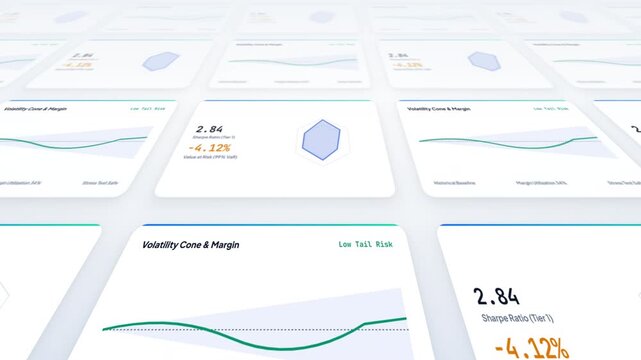
Quant Hedge Fund Risk Analysis Sharpe Ratio Radar 3D Isometric Dashboard 4K Loop on Clean Background
00:10
HD
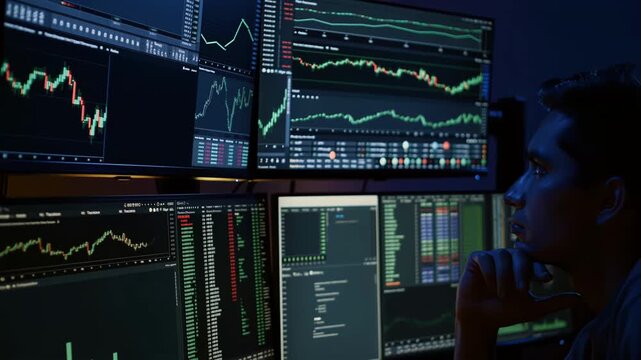
night trading desk monitors display charts. focused male trader reviews candlestick patterns, live tickers, portfolio analytics and code terminals on multi screen setup in dimly lit room, blue glow
00:05
HD
Cyber Sci-Fi HUD Financial Algorithmic Trading Screen Display
00:10
HD
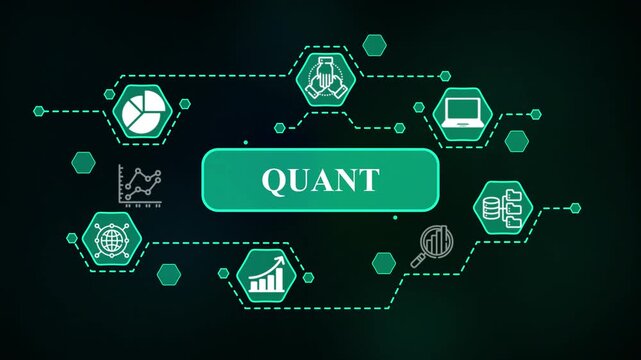
Quant technology concept with connected icons and text| Advanced 4K Business Visualization
00:10
HD
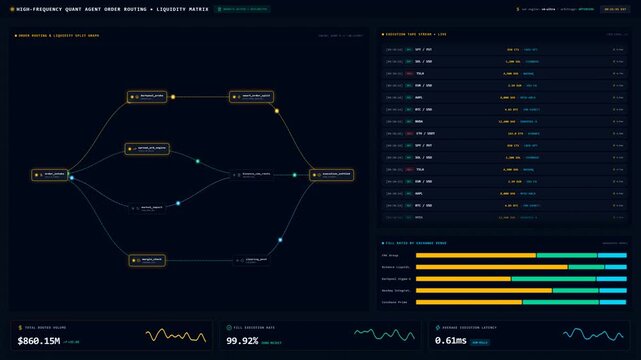
Quant Trading Order Routing and Liquidity Matrix Dashboard
00:12
HD
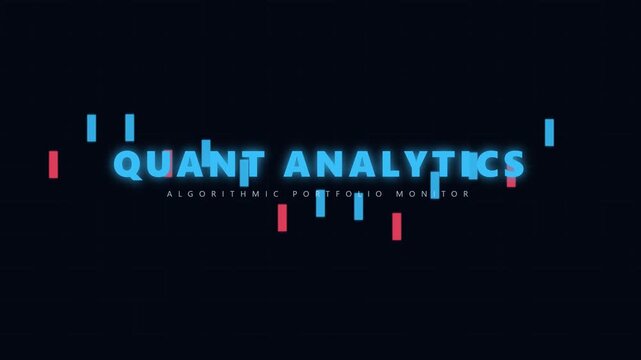
Quant analytics text animation with financial candle chart bars
00:08
HD
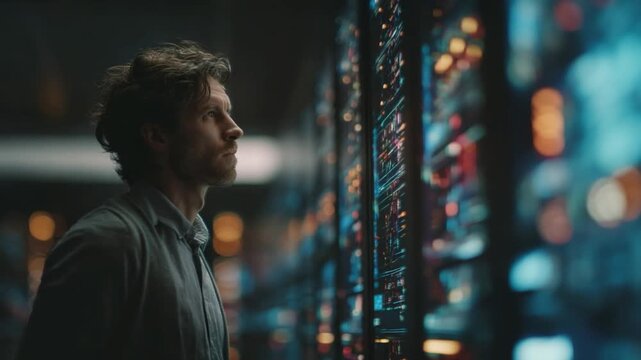
A Male Quant Engineer Analyzing Machine-Learning Trading Patterns
00:10
HD
A vibrant and intricate mountain range, created using computer graphics. Macro shot of dynamic convexity + skew factor graphs driven by AI, cinematic future quant finance, ai driven investment fund
00:05
HD
Colorful data stream illuminates the digital landscape, showcasing vibrant numbers and intricate patterns in a futuristic world. Generative AI
00:21
HD
Bright Screens Illuminate Focused Market Activities Late At Night
00:10
HD
A graph with blue and red lines. The blue lines are the highest points. Macro shot of dynamic convexity + skew factor graphs driven by AI, cinematic future quant finance, ai driven investment fund
00:05
HD
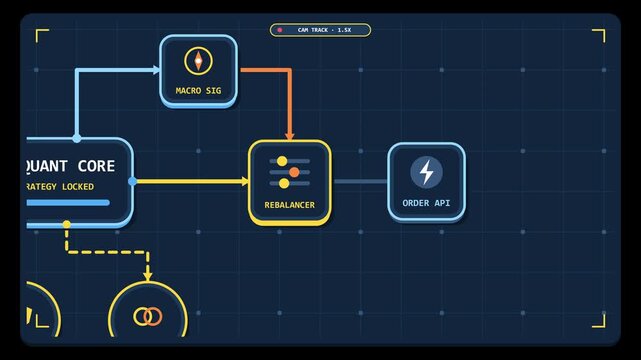
AI FinOps and Quant Trading Workflow Animation with Market Analysis, Risk Management and Smart Order Execution
00:10
HD
A digital display of stock market data with vibrant colors and reflections.
00:10
HD
Evaluating corporate numerical statistics through quantitative analytics models
00:18
HD
Journey through an electrifying digital landscape filled with vivid color contrasts as market trends pulse, revealing data insights and analytics that shape decisions in real time.
00:10
HD