


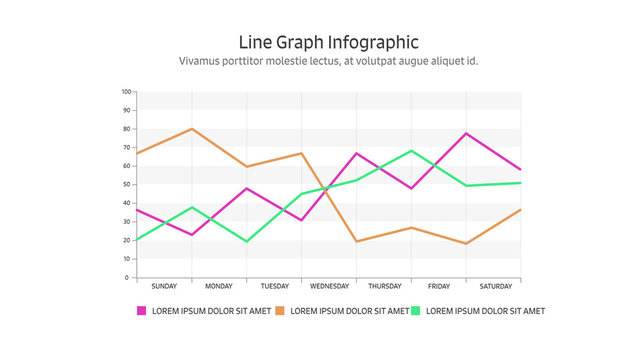
Line Graph Infographic


Line Graph Infographic


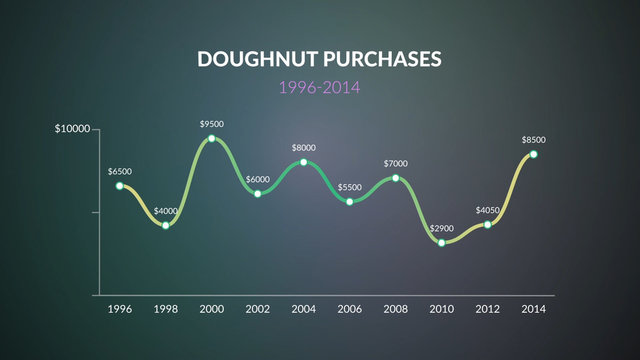
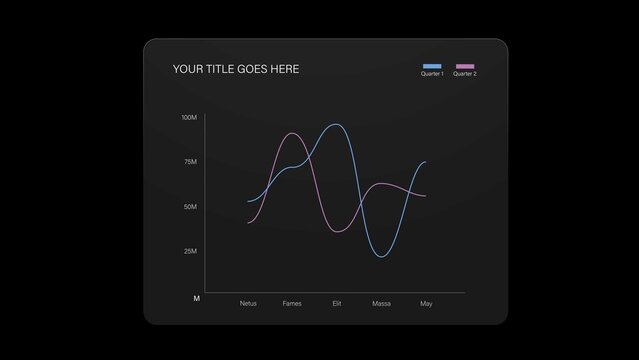
Data-Driven Wavy Line Graph Infographic
FREE


Line Chart Infographic Video Template


Editable Graph Elements for Data Visualization Layouts
Line Chart Infographic Video Template
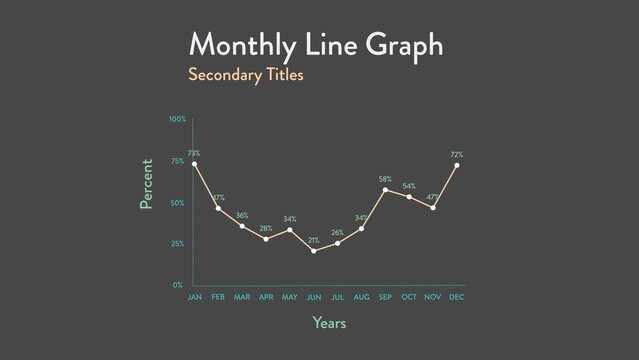
Monthly Line Graph Infographic

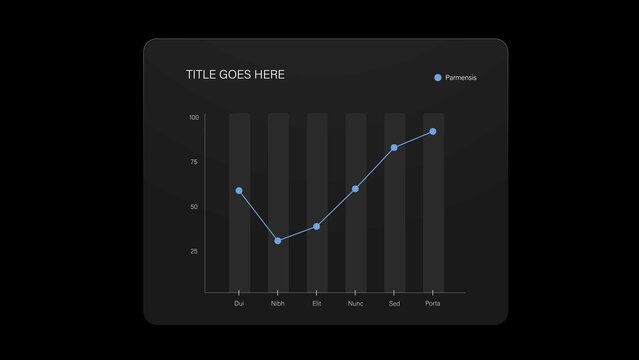
Simple Line Graph
Line Chart Infographic Video Template
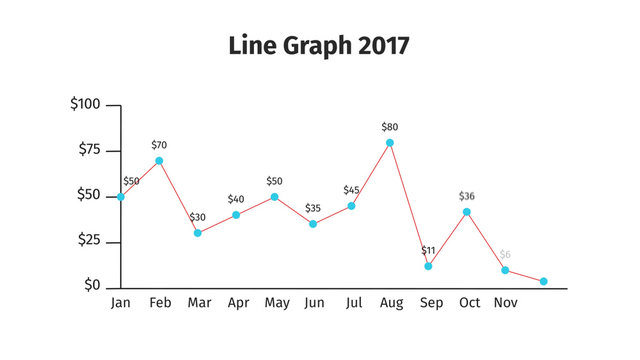
Bright Line Graph
FREE
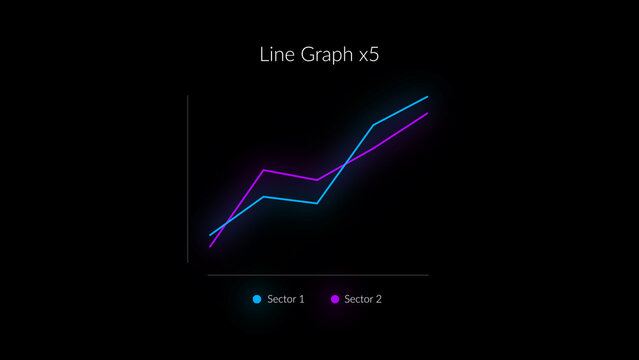
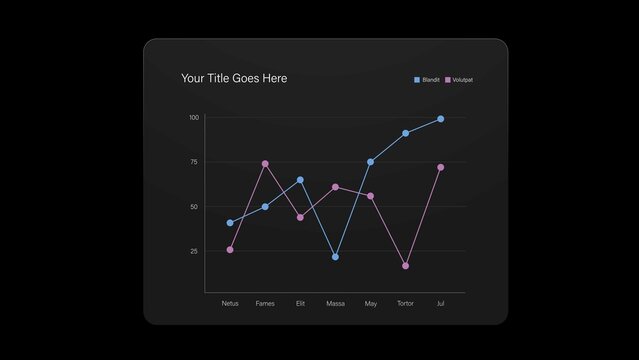
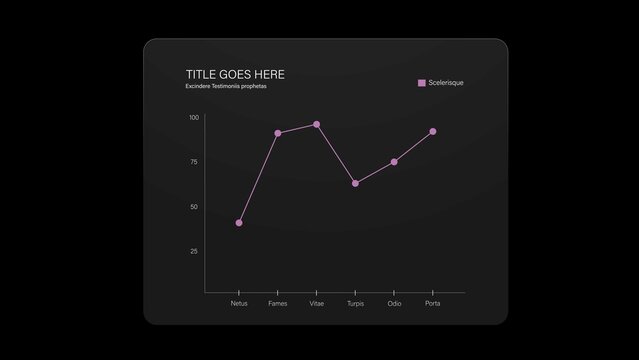
HUD Neon Infographics Line Graph x6
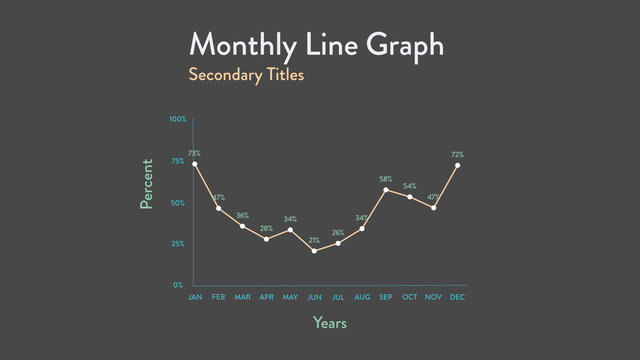
Monthly Line Graph Infographic
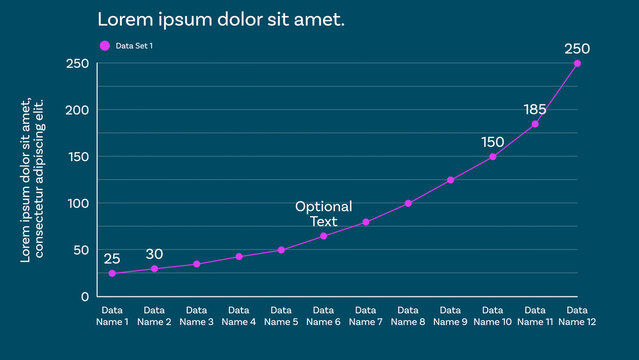
Responsive Line Graph for Clean and Modern Data Visualizations Design and Slide Presentations with up to 12 Animated Data Points and Optional Labels to show Percentages, Whole Values, and Custom Texts
Line Chart Infographic Video Template
Line Graph Chart Infographic for Time Series in Business Presentation Layouts