A link to set your password has been sent to: To access your purchases in the future you will need a password.
Get 10 Stock images with a free trial
New filters added
Sort by

21,614 results for grid system tracking in all

8,547 results in video
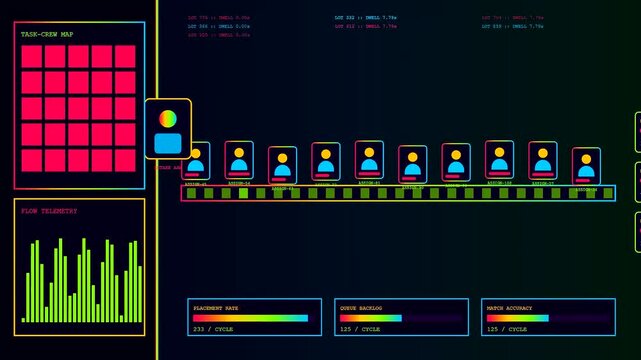
Digital displays showing staffing allocation metrics with grid patterns and personnel icons in a complex interface for monitoring human labor capacity and dynamic workflow performance tracking
00:06
HD
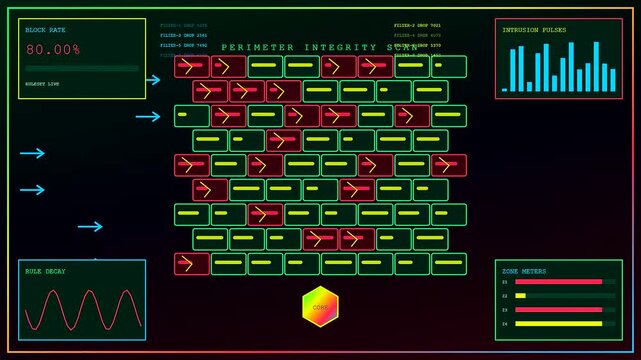
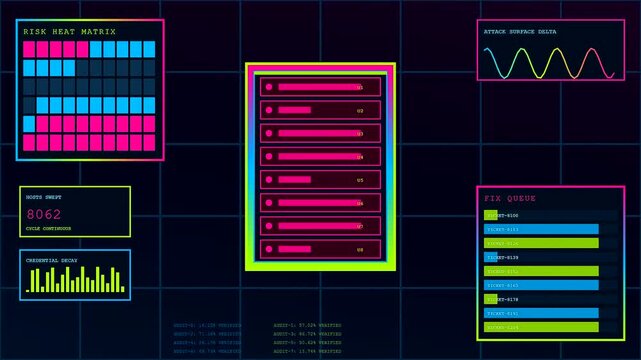
A vulnerability scanning interface showing digital block grids with moving arrow symbols and data charts in a dark software monitoring environment for complex system audit performance
00:06
HD
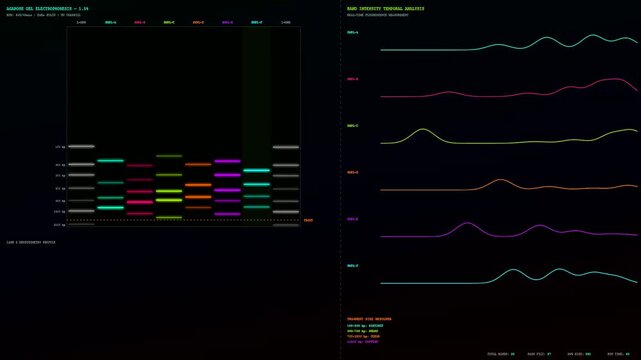
A digital bioinformatics interface shows rhythmic glowing data lines and colorful bar charts fluctuating on a dark screen during a complex genomic laboratory research session
00:06
HD
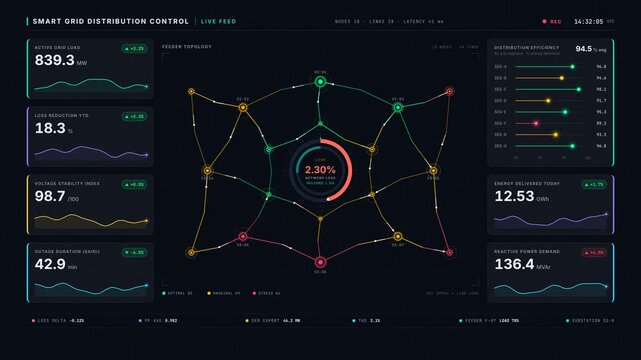
4K smart grid dashboard with animated network topology map, real-time loss reduction gauges, and glowing data metrics on dark slate background for energy control.
00:15
HD
glowing magenta circular radar display with polar grid coordinates and tracking points, radar interface graphics, surveillance technology visuals, navigation displays, tracking system concepts,
00:09
HD
A digital staffing allocation system displays various user avatars and shift trends on a dark monitor screen featuring bright neon graphs for personnel tracking
00:06
HD
Digital servers telemetry monitoring displays featuring glowing nodes and moving network traffic lines shown within a dark futuristic interface animation for global data management system analysis
00:06
HD
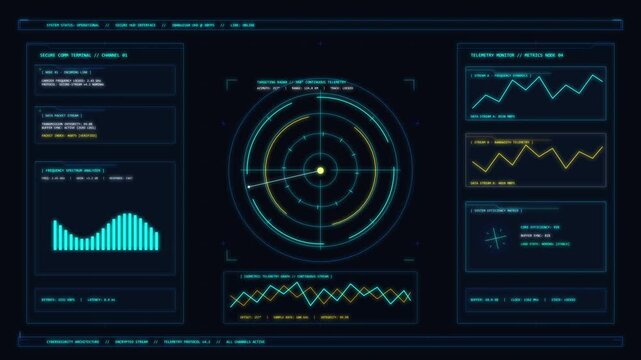
Futuristic cyan holographic HUD interface with a glowing circular radar, central targeting crosshair, system status panels, and dark digital grid background. Abstract high-tech
00:10
HD
Blue radar sonar interface scanning with rotating sweep line over dotted world map background
00:10
HD
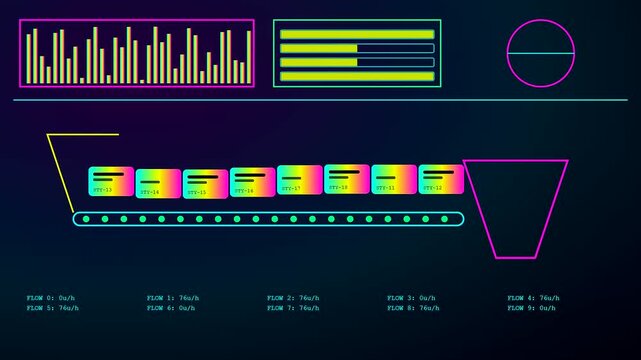
Monitoring an agile backlog through a digital tracking interface showing colorful task cards moving along a conveyor belt in a simulated automated factory production flow system
00:06
HD
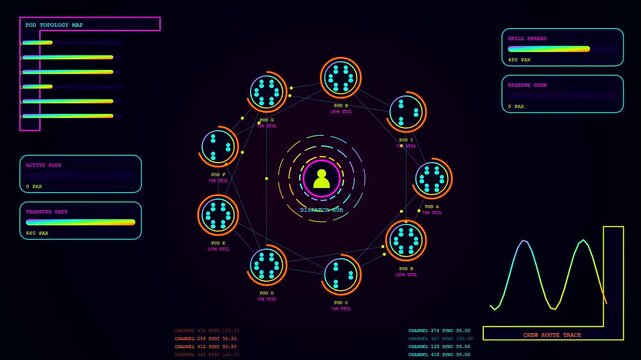
Complex staffing allocation dashboard visualizes network nodes with moving wave charts and circular interface elements displaying team logistics status across three distinct digital monitor panels
00:06
HD
Vulnerability scanning charts and glowing system metrics appear on a dark interface representing complex digital monitoring tools used in modern data security analytics and network traffic tracking
00:06
HD
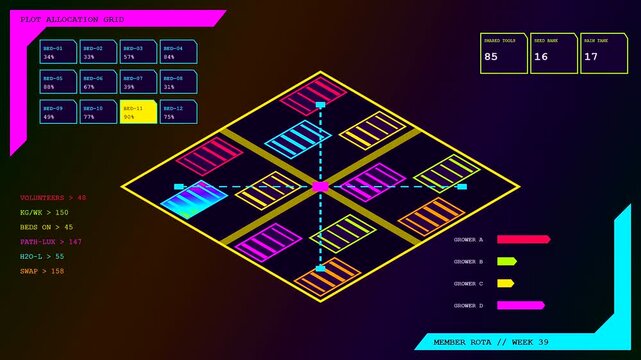
A digital community garden harvest display features animated isometric plots with glowing neon metrics across three sequential screens showing agricultural data updates in a dark environment
00:06
HD
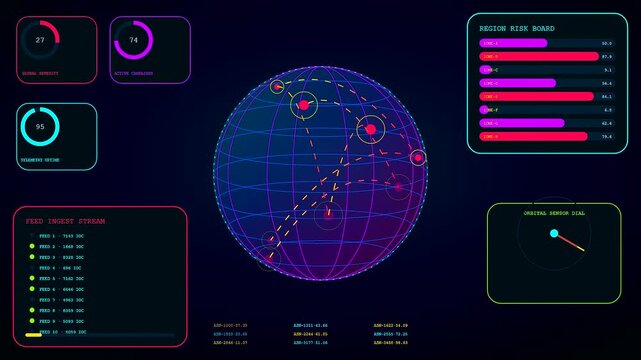
Threat intelligence interface displaying rotating global spheres with glowing data nodes and tracking lines across a dark digital panel showing various statistical charts and metrics
00:06
HD
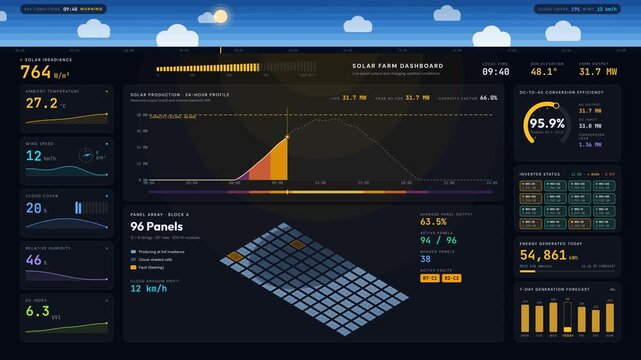
4K Solar farm dashboard visualization tracking panel output, weather conditions, and energy production data with dynamic charts and isometric view. for commercial creative technology and business use.
00:15
HD
Digital satellite monitoring system tracking global data on grid map
00:15
HD
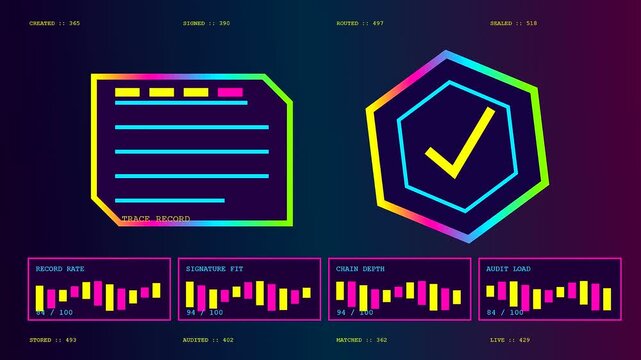
A digital blockchain tracking display shows neon glowing document icons with data bars and status markers in a dark purple interface for information monitoring software
00:06
HD
Rectangle radar sweeping and detecting interface animation. Futuristic digital radar interface data detection technology.
00:14
HD
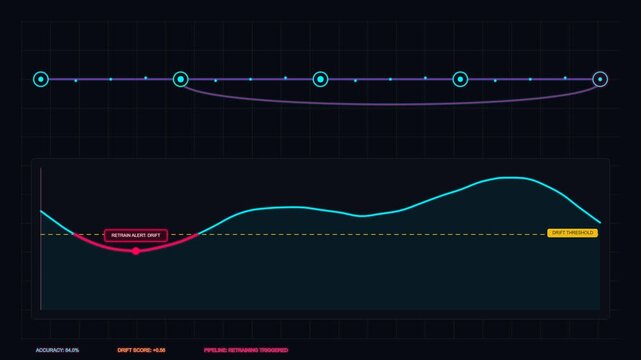
Data science analytical line chart with drift detection threshold for monitoring system performance a digital analytics interface displays a visualizing and metrics for software tracking
00:10
HD
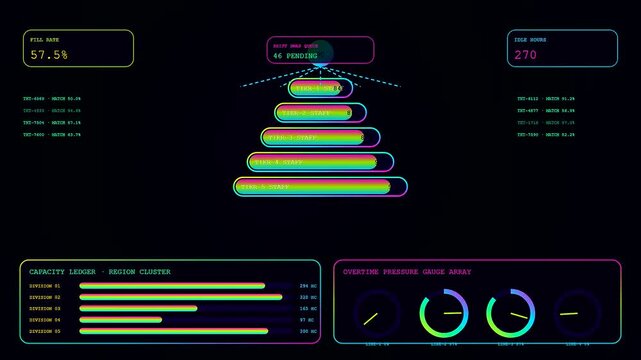
Data dashboard showing staffing allocation metrics with glowing neon tiers and interface indicators displayed on a dark virtual monitor screen during a complex system operation
00:06
HD
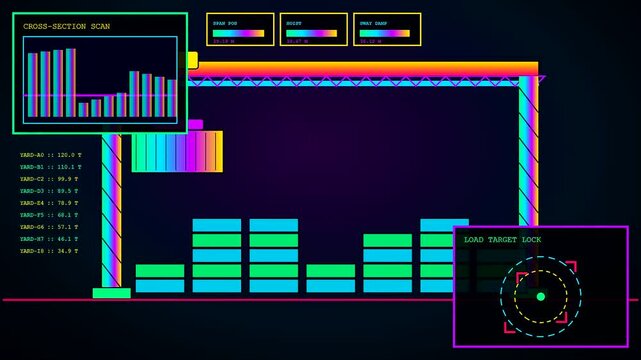
Automated warehouse optimization tracking system displays a digital crane moving colorful cargo blocks across stacked containers in a dark interface with vibrant neon graphical charts
00:06
HD
Abstract radar screen digital interface. Blue scanning beam over grid display represents cybersecurity, surveillance systems, advanced digital tracking concepts. Radar screen showing scan results. 4k
00:10
HD
Ev navigation interface scanning and tracking data on dark grid
00:10
HD
Dark warehouse robotics interface displaying automated storage unit metrics and dynamic shelf grid maps showing real time logistical system tracking data for industrial inventory management processes
00:06
HD
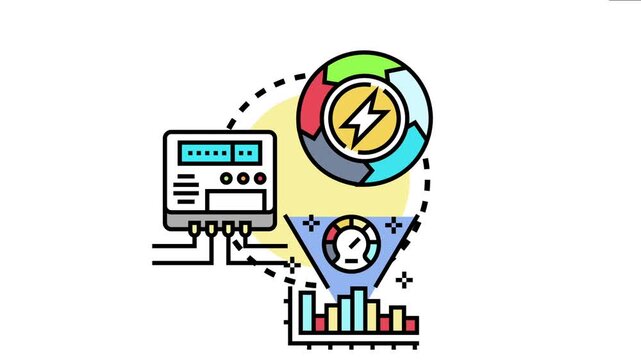
Real time energy performance tracking technology visualizes power consumption data from a meter, utilizing a cyclical process and analytical charts for efficient management and optimization
00:17
HD
Futuristic digital dashboard interface with radar scan, data metrics, stock charts, technology analysis, and system monitoring
00:07
HD
Digital HUD interface animation tracking blue line on grid background
00:10
HD
Digital carbon capture tracking interfaces display complex environmental metrics via glowing geometric charts and neon tiered graphs presented on a dark screen in this animation
00:06
HD
A digital stream commerce interface displays glowing isometric box models with floating numerical data points and colorful graphical bar charts for advanced logistical tracking system monitoring
00:06
HD
Digital displays showing warehouse optimization metrics with glowing wave charts and inventory tracking grids within a modular monitoring interface for real time logistics control and analytics
00:06
HD
Green futuristic tactical radar interface displaying aircraft targets a digital screen rendered in showing aerial and tracking data within a grid system hud monitor aviation flight
00:10
HD
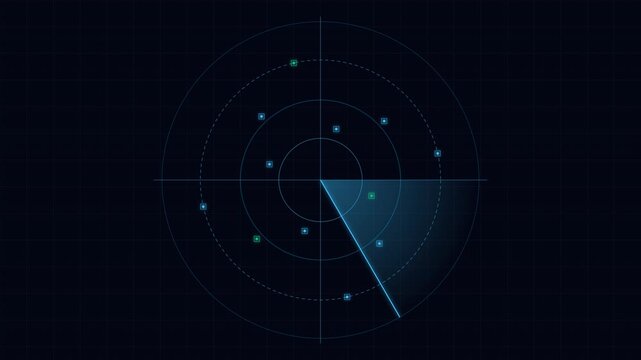
Digital grid radar scan displaying glowing blue radar lines against a dark background, featuring modern futuristic tech interface elements
00:10
HD
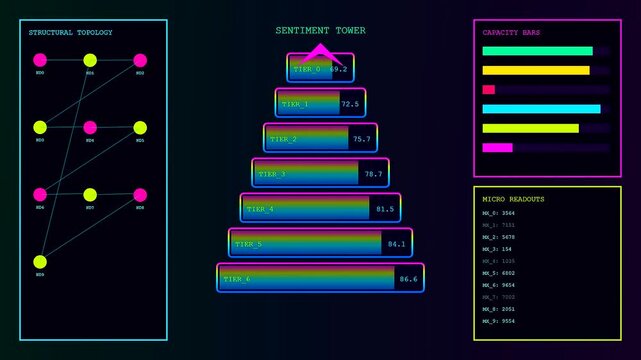
Sentiment analytics visual data dashboard displays glowing pyramid bar charts and interconnected node maps across three frames of fluctuating digital metrics in a dark computing interface
00:06
HD
Technology, radar systems, surveillance concepts. Digital display with glowing blips, circular grid system interface for various design projects.
00:10
HD
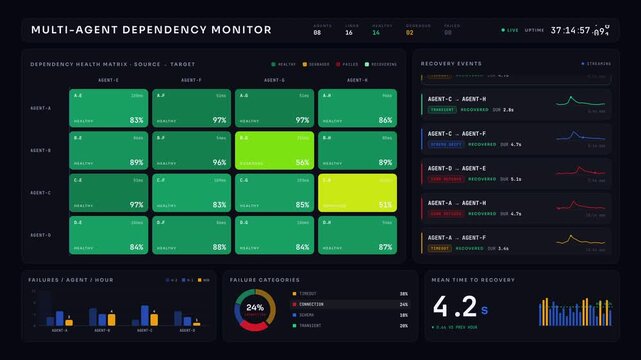
Cinematic 4K multi-agent dependency monitoring dashboard featuring real-time failure tracking, recovery timeline, and analytics charts with electric blue and crimson accents on a dark background.
00:15
HD