A link to set your password has been sent to: To access your purchases in the future you will need a password.
Get 10 free Adobe Stock images.
Get 10 free images
Unlock 200M+ assets in our full collection
Get 3 free 4K videos
New filters added
Sort by

11,624 results for corbis image in all

View corbis image in videos (1169)
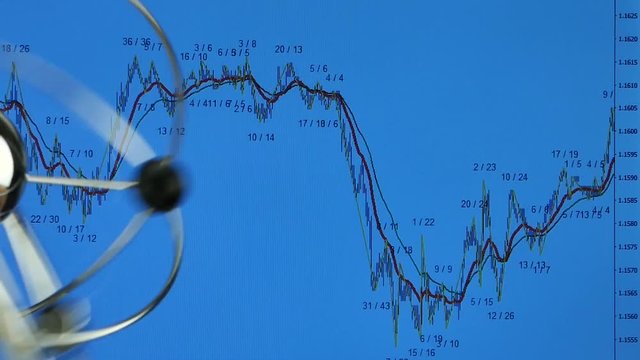
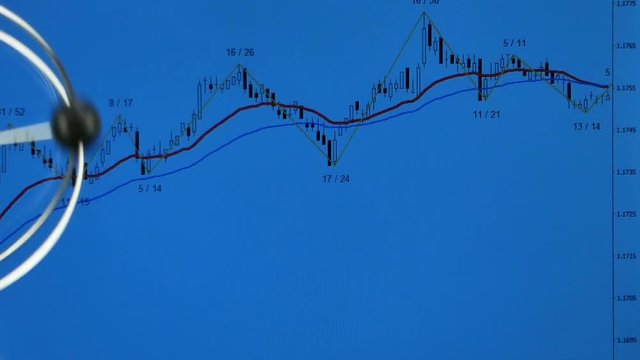
moving pendulum on a background the stock market chart. the concept of balance of price and time
00:13
Web of business activity.Symbols of bitcoin and dollar are associated with the symbols of the stock market.Beautiful 3d animation of the Global Digital Network Growing with Numbers Flying. Business
00:20
The collapse of the stock market.Beautiful 3d animation of the Global Digital Network Growing with Numbers Flying. Business Concept. Looped. 4k
00:20
A maze of interconnected lines and nodes represents the complex network of financial institutions traders and investors involved in the stock market. Some lines are solid
00:05
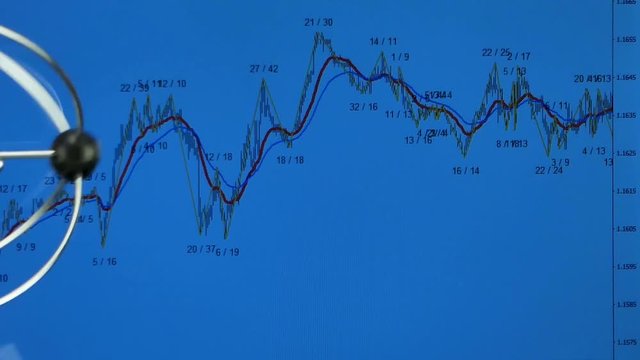
moving pendulum on a background the stock market chart. the concept of balance of price and time
00:19
moving pendulum on a background the stock market chart. the concept of balance of price and time
00:24
moving pendulum on a background the stock market chart. the concept of balance of price and time
00:20
A strand of DNA with intricate patterns of bull and bear symbols, reflecting the volatile nature of the stock market. .
00:06
moving pendulum on a background the stock market chart. the concept of balance of price and time
00:20
Bitcoin trading with price evolution. Timelapse chart of the price of USD and BTC in the stock market. Cryptocurrency exchange chart online on a laptop screen. Digital graph data of crypto currency.
00:13
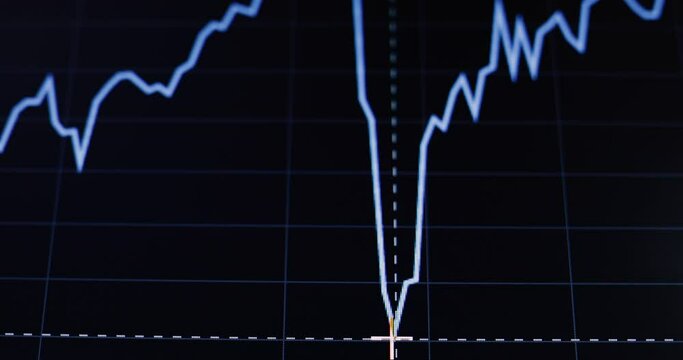
Shallow depth of field (selective focus) with details of a chart showing the stock market crash from March 2020 due to the Covid-19 pandemic on a computer screen.
00:09
The red bar chart and arrow lines point down to the lowest selling point.  concept of losses in the stock market due to crises, panics, wars, or epidemics. Selling to cut losses. 3d rendering
00:10
Shallow depth of field (selective focus) with details of a chart showing the stock market crash from March 2020 due to the Covid-19 pandemic on a computer screen.
00:16
On the stock market, the share price falls. Falling prices of securities. Loss of assets in equities stock. Decreasing trend showing unsuccessful performance and losses failure due to economic crisis
00:16
Shallow depth of field (selective focus) with details of a chart showing the stock market crash from March 2020 due to the Covid-19 pandemic on a computer screen.
00:11