


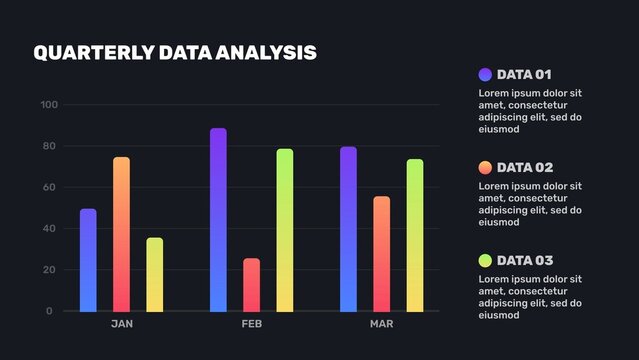
3 Bar Gradient Graph Data Analysis Infographic


Hexagonal Splice Infographic


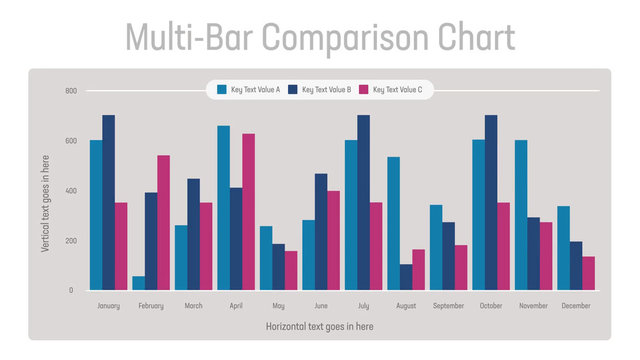
Multi-Bar Comparison Chart
Comparison Bar Graph with 2 Colors Infographic
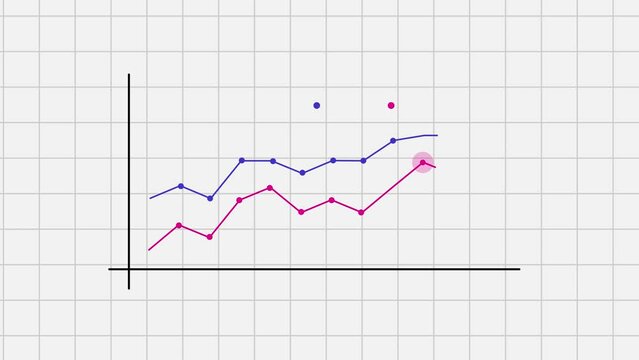
Year Over Year Infographics Line Chart Template
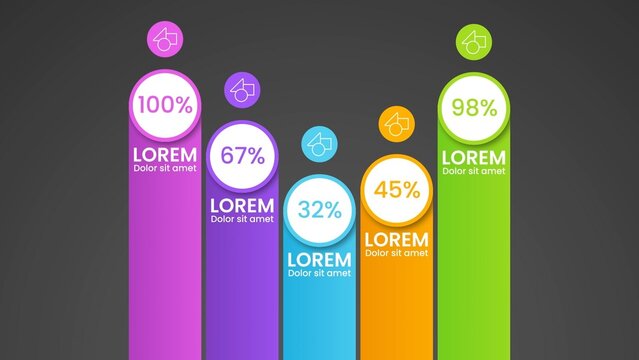
Gradient Graphic Bar Value Comparison Infographic
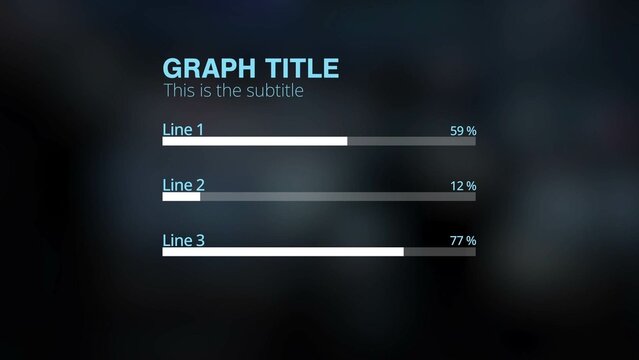
Horizontal Bar Graph with Percentages
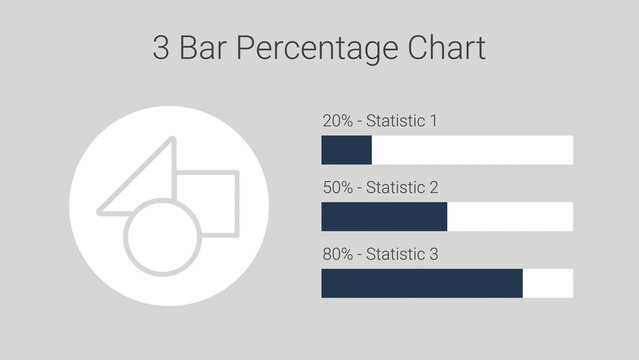
Clean 3 Bar Percentage Chart
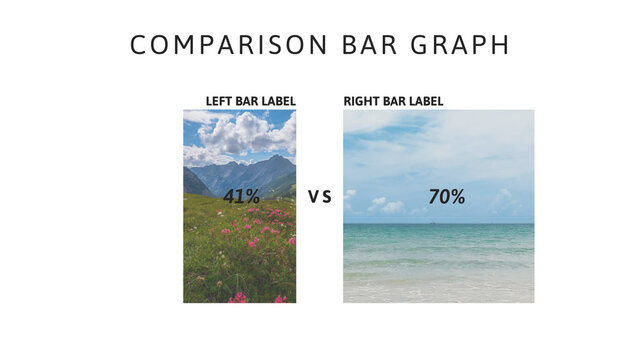
Comparison Bar Graph Infographics
Easy To Edit Bar Chart Infographic Template
Bar Chart Graph Infographic Template for Data Graphs in Business Presentation Layouts

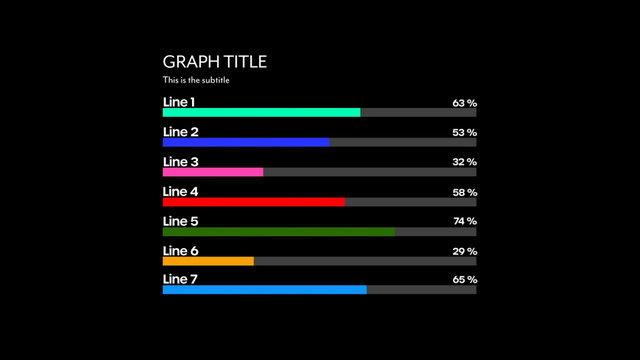
Horizontal Bar Graph with Percentages
Survey Infographics Template

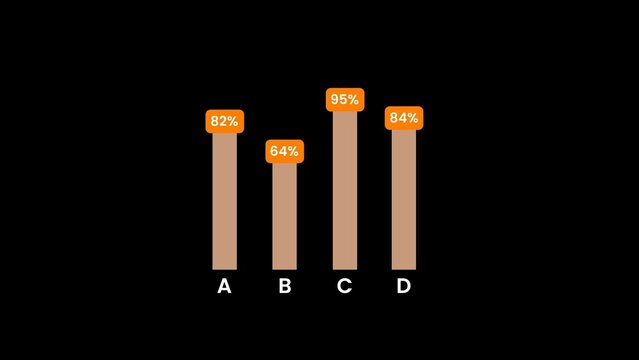
Bar Graph Vertical Chart with Percentage Infographic | With Full Controls
Data Compare Infographic Template
Bar Chart Graph Infographic Template in Modern Corporate Style for Business Presentations
Multiple Bar Chart Infographic Layout