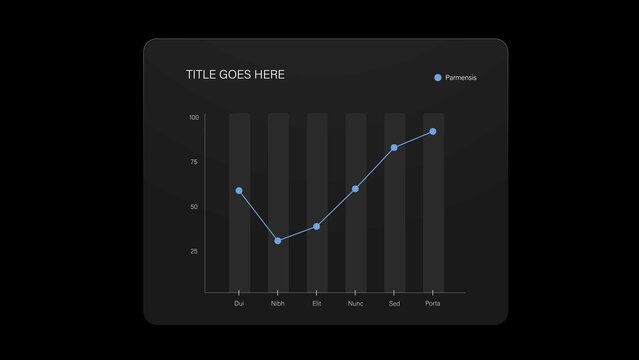
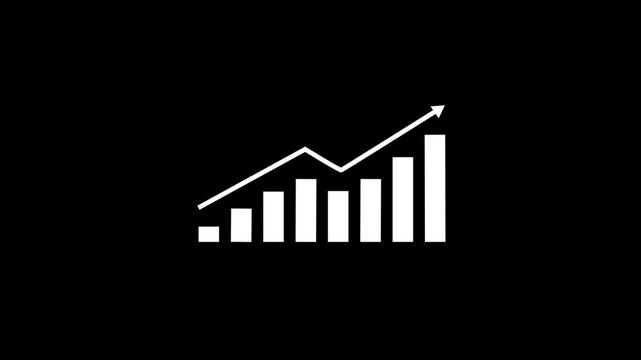
Line Chart Infographic Video Template
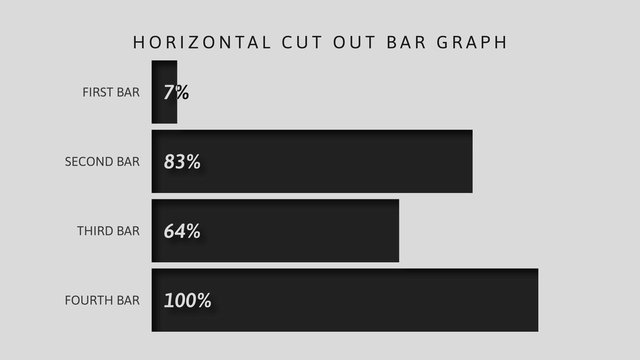
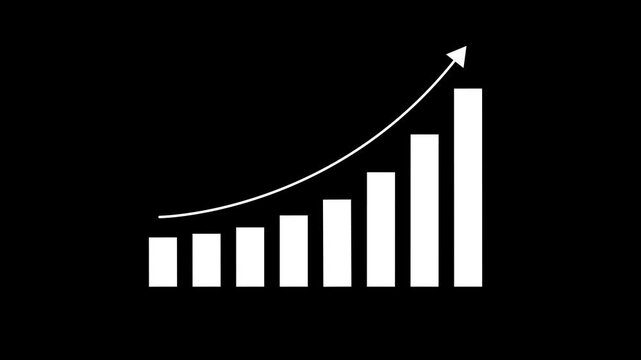
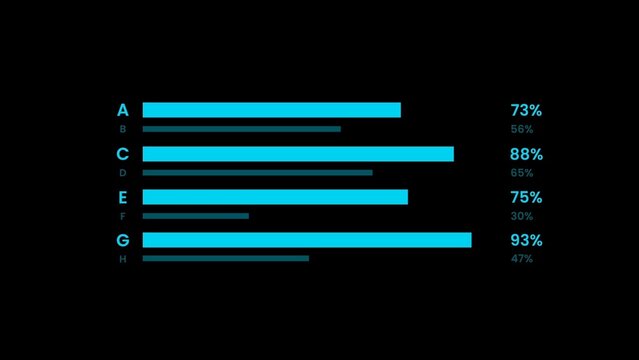
Horizontal Cut Out Bar Graph
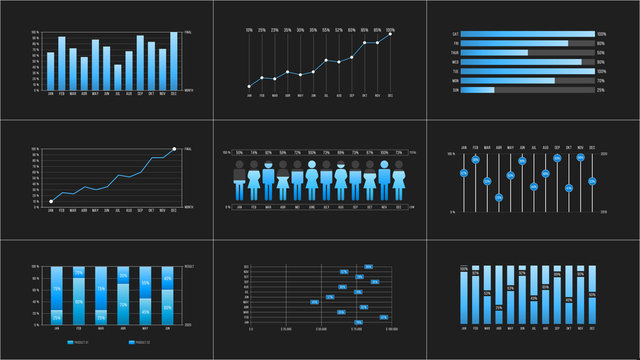
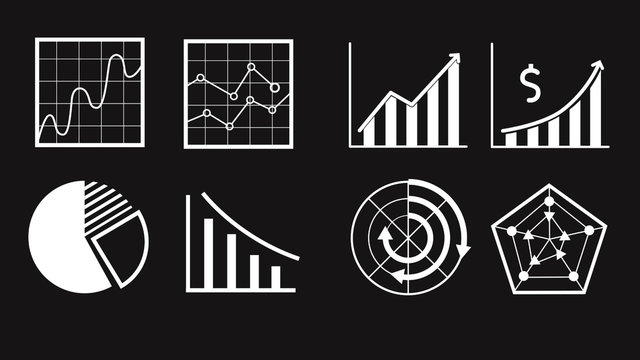
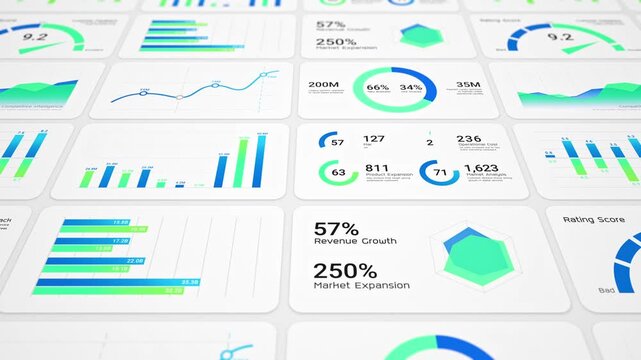
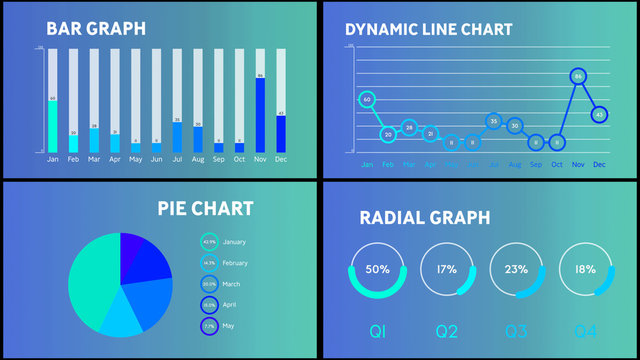
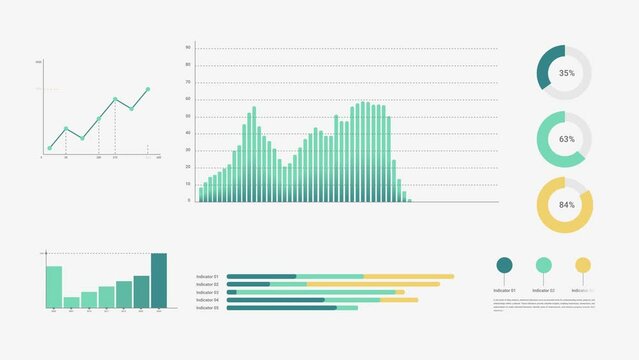
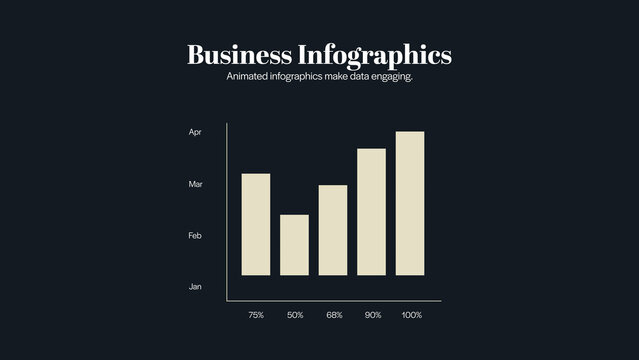
Infographic Charts

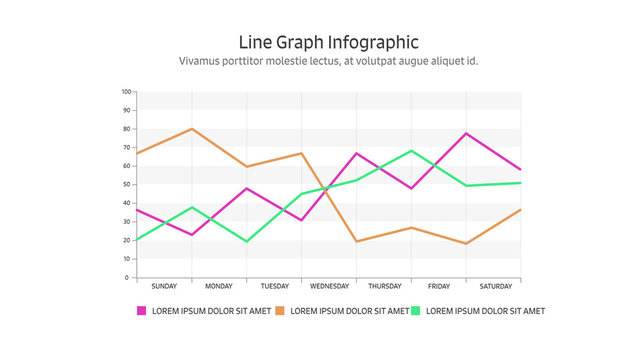
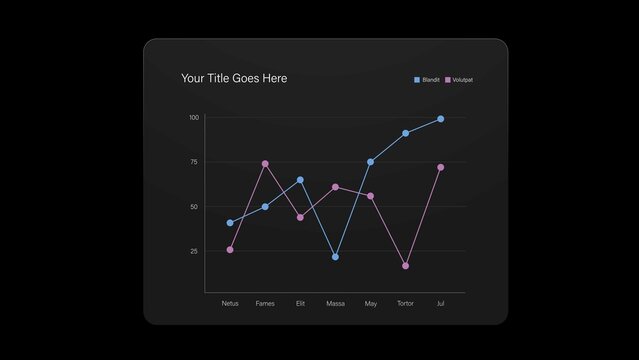
Line Graph Infographic

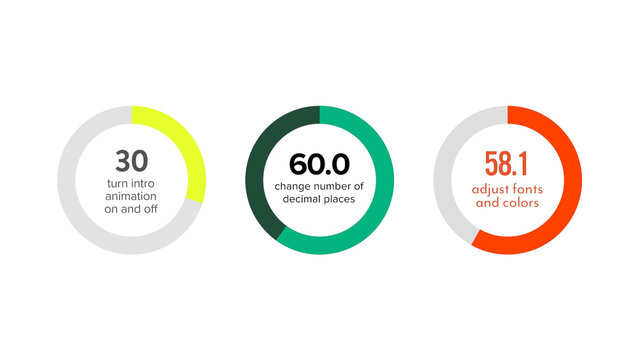
Circular Percentage Infographic with 3 Styles


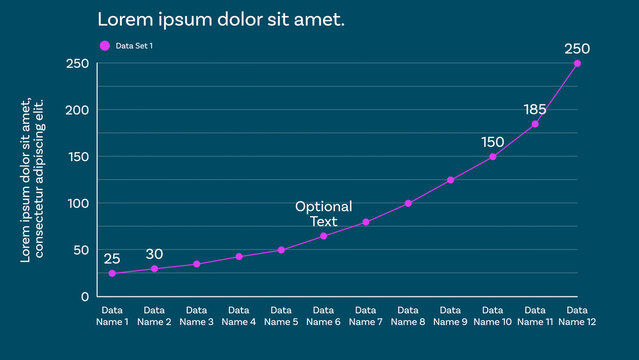
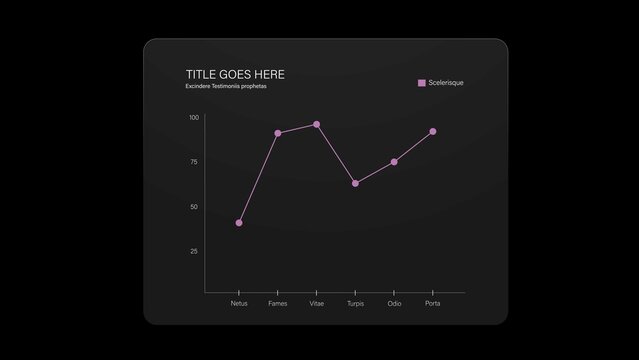
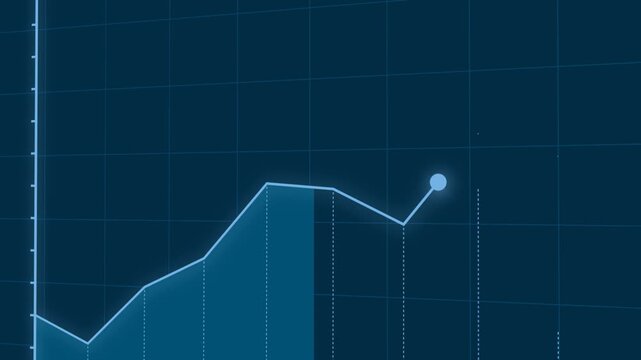
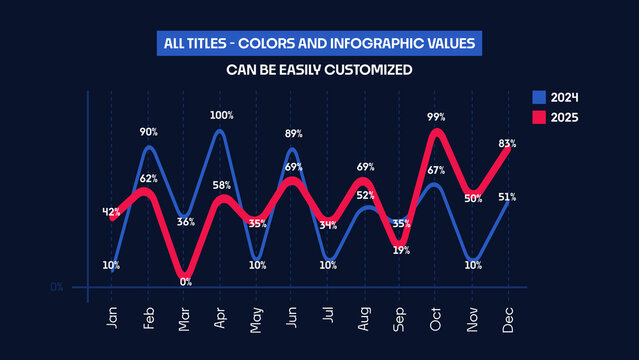
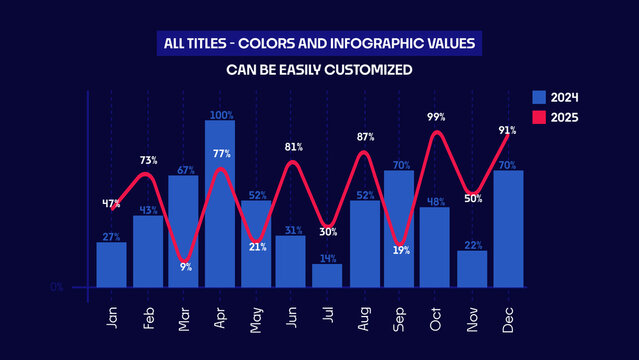
Responsive Line Graph for Clean and Modern Data Visualizations Design and Slide Presentations with up to 12 Animated Data Points and Optional Labels to show Percentages, Whole Values, and Custom Texts

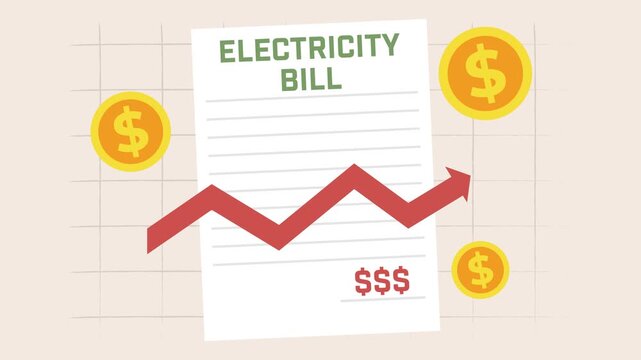
Animated Financial Icons Overlay

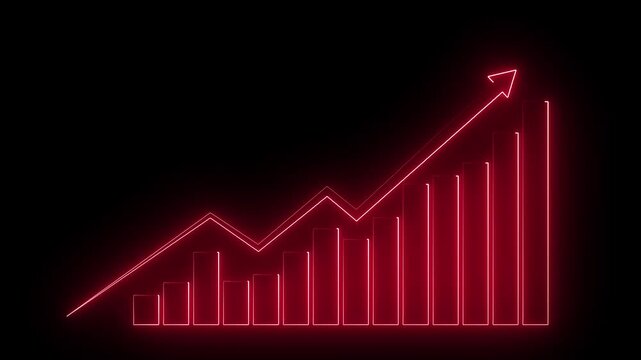
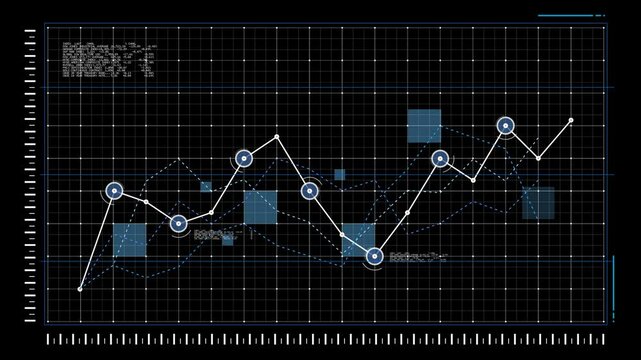
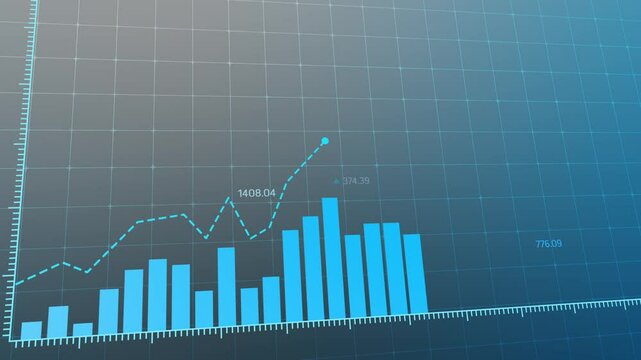
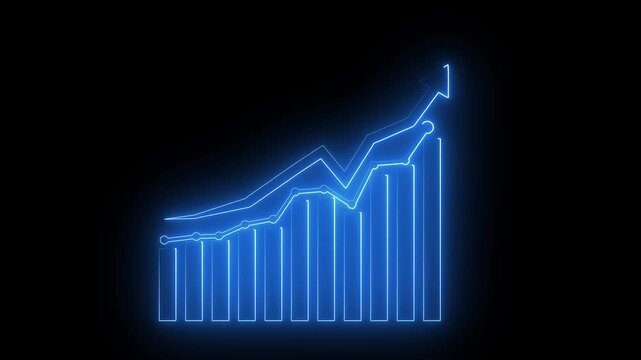
Stock Trading Animated Graph Title Template

Animated Line Chart Infographics | Business Data Visualization and Analytics Graph

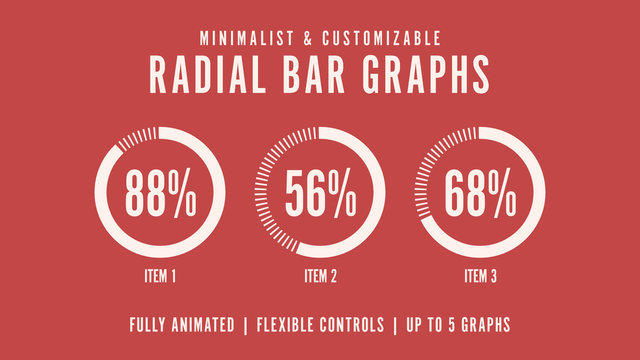
Minimalist Dashed Lines Radial Graph
Line Chart Infographic Video Template
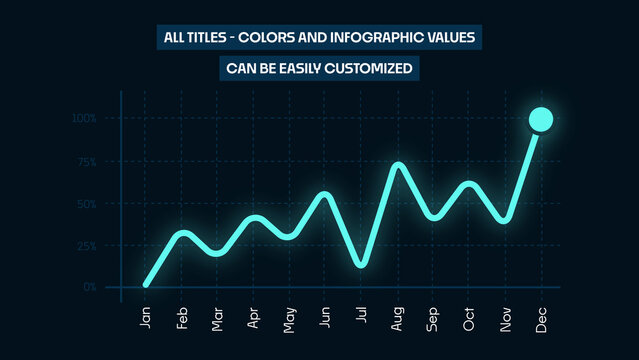
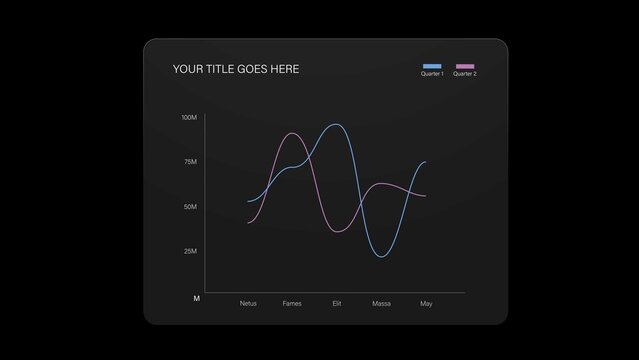
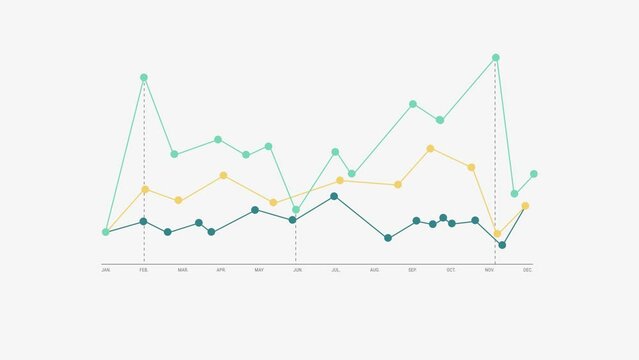
Data-Driven Wavy Line Graph Infographic
FREE

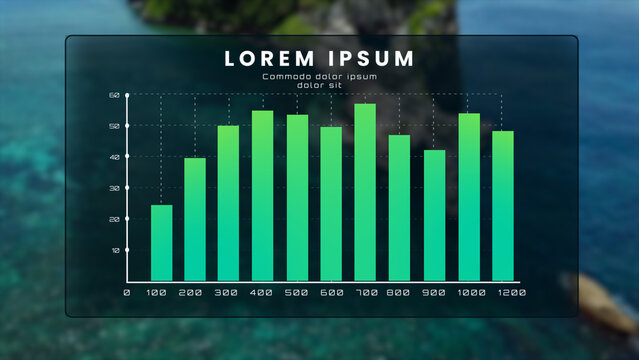
Minimal Gradient Chart Infographic


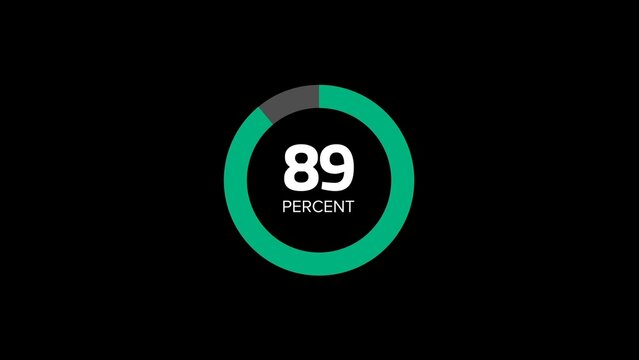
Circular Percentage Infographic with 3 Styles


Presentation Business Circle Infographic
Infographics


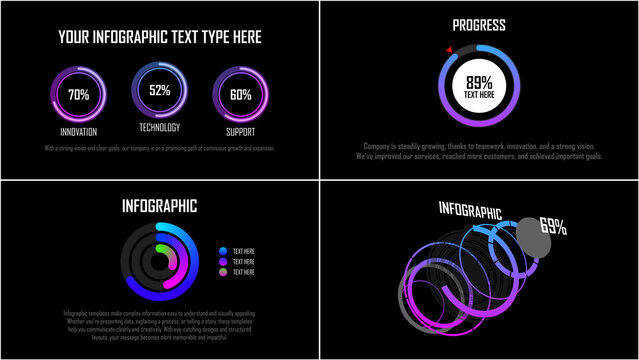
Modern Data Infographics

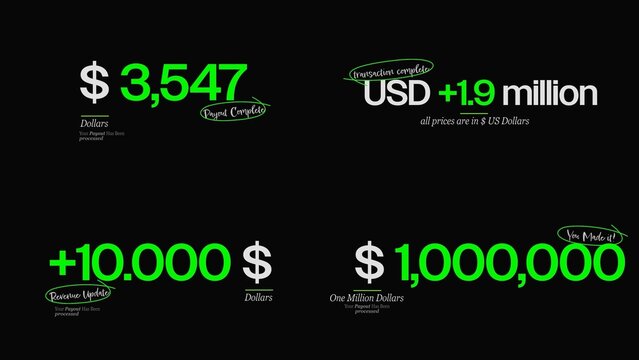
Currency Counters Text Animations | Animated money values, exchange rates & price displays for finance & banking.
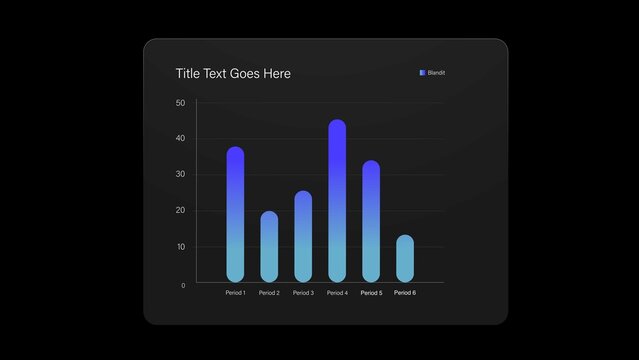
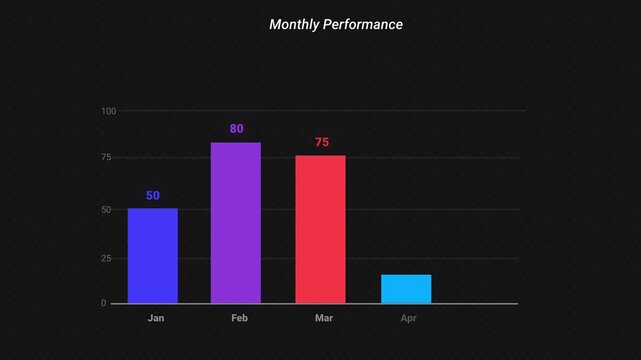
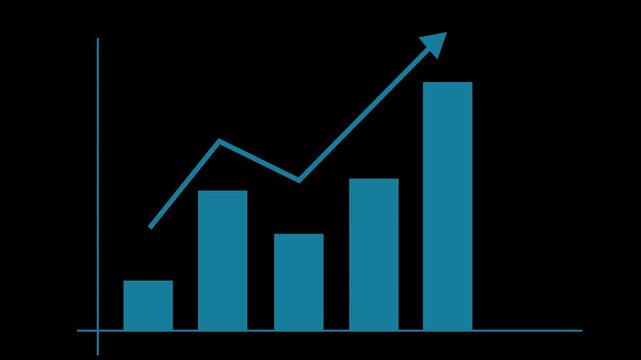
Infographic Bar Chart Video Template
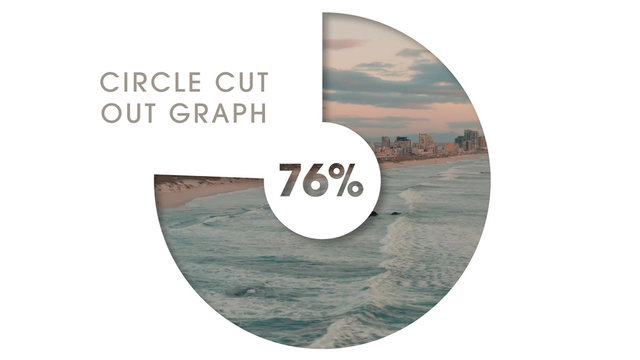
Circle Cut Out Bar Graph


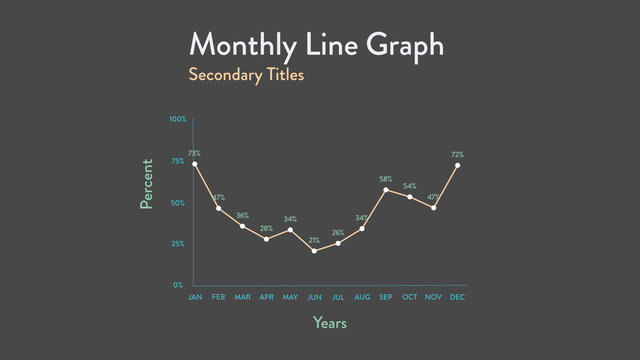
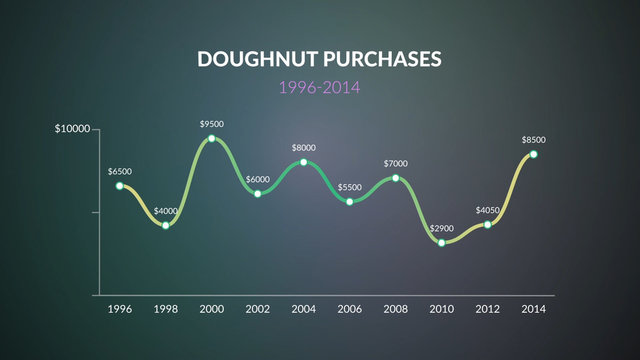
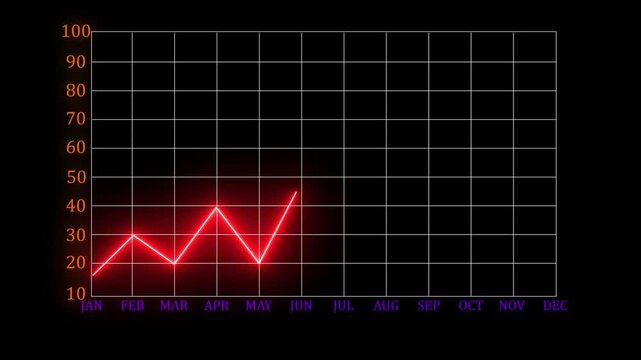
Monthly Line Graph Infographic

Animated Infographics Comparison Chart | Dynamic Line Graph for Business Finance and Marketing Data Visualization

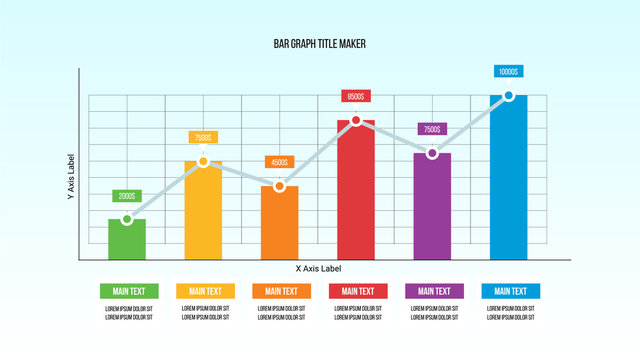
Bar Graph Maker


Line Chart Infographic Video Template
Infographic Clean Bar Chart


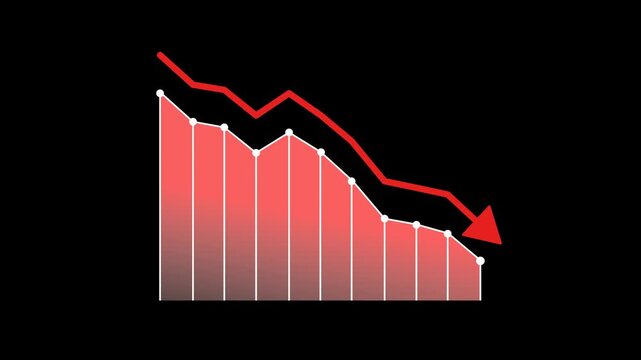
Stat Infographic with Increase and Decrease


Animated Annual Report Infographics | Business and Financial Data Charts

Line Chart Infographic Video Template
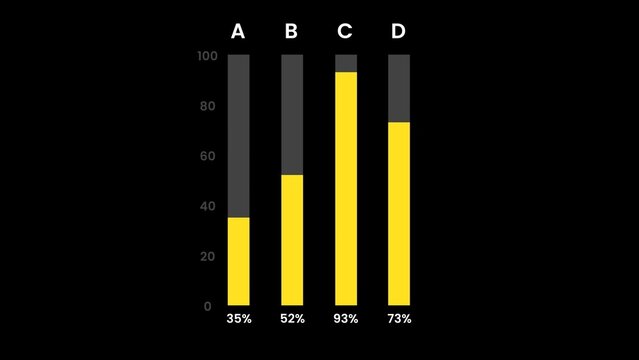
Infographic Modern Bar Chart


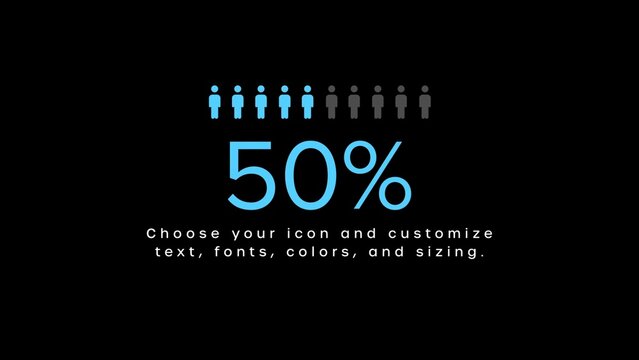
Infographic Maker with Percentage
Business Impact Analysis | 5 Different Resolutions with Control Panels