A link to set your password has been sent to: To access your purchases in the future you will need a password.
Create without limits — unlimited downloads, plus powerful AI editing
New filters added
Sort by

7,553 results for three chart in videos

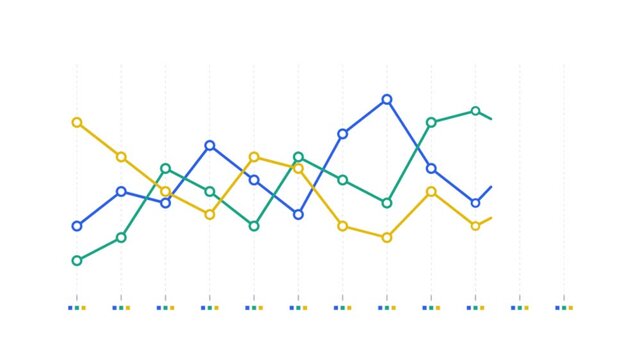
Animated line graph with three colorful data trends, financial growth chart on white background, business analytics and statistics motion graphic
00:10
HD
Neon-style glowing bar chart on black background with axes and three trend arrows overlay animation
00:05
HD
Blue and white cryptocurrency trader desk with three
00:25
HD
Teamwork, planning and charts as three colleagues lean together over printed reports and a tablet on an office table, discussing research, document details and business project analysis.
00:14
HD
Simple Black Bar Chart Icon, Simple black bar chart icon with three ascending bars and axes
00:05
HD
Digital audio console interface displaying vibrant wave patterns and frequency levels across three dynamic screen panels designed for sound processing and music production studio software environments
00:06
HD
Modern data visualization bar chart with fluctuating trends
00:10
HD
Digital human wellbeing monitoring graphics showing glowing lung icons and data charts across three distinct panels illustrating vital signs with vibrant neon gradients on black screens
00:06
HD
Market share comparison infographic animation with rotating three segment donut chart, proportional blocks and waffle chart in blue, teal and orange on white background, seamless loop
00:18
HD
A red neon line graph displays an upward trend across three distinct segments against a dark background.
00:05
HD
Wage stream data interface showing fluctuating numeric values on three repeating digital panels featuring neon graphical user elements with oscillating wave patterns and evolving chart metrics
00:06
HD
Glass workflow nodes route a glowing data pipeline into three lanes feeding a live output chart, seamless loop
00:16
HD
A mock up dashboard displays various data visualization elements including line graphs pie charts and bar charts across three panels, showing data reporting interfaces
00:08
HD
On start multi-line chart showing three color traces rising, crossing, layering, visualizing trends
00:12
HD
Blank organizational chart template with three columns and color coded hierarchy diagram for business planning
00:09
HD
Animated financial infographic chart displaying three numerical steps moving along a green wave digital data motion video
00:11
HD
Minimalist bar graph illustration with three columns on a light background
00:07
HD
Digital displays showing basket abandonment analytics featuring glowing neon line charts and data bars fluctuating across three separate monitor screens inside a dark virtual environment
00:06
HD
Woman analyst studies data charts at computer. Focused professional in an office reviews graphs across three monitors for finance reporting and work insights. Clear data driven business concept.
00:07
HD
Animated motion graphics showing a smiling robot head icon connecting to a vertical growth bar chart via three loading dots. Concept of AI data analytics, performance optimization, and stats
00:06
HD
Neon line 3 step infographic process with check mark icon. step process success with check marks. Step-by-Step Guide 4k ...
00:10
HD
Neon-style glowing bar chart on black background with axes and three trend arrows overlay animation
00:05
HD
Colorful three dimensional pie chart infographic rotating on dark background graph data statistics finance business
00:07
HD
A digital reasoning loop shows probability distribution curves moving across three sequential screens within a dark interface featuring glowing cyan pink and green line charts
00:06
HD
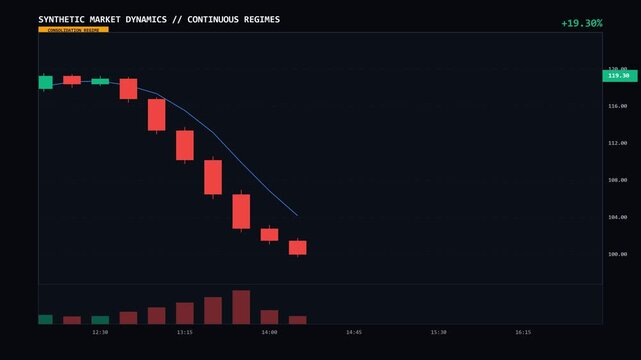
Institutional broadcast-style continuous financial chart animation showcasing three market regimes (Bullish Rise, Sideways Consolidation, Bearish Decline) in 4K 16:9 seamless loop.
00:10
HD
Minimalist circular infographic chart design featuring three segmented parts connected by a continuous glowing directional progress arrow
00:05
HD
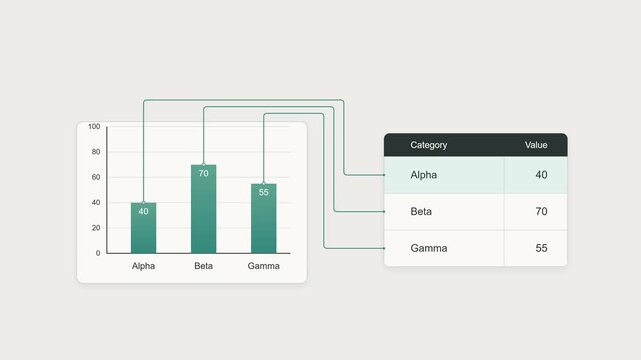
Accessible Bar Chart With Matching Data Table and Reading Order 4K accessibility focused analytics animation showing a three category bar chart connected to an equivalent data table
00:10
HD
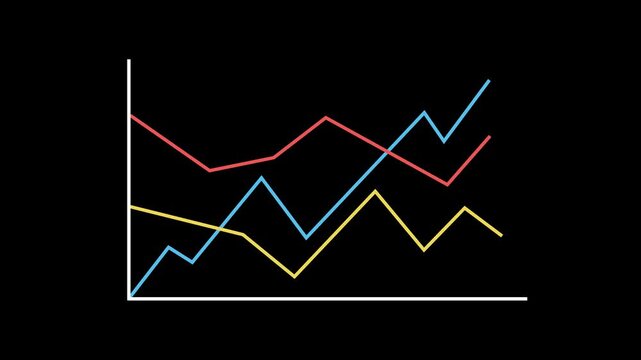
Animated multi-line chart motion graphic showing three colorful trend lines (blue, red, yellow) drawing progressively on a transparent background. Perfect overlay for business, finance, stock market
00:05
HD
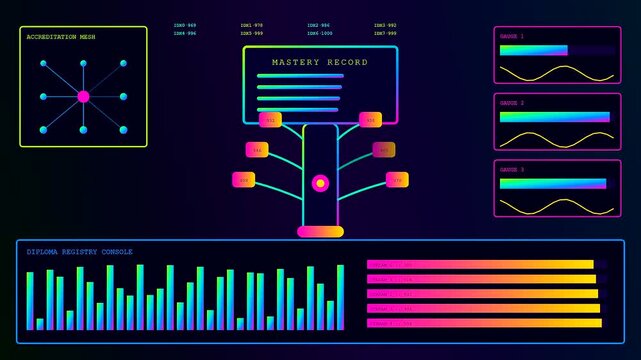
A digital diploma system interface displays progressive data metrics across three separate monitor screens showing evolving graphs charts and network node structures in dark aesthetic
00:06
HD
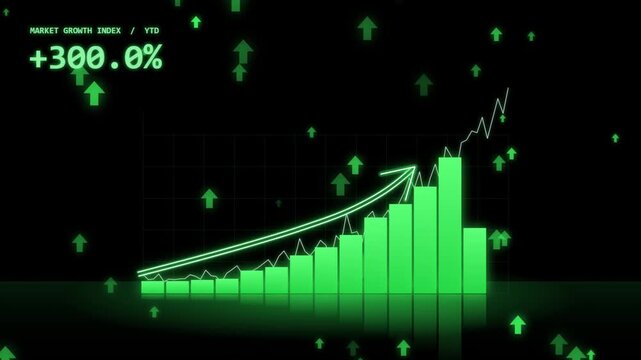
Digital fintech holographic bar chart illustrating significant market growth index with upward trending arrow and three hundred percent increase neon green display
00:08
HD
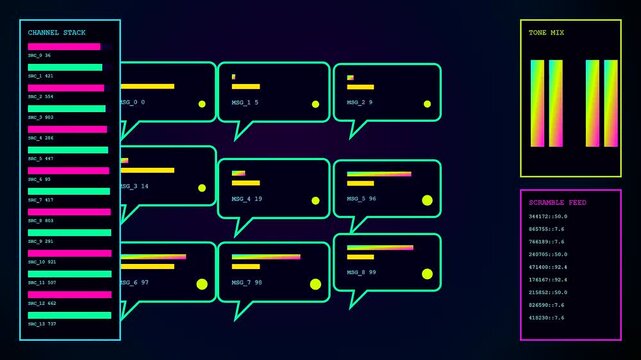
Digital displays showing sentiment analytics as dynamic graphic charts with glowing neon lines and colorful chat bubbles moving across three separate panels in a sequence
00:06
HD
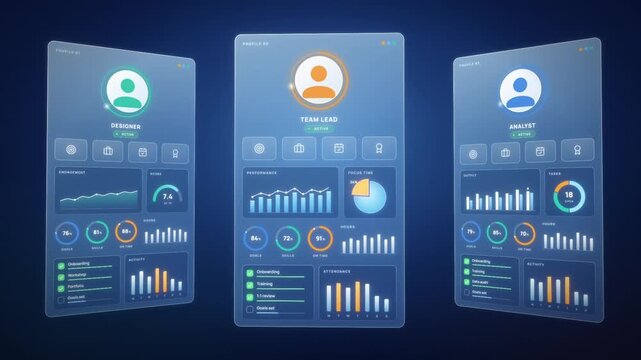
Employee performance dashboard UI with three glass profile cards filling with charts, goals and checklists
00:15
HD
Chart growth animation raises silver three dimensional bars. Rising chart growth animation trends business profit curves. Modern chart growth animation loops finance metrics.
00:05
HD
Monitoring recovery analytics on a vibrant digital display showing health metrics in three stages with glowing neon fluid levels and shifting charts for biological data
00:06
HD
On load multiline chart animating three traces moving area rising polys flowing showing market data
00:12
HD
Business growth chart animation showing steps one, two, and three leading to success in motion footage
00:11
HD
Animated colorful segmented rings rotating around three circles on a solid black background. Ideal for modern infographics, dark UI design, dashboard elements, or loading icons.
00:06
HD
Ultra modern glowing blue financial growth chart with ascending 3 D bars and dynamic data line
00:05
HD
Mature investment analyst works on three monitors. He works with risk tables and allocation charts. The office is bright and modern. Concept of investment portfolio and risk management.
00:10
HD
Pink neon rising arrows financial growth bar chart three glowing arranged in a graph formation against a solid
00:10
HD
Bar Chart Growth: A vibrant bar chart illustrates a positive trend with three colorful bars, representing an upward trajectory of data and progress.
00:08
HD
Neon-style glowing bar chart on black background with axes and three trend arrows overlay animation
00:05
HD
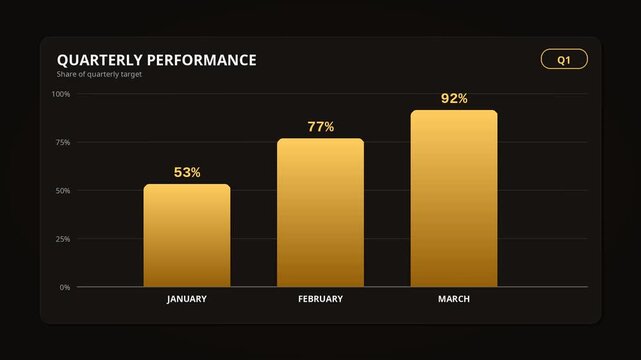
Quarterly performance bar chart animation golden bars ninety three percent
00:10
HD
Three trend lines drawing in sequence for multi series comparison
00:12
HD
Cyan three panel screen with image chart and 3D result detail view
00:20
HD
The acronym IPO Initial Public Offering is spelled out using three wooden letter blocks placed on top of a background featuring financial candlestick charts and graphs. 3D render animation
00:07
HD
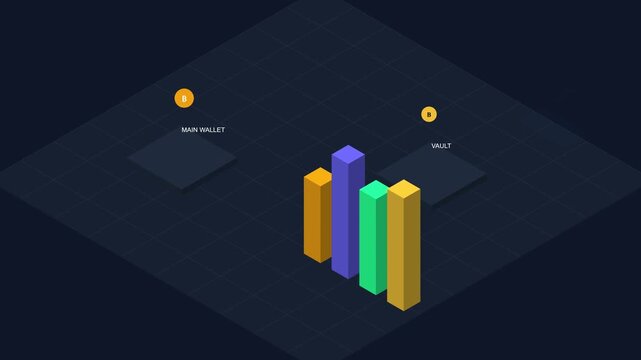
A dynamic three dimensional representation of professional financial growth analytics featuring rising colored bar charts set against a dark isometric digital background
00:15
HD
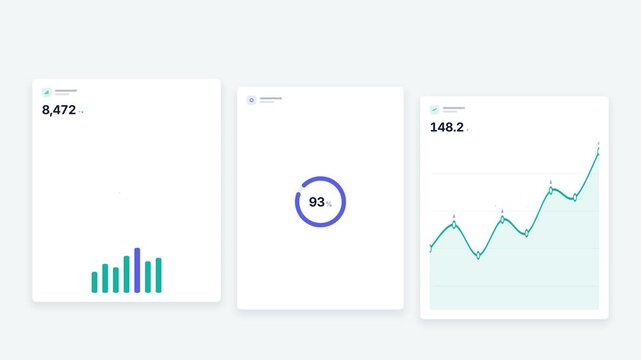
High-quality motion graphic animation of three sleek UI dashboard widgets displaying live data counters, animated bar chart, 92% circular progress gauge, and rising trend line graph
00:10
HD
Businesswoman working at laptop in cafe beside glowing three dimensional economic growth bar chart
00:10
HD
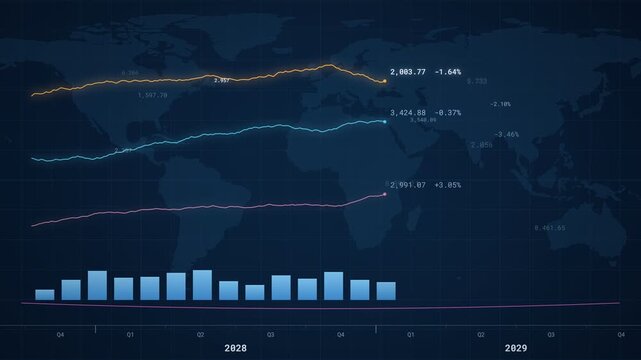
Animated global stock index chart with three rising lines, volume bars and world map on navy, market growth, investment and financial forecast display
00:14
HD
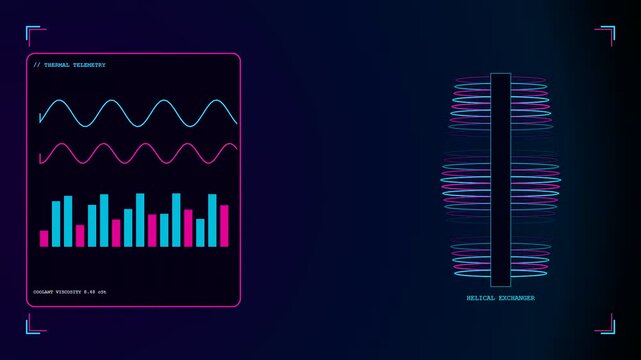
Immersion cooling systems displayed in three side by side panels showing shifting wave forms bar charts and glowing rotating circular rings on dark blue screen
00:06
HD
Candlestick chart climbs from world map connection arcs into a finance dashboard with three gauges
00:16
HD
dark mode dashboard with three circular percentage gauges, neon lime neon
00:05
HD
3 d financial growth chart with rising arrow showing business success and market profitability analysis
00:07
HD
Flat vector style illustration of three colleagues discussing work around a laptop with a chart board, chat bubble, sticky note, clock and plants, isolated on a transparent background (alpha channel).
00:10
HD
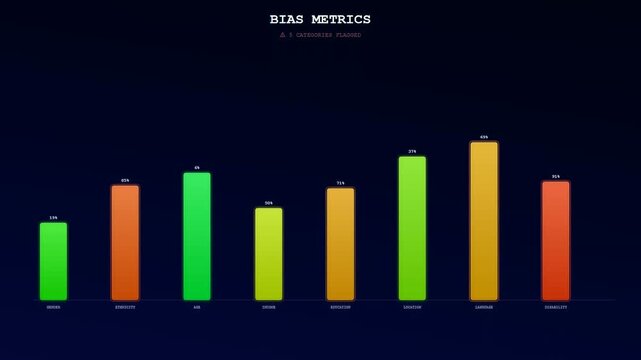
A digital screen displays AI Bias Auditing metrics that incrementally evolve through three progressive animation stages to reveal growing statistical data and colorful comparative bar chart analysis
00:06
HD
Rising bar chart showing business growth on plain blue background a set of white three dimensional vertical bars increasing
00:07
HD
Clinical trial medical research dashboard animation displaying patient recruitment enrolled cohort, three phase progress indicators, and rising drug efficacy statistics chart
00:11
HD
Animated 3 d bar chart showing financial growth and business success with rising trend line on dark background
00:15
HD
Yellow neon rising arrows financial growth bar chart a set of three glowing in a graph format, illustrating business
00:10
HD
Minimal teal three dimensional bar chart showing upward growth
00:08
HD
Neon-style glowing bar chart on black background with axes and three trend arrows overlay animation
00:05
HD
Growth Icon with Rocket and Bar Chart Animation,A icon of a bar chart with three ascending bars and a rocket symbol indicating growth or progress
00:06
HD
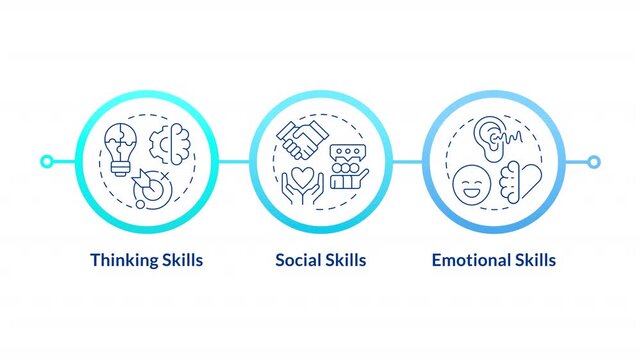
Core pillars of mental wellness infographic circles animation. Cognitive development and emotional growth. Flowchart dynamic presentation with 3 steps process. HD video, motion graphics
00:11
HD
Animated 3 d bar chart showing business growth
00:06
HD
Blue hexagon infographic 3 steps template animation, sequence options HD video, process layout empty design element, animated blank diagram visualization motion graphics on transparent background
00:08
HD
 black and white video motion illustration of a pie chart divided into three sections
00:05
HD
Minimalist 3 d isometric bar chart animation for business data visualization and financial growth analysis 4k
00:10
HD
a colorful skill matrix is displayed across three glowing panels showing a digital pyramid chart with dynamic audio bars and wave patterns in dark space
00:06
HD
Probability modeling visualization showing a geometric grid with glowing dots falling into a statistical bar chart pattern across a dark digital interface screen in three stages
00:06
HD
a vulnerability scan showing moving network diagnostic data charts on three screens with glowing node connections and shifting digital segments in a dark system environment
00:06
HD
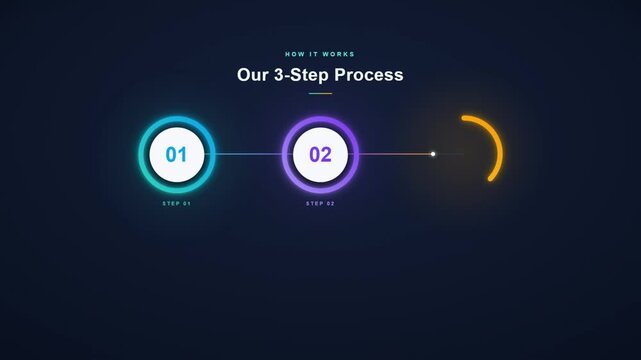
Three step process infographic with glowing numbered circles connected on dark gradient background
00:10
HD
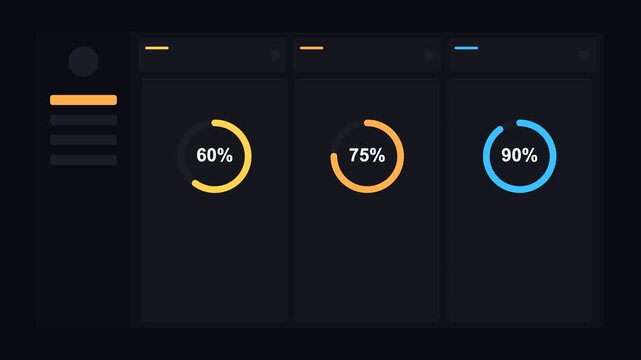
dark mode dashboard with three circular percentage gauges, neon gold neon
00:05
HD
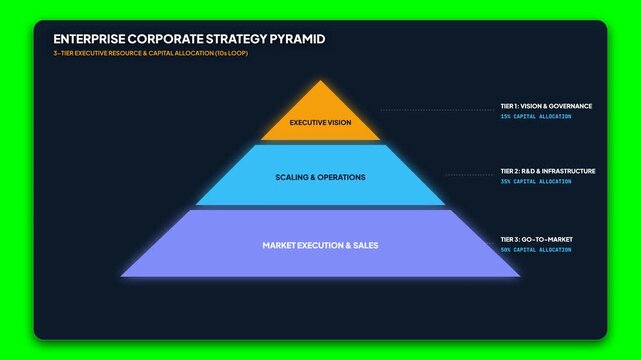
Enterprise corporate strategy pyramid, business hierarchy diagram with three tiers, executive vision and operations chart on green screen
00:10
HD
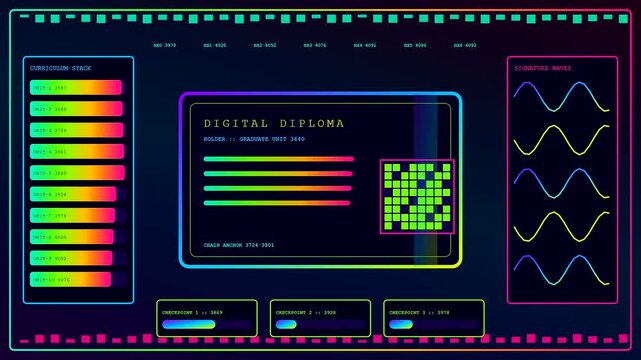
A digital diploma screen showing dynamic neon wave patterns and data bar charts in a glowing futuristic interface presented within a three panel video sequence
00:06
HD
Digital displays showing trajectory vectors and oscillating waveforms across three separate panels in a sleek dark environment with vibrant neon glowing line chart animations
00:06
HD
Flying over a glowing purple three dimensional candlestick chart, stock exchange, financial data and technology
00:10
HD
Modern office desk setup with three computer monitors displaying business charts and financial data analytics.
00:10
HD
Animated line graph chart with three data trends for business analytics and financial reporting data visualization
00:10
HD
Three panels standing with glowing lines connecting bar charts and circular diagram, AI-generated
00:05
HD
Futuristic holographic bar chart displaying profit growth over three years, 2022 to 2024, projected in a modern office setting with blurred background, financial reports and business presentations
00:10
HD
Neon-style glowing bar chart on black background with axes and three trend arrows overlay animation
00:05
HD
Infographic growth 2D line graph animation. Business trend three lines graph animation, growing arrows. Yearly business graph showing business success grey color graph paper Background. Alpha channel.
00:12
HD
Three Experienced Stock Traders Talking Business, Consulting Documents and Argue About Data. They Work for a Big Stock Exchange Firm. Office is Full of Displays Showing Infographics and Numbers.
00:11
HD
A futuristic bar graph with three glowing blue columns of varying heights surrounded by swirling digital particles.
00:08
HD
Icon animation of three parts diagram, white background.
00:06
HD
93 ninety three percent number circle pie diagram chart animated
00:06
HD
Dollar and euro currency exchange rate charts three dimensional style
00:06
HD
a colorful bioinformatics interface featuring rotating circular neural network models and evolving bar charts presented as a three part sequence in a digital software display
00:06
HD
Digital displays showing signal shielding status with glowing neon charts and wireless network connection bars pulsing rhythmically across three separate analytical panels in dark environments
00:06
HD
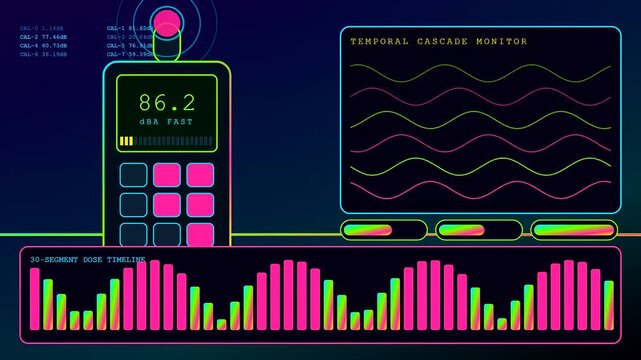
A digital decibel meter display shows fluctuating sound waves across three rhythmic panels illustrating oscillating audio frequency levels during a sophisticated real time monitoring session loop
00:06
HD
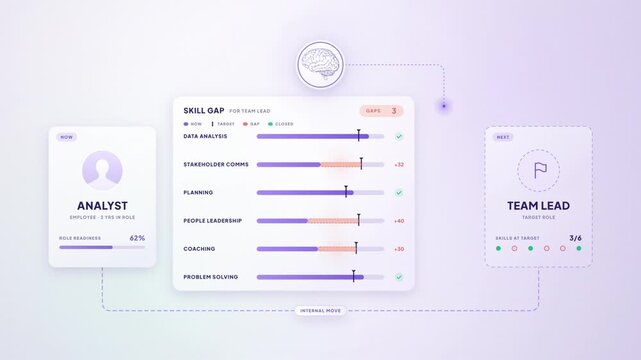
Skill gap analysis closing three gaps via course, tutorial and mentor until analyst is ready for team lead
00:15
HD
Business video infographics with three circles and arrows. 2d animation visualization with 3 steps for diagram, flowchart, banner, presentations, web, content, levels, chart, graphic
00:10
HD
Financial Data Display: A digital interface showcases three distinct line graphs, each representing a different data trend with vibrant colors against a dark, modern backdrop.
00:10
HD
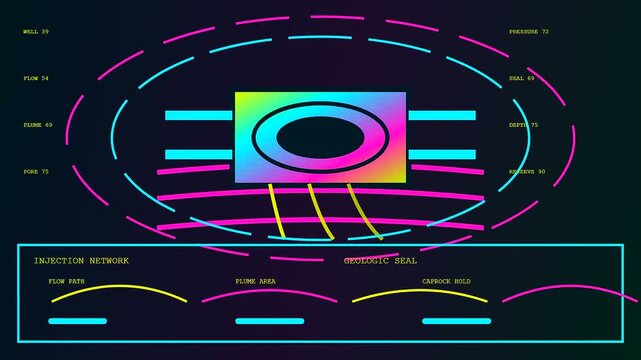
Digital carbon sequestration data interface showing three split panels with neon glowing geometric charts and moving metrics for geological monitoring of underground industrial storage pressure levels
00:06
HD
Warehouse optimization systems are displayed across three digital panels featuring neon glowing graphical interfaces with changing flow charts and data metrics for industrial logistics software
00:06
HD
3d animation of XYZ axis rotating with black background. Illustration of Three direction location arrows with RGB color
00:10
HD
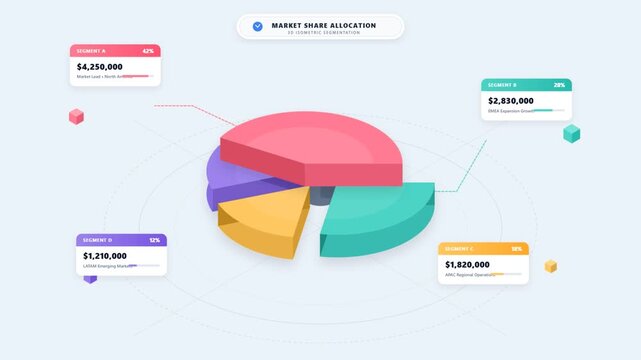
Isometric 3d pie chart animation displaying market share data and
00:10
HD
Three Circular Frames Gradient Style Linked Together Minimalist Presentation Element high quality professional
00:19
HD
Venn diagram animation. three circle round infographic. Grow or success profit diagram concept. Available in 4K FullHD and HD video
00:06
HD