A link to set your password has been sent to: To access your purchases in the future you will need a password.
Create without limits — unlimited downloads, plus powerful AI editing
New filters added
Sort by

3,775 results for technical report in videos

High-tech technical screen with automated robotic assistant for real-time system log analytics and information technology videos, hud animation
00:15
HD
People, engineer and reading with tablet at warehouse for planning, machine update and technical guide. Team, digital and production manual, automation safety and diagnostics report for manufacturing

00:05
HD
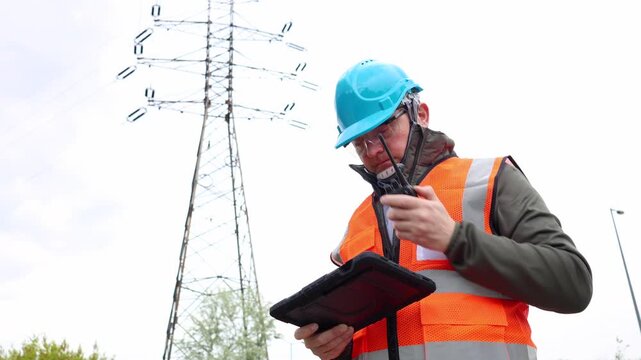
Electrical safety inspector entering technical audit data into a tablet application and communicating real-time report status via portable walkie-talkie radio. Power engineer.

00:05
HD
Stock Market Chart, Beautiful 3d Animation of Japanese Candlestick Graph in Time Lapse. Seamless Looping Ultra HD 4K 3840x2160

00:30
HD
Two African adult male engineers study laptop and printed sheet near production machine, coordinating inspection result, technical review and data driven manufacturing decision inside
00:16
HD
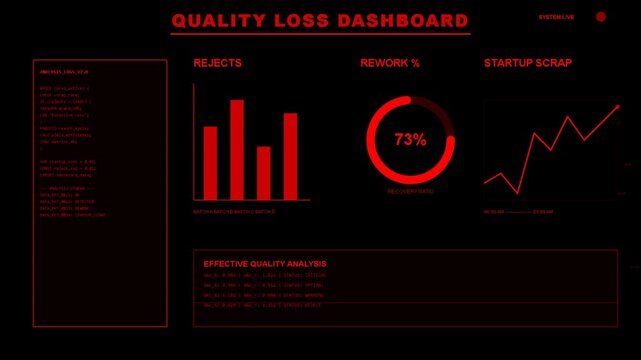
Digital quality loss dashboard with red charts, performance analytics, metric tracking, data visualization, interface monitoring, technical report
00:09
HD
Financial market analysis and investment strategy planning, technical chart interpretation, and collaboration between traders to identify market trends and evaluate potential trading opportunities.
00:11
HD
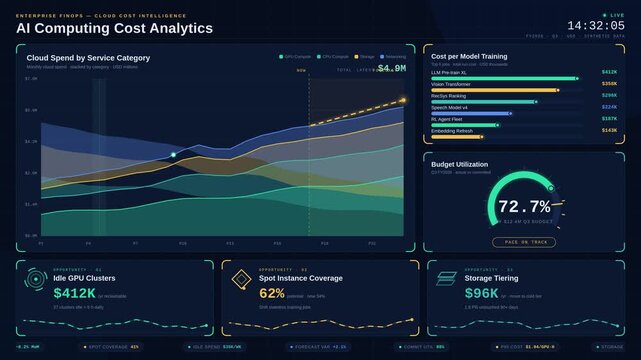
Data analyst reviewing cloud computing cost metrics on a digital dashboard
00:15
HD
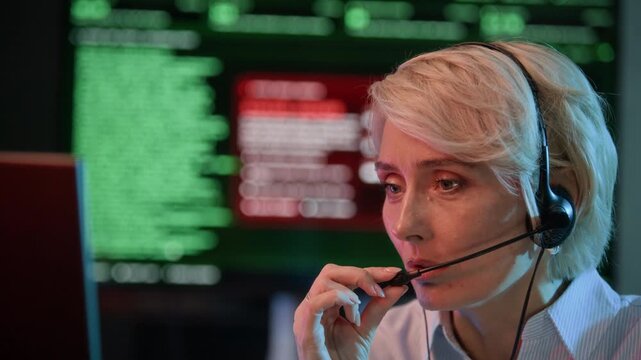
Chest up shot of adult Caucasian female technical operator detecting cyber attack and reporting via headset while monitoring network system on computers in office
00:10
HD
Three screen segments displaying digital biometric verification analysis of human hands with pulsing neon lines and changing data metrics over a dark atmospheric green interface display
00:06
HD
Professional Male Software Engineer, Data scientist Looking at Monitor Reviewing Coding and AI Model while Analyzing, Developing New AI Module and Datum in Tech Office at Night.
00:07
HD
Abstract circular interface element with data visualization on light. Technical abstract circular interface element for corporate report charts. Modern abstract circular interface element graphic.
00:06
HD
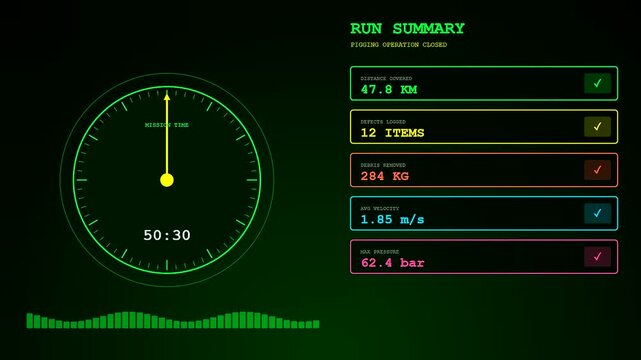
Pipeline pigging data displayed on a digital interface monitor showing circular progress gauges and green scrolling sound wave frequency bars during a complex monitoring system operation
00:06
HD
Portrait of Middle Eastern and African American construction managers in helmets discuss site plan. Supervisor speaks with engineer and gives instructions
00:16
HD
Viewing an official vehicle report on a smartphone. The screen displays VIN, region, production year, and body type. Perfect for automotive apps, car buying, and vehicle history visuals.
00:14
HD
A professional office setup featuring a person using a laptop with floating graphs and statistics, symbolizing business analysis and strategic decision making. Xenic
00:10
HD
Golden candlestick bar floating with technical line chart, gold trading investment strategy, bullrish commodities market price trend graph, uptrend financial economic growth profit 3d rendering
00:18
HD
Digital audit report concept featuring glowing cyber network interface with integrated for financial analysis, cybersecurity, banking, artificial intelligence, and technical support systems in motion
00:10
HD
Diagnostics concept with digital technology icons for testing, detection, condition analysis, data monitoring, and technical evaluation.
00:10
HD
Advanced USA map displayed circular scanning graphics, markers technical interface details. network operations, defense 19, location analysis, infrastructure planning, connectivity modern data
00:20
HD
Organized bald engineer writes technical details into formal document as inspects various areas of building. Businessman records precise observations into report
00:17
HD
Thinking, electrician and writing at site with clipboard, inspection and compliance for construction. Lens flare, man and checklist at worksite for information, electrical report and building safety
00:09
HD
Inference latency graph for performance metrics across different artificial intelligence model versions, for data visualization, system efficiency, speed optimization, technical analysis
00:20
HD
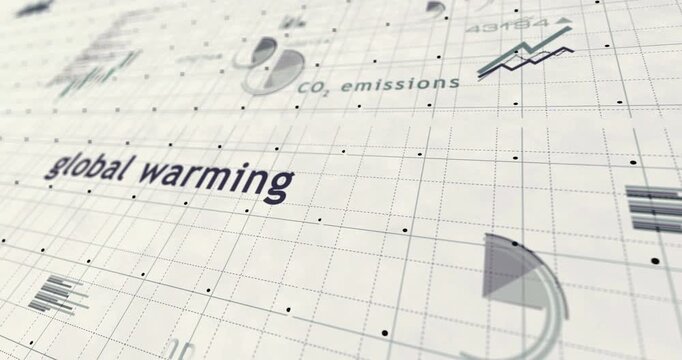
Data visualization graphic representing global warming and carbon emissions trends on a technical grid layout for environmental science reports
00:15
HD
Engineering team reviewing inspection report at refinery plant, industrial maintenance, production operation, facility management, engineering communication, technical inspection.
00:18
HD
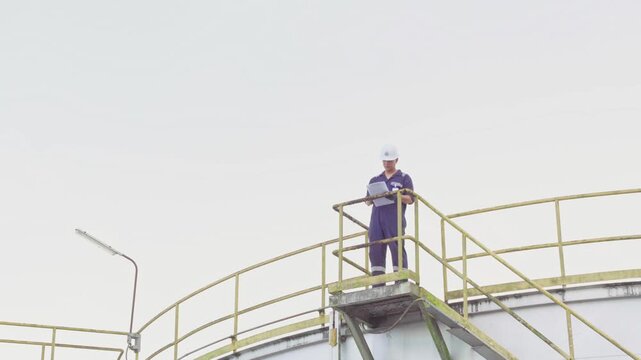
Engineers petrochemical checking report for technical inspections in oil refinery. Technicians working on checklist in the oil storage tank area. Factory and industry manufacturing. Crude Oil tank
00:12
HD
Financial market analysis and investment strategy planning, technical chart interpretation, and collaboration between traders to identify market trends and evaluate potential trading opportunities.
00:11
HD
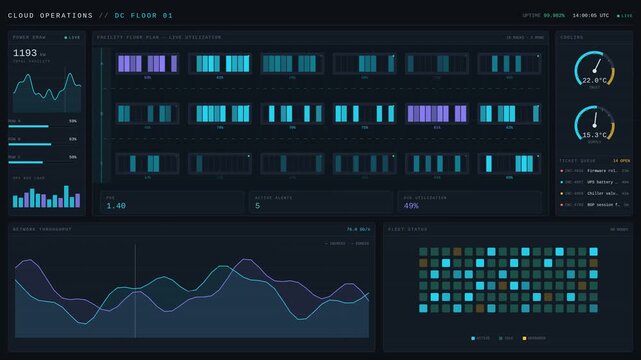
Digital data center cloud operations dashboard displaying real time analytics
00:15
HD
Pan shot of diverse group of middle aged specialists discussing reports during oil industry meeting. Ideal for corporate communication and energy sector marketing presentations
00:10
HD
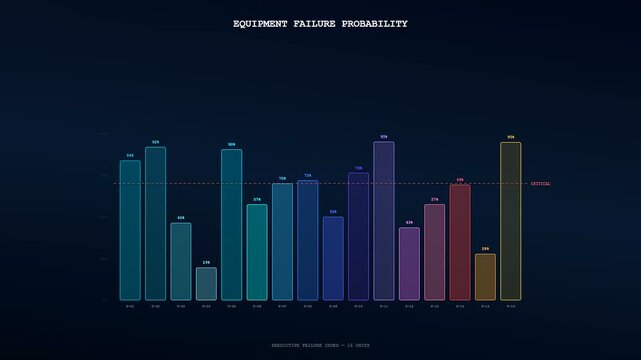
Predictive maintenance monitoring displays vibrant bar charts with shifting colorful data metrics rising across digital screens in a dark room environment showing complex analytical software output
00:06
HD
Digital Infographic Dashboard with Network Connecting Icons 2D Animation
00:12
HD
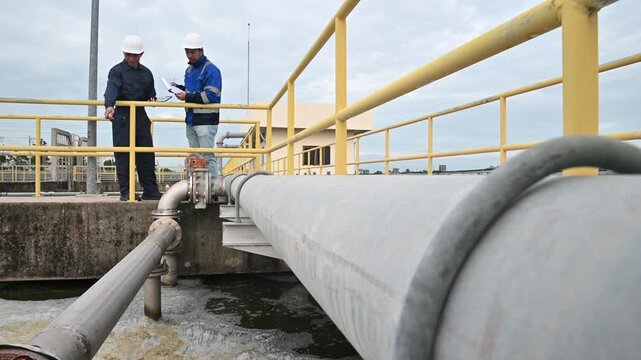
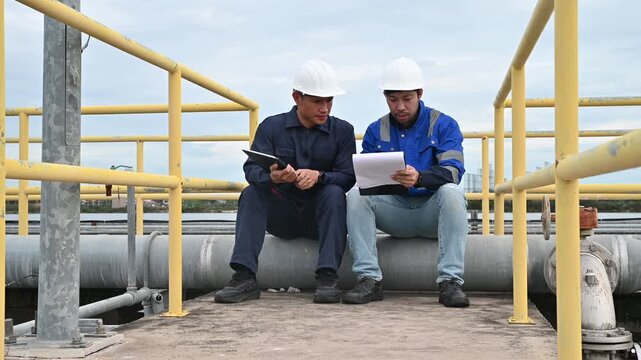
Engineers Checking Technical Plans and Pipeline Systems at an Industrial Treatment Plant
00:14
HD
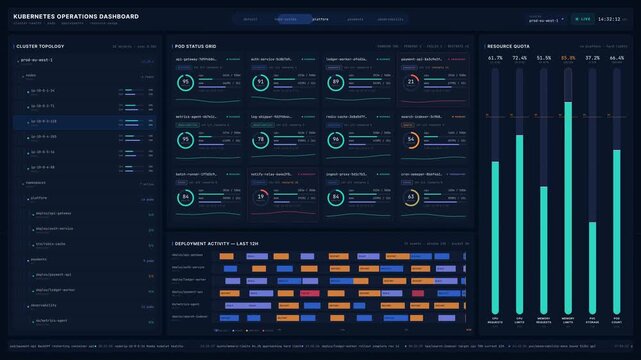
Explore a detailed Kubernetes operations dashboard showcasing cluster health, pods, deployments, and resource usage with a midnight color scheme and technical precision layout.
00:15
HD
Neon document file icon animation. Text page symbol. File document sign. Paper, report, form, article and document management technical content and digital data storage concept animation.
00:10
HD
User purchasing an extended car history report on a smartphone app. High-quality footage of mobile vehicle assessment, VIN checking, and technical data review. Ideal for automotive services, finance
00:16
HD
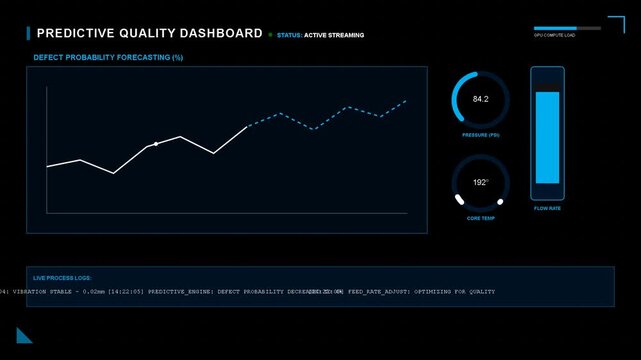
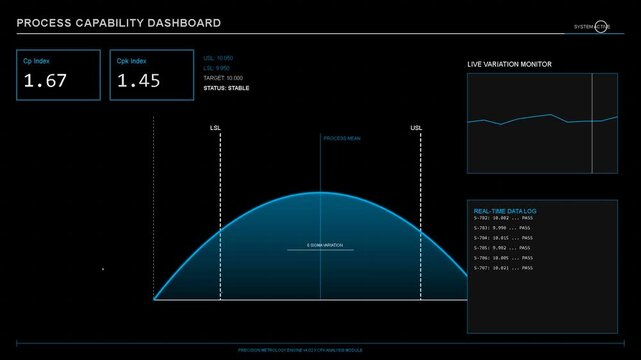
predictive quality dashboard analytics interface with live performance line graph, data monitoring, technical process oversight, system efficiency metrics
00:09
HD
Tirzepatide clinical trial data scan, dual action obesity medication dark mode research report text overlay
00:10
HD
Digital accuracy report concept with glowing cyber network interface featuring data analytics, cybersecurity, artificial intelligence, banking, and technical support for corporate business
00:10
HD
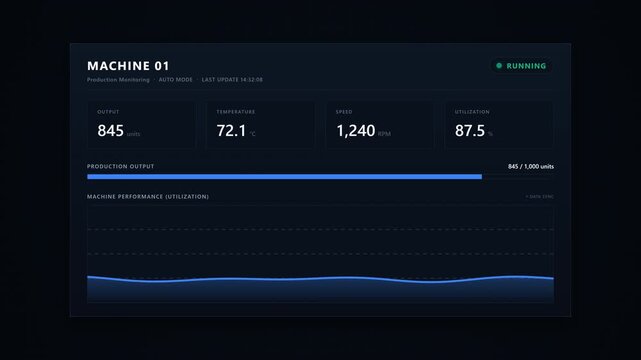
Industrial Performance Dashboard Interface Displaying Real-Time Operational Data Analytics for Manufacturing Systems
00:15
HD
Debug text flickers computing interface, revealing exception messages broken runtime programming documentaries, technical support system outage scenes, suspense trailers, corrupted software visuals.
00:20
HD
Attentive bald man matches digital meter display with documented data. Professional worker compares technical meter values with structured information in report sheet
00:08
HD
College, students and laptop in class with stress, browser crash and late assignment with data loss. University, people and frustrated with tech for technical glitch, high plagiarism report and worry
00:09
HD
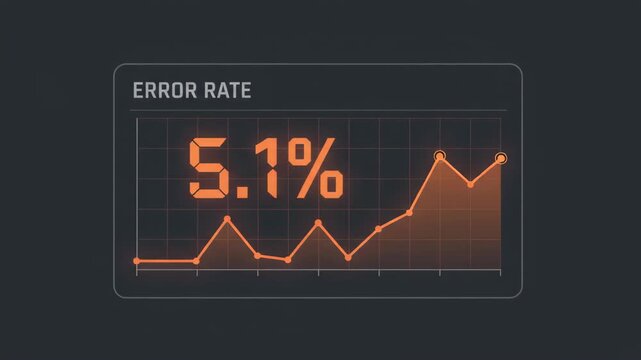
digital dashboard displays a fluctuating yellow line graph indicating a 6.5% error rate set against a dark minimalist solid background representing technical system performance metrics
00:06
HD
Analytics strategy dashboard tracking corporate performance metrics and advanced technical data stream vectors
00:18
HD
Engineer communicates by handheld radio while reviewing inspection checklist beside industrial electrical equipment. Transformer maintenance coordination, technical report, facility safety monitoring.
00:16
HD
Golden candlestick bar floating with technical line chart, gold trading investment strategy, bullrish commodities market price trend graph, uptrend financial economic growth profit 3d rendering
00:18
HD
Financial market analysis and investment strategy planning, technical chart interpretation, and collaboration between traders to identify market trends and evaluate potential trading opportunities.
00:10
HD
Engineering professionals collaborating during a project meeting while reviewing documents and discussing technical plans, business strategy, and research development.
00:12
HD
Advanced data analytics and market research concept with statistical icons and technical gear structures.
00:15
HD
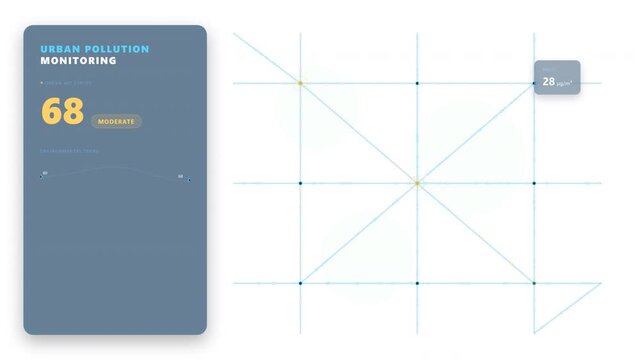
Digital Urban Environmental Air Quality Analytics Interface Visualization with Geometric Grid Layout and Statistical Monitoring Data
00:12
HD
Motion graphic animation of technical seo analysis data charts and graphs, website optimization, coding development, online metrics
00:05
HD
Engineering Team Analyzing Technical Data and Pipeline Systems at Industrial Facility
00:15
HD
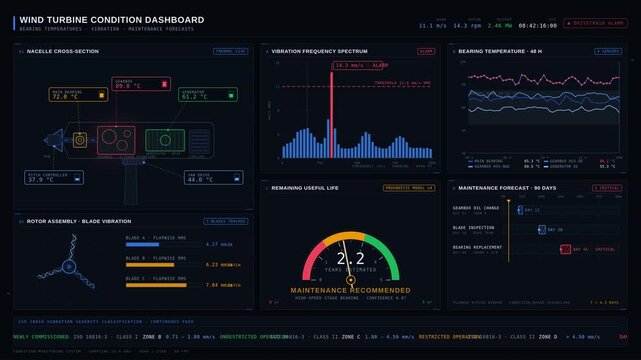
Industrial wind turbine condition dashboard showcasing bearing temperatures, vibration analysis, and maintenance forecasts with detailed technical schematics and monitoring panels.
00:15
HD
Technical Expert In Orange Safety Vest Assessing Digital Dashboards In Industrial Environment
00:08
HD
Candlestick bars graph stock market trading data. Trading data animation tracks technical finance chart progress. Trading data corporate report records business metrics.
00:11
HD
Petrochemical Engineers checking reports tablet for technical inspections in oil refinery. Technicians working on checklist in the oil storage tank area. Factory and industry manufacturing. Oil tank
00:10
HD
A digital drone pollination interface displays flight patterns and radar tracking metrics within a glowing blue aerial surveying system for automated botanical monitor data collection tasks
00:06
HD
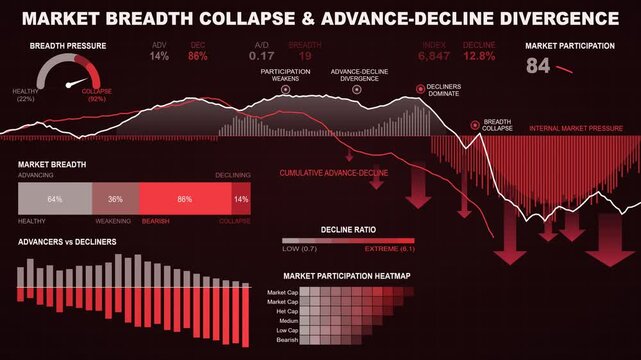
Modern financial data visualization dashboard showing stock market breadth collapse and technical analysis trends
00:08
HD
Dynamic system status gauge animation featuring a moving needle indicating performance levels from green to red for data monitoring, technical interface dashboards, and analytical reporting
00:10
HD
System failure alert icon with a computer monitor and red cross symbol indicating technical errors or network connection issues
00:05
HD
Driver explains accident details to insurance agent in garage closeup. Man inspector with clipboard interviews owner about vehicle crash at service station
00:10
HD
Man, electrician and writing at site with clipboard, inspection and circuit compliance for construction. Thinking, person and checklist at worksite for protocol, electrical report and building safety
00:12
HD
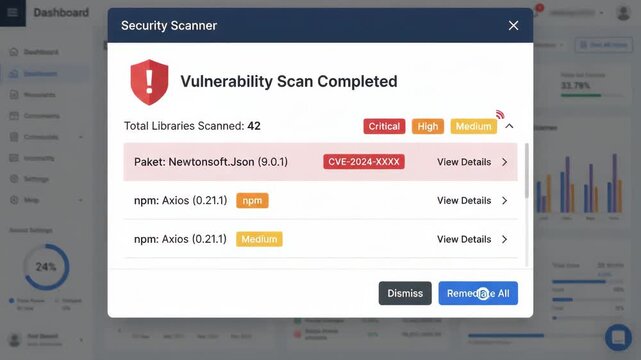
digital security scanner notification window displaying completed vulnerability scan with detected threats over blurred software dashboard interface background
00:06
HD
Tilt up close up shot of adult Caucasian cybersecurity operator wearing headset monitoring digital network interface and system data in control room and providing technical support
00:17
HD
Modern Uptrend Stock Market Chart Animation on Black Background
00:08
HD
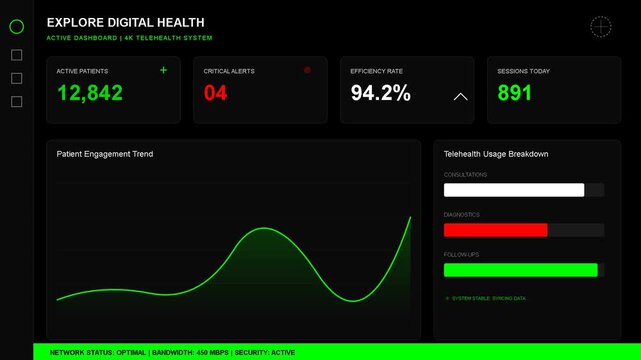
Digital health dashboard displaying live data metrics, wave graph, progress bars, and analytics interface for business performance monitoring and technical reporting
00:09
HD
Financial market analysis and investment strategy planning, technical chart interpretation, and collaboration between traders to identify market trends and evaluate potential trading opportunities.
00:10
HD
Engineer reviewing technical documents and project information at a computer workstation while colleagues collaborate in the background.
00:10
HD
Advanced data analytics and business intelligence concept with modern charts, research, and technical icons.
00:12
HD
Hypertension medical report diagnostic data text montage, high blood pressure clinical journal stop motion typography
00:10
HD
Automated report digital network interface with cybersecurity and data analytics cyber security business intelligence
00:10
HD
Professional Engineers Reviewing Maintenance Reports at Industrial Water Treatment Plant
00:14
HD
Animated error rate analysis dashboard with severity versus recency weighted frequency, for software system monitoring, performance metrics, technical troubleshooting, data visualization
00:20
HD
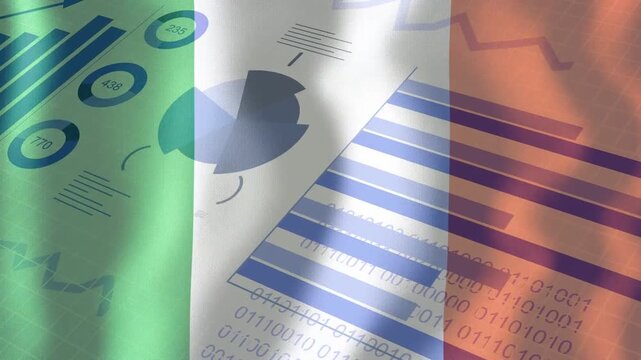
Ripple starting, tricolour overlay rippling across charts, revealing bars and binary for report
00:12
HD
4K animation of online car vehicle checklist inspection concept. Car maintenance technical service report and car safety inspection review.
00:07
HD
Petrochemical Engineers checking reports tablet for technical inspections in oil refinery. Technicians working on checklist in the oil storage tank area. Factory and industry manufacturing. Oil tank
00:11
HD
Online technical support platform concept. Person typing keyboard with repair and customer support icons, remote troubleshooting, technology support and digital service assistance.
00:15
HD
 Business reporting and data visualization concept featuring glowing blue gears with icons for financial tracking and project analysis.
00:12
HD
Futuristic blue world map built from luminous pixels combines floating statistics technical global connectivity, financial analytics, digital economy, information systems worldwide data exchange.
00:20
HD
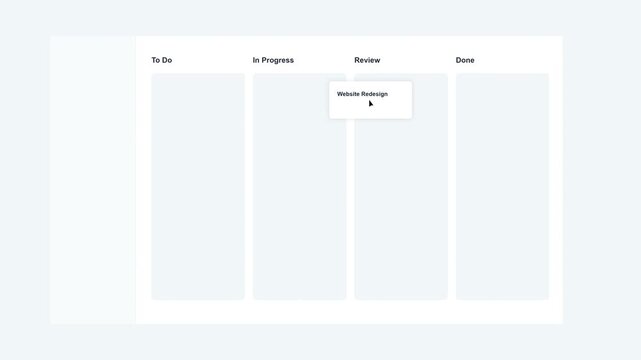
Digital Project Management Dashboard Interface Featuring A Dynamic Kanban Board Workflow For Streamlining Task Organization And Team Productivity
00:15
HD
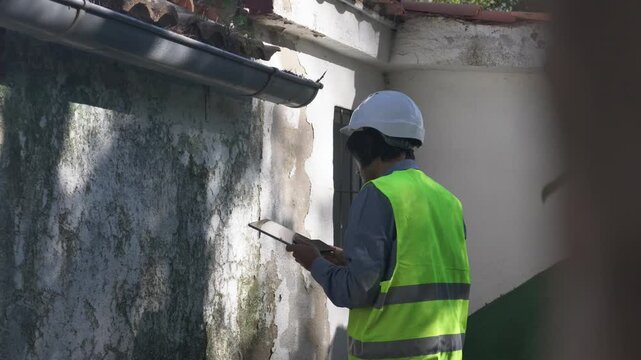
Building inspector wearing a hard hat and safety vest evaluating an old wall with moss and humidity, taking notes on a tablet to prepare a detailed report for property renovation
00:13
HD
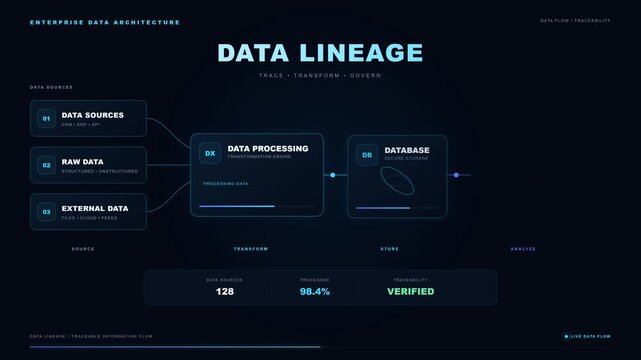
Modern digital infographic with glowing flow chart of data lineage process, concept for enterprise information architecture, business intelligence dashboard, software development report and corporate
00:10
HD
Green tech data dashboard showcasing line graphs and information analysis summaries for an analytics report screen
00:20
HD
Hand pointing at a bright digital screen displaying professional financial stock market data with rising and falling candlestick charts for technical analysis of global economic trends
00:10
HD
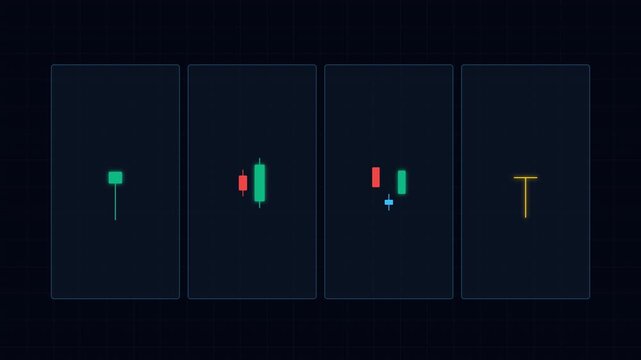
Showcasing green and red candlestick market patterns for finance data, technical trading, and investment symbols. Suitable for financial presentations.
00:10
HD
Digital dashboard showing data analytics, metrics, live line graphs, and system performance, ideal for technical interface or software display
00:09
HD
Financial market analysis and investment strategy planning, technical chart interpretation, and collaboration between traders to identify market trends and evaluate potential trading opportunities.
00:11
HD
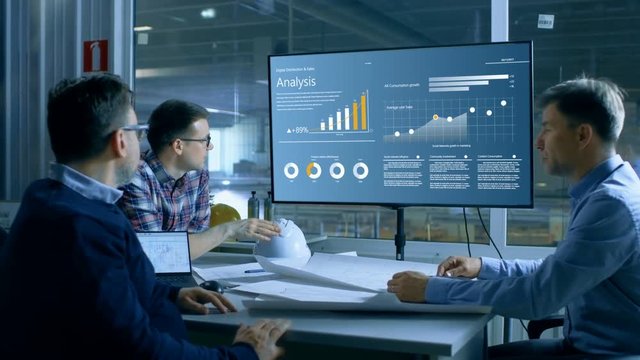
Chief Industrial Engineer Has Meeting with Management and Executives in the Heavy Industry Factory Have Quarterly Meeting Room, They Look at Production Statistics on a Big Screen.
00:07
HD
Optimization of website content, structure and technical development, content strategy checklist improve SEO ranking and data driven report on screen video animation.
00:08
HD
Engineer writing a report
00:27
HD
Business woman using tablet app showing progress report data walking through modern office to diverse people team meeting sharing group concepts steady motion
00:31
HD
Blue Abstract Polygonal Lines Shapes Background Loop
00:50
HD
Digital connection stability graph with network uptime downtime status with fluctuating line charts, for technical analysis, data monitoring, system performance, internet connectivity
00:20
HD
Benchmarking as business compare tool. Performance, quality and cost comparison to competitor companies. Moving banner with entrepreneurs analyzing data. Cartoon flat animated graphics
00:10
HD
Woman, engineer and reading with tablet at warehouse for research, machine update and technical guide. Person, digital or production manual, automation safety and diagnostics report for manufacturing
00:05
HD
Petrochemical Engineers checking reports tablet for technical inspections in oil refinery. Technicians working on checklist in the oil storage tank area. Factory and industry manufacturing. Oil tank
00:15
HD
Doctor in safety glasses reviews digital brain scans. Suitable for medical, scientific, technology, healthcare, and research concepts in graphics and design.
00:10
HD
Numerical value concept illustrates abstract data processing, mathematical zero, statistics analysis, and character computing for various financial and technical operations
00:17
HD
Candlestick Trading Chart Close-up - Stock and cryptocurrency trading animation concept
00:11
HD
technical analysis
00:16
HD