A link to set your password has been sent to: To access your purchases in the future you will need a password.
Create without limits — unlimited downloads, plus powerful AI editing
New filters added
Sort by

1,990 results for quarterly in videos

Did you really mean: quartal
Benchmark result for a quarterly evaluation, with a Confidence score of 68 percent
00:12
HD
Businessman reviews financial quarterly report papers near digital tablet on desk. Corporate audit paperwork analysis, budget planning workflow, investment performance review.
00:12
HD
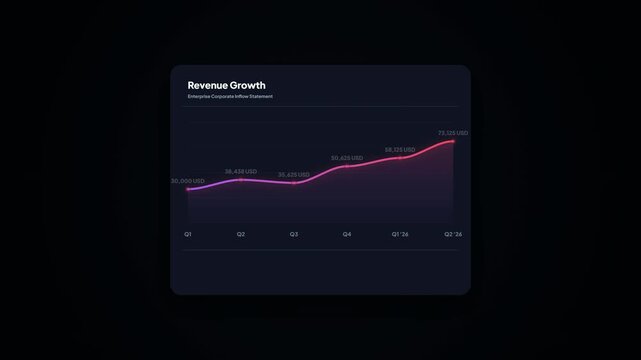
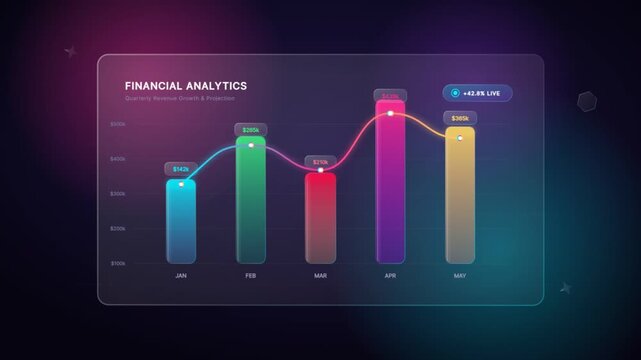
Financial revenue growth line chart dashboard component with glowing neon pink gradient line showing quarterly performance analytics
00:32
HD
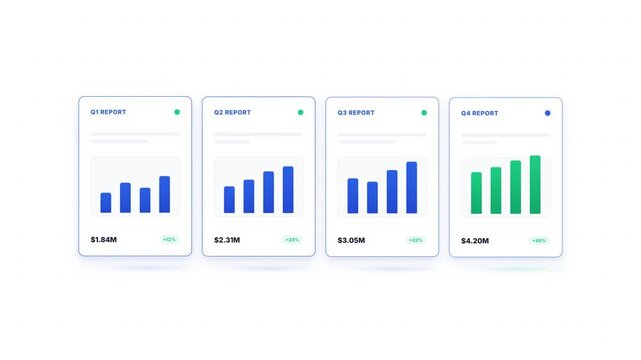
Flat design 2D animation showing quarterly performance report with financial growth and bar charts
00:09
HD
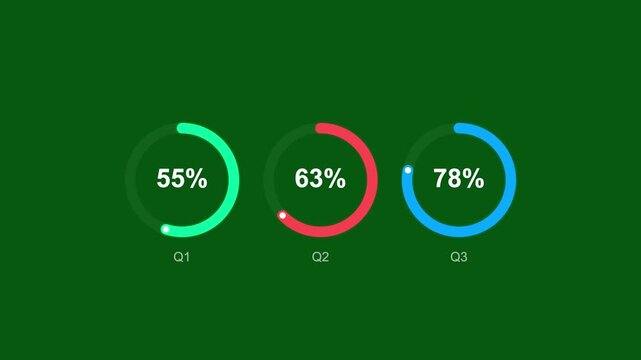
Animated infographics circular progress chart animation, quarterly percentage statistics visualization, green background motion graphics for business dashboard
00:10
HD
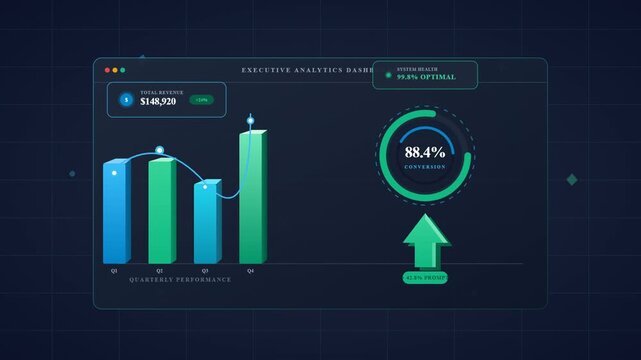
Digital business dashboard with quarterly revenue bar charts and analytics graphs
00:15
HD
Performance Dashboard – Monthly Bar Graph Animation
00:15
HD
Animated quarterly performance business presentation title with geometric shapes
00:08
HD
Next level business performance in 2027 with rising growth chart, quarterly revenue increase and target hit for corporate success. Foretell.
00:12
HD
Reaching your quarterly sales target faster with an interactive performance tracking HUD board on dark backdrop
00:18
HD
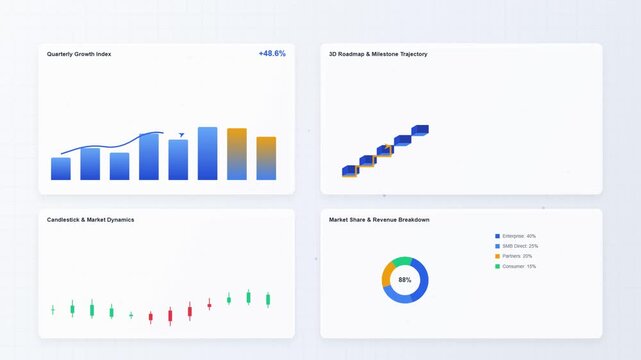
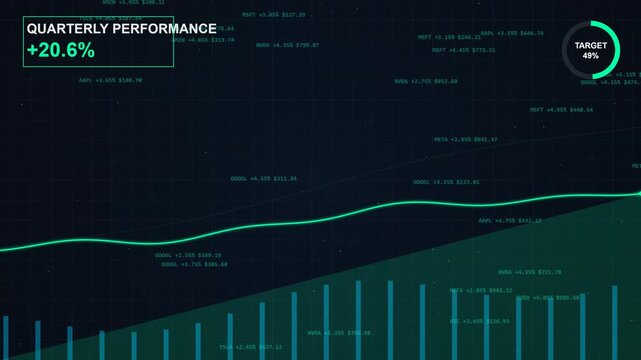
Financial dashboard analytics: quarterly growth, market share, and trading candlestick charts business
00:10
HD
Wireframe roadmap timeline with diamond milestones and quarterly
00:10
HD
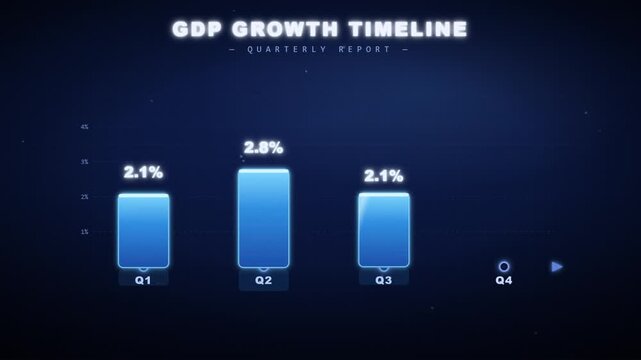
Animated blue business bar chart and line graph showing quarterly GDP growth timeline and annual percentage
00:12
HD
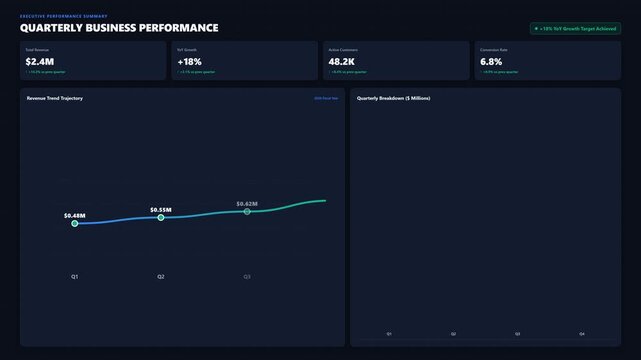
Quarterly Business KPI Dashboard Animation with Analytics Charts Professional 4K animated KPI dashboard showing business analytics, quarterly performance metrics
00:15
HD
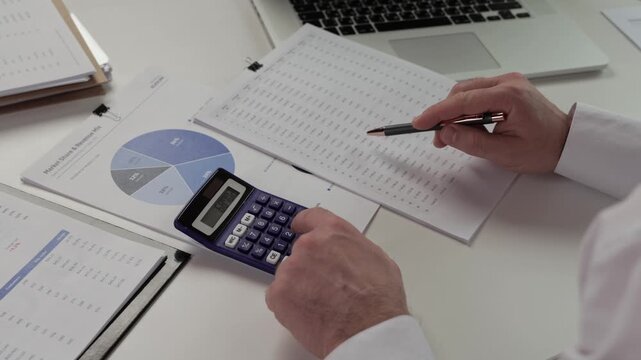
Business professional calculating figures with calculator and reviewing printed quarterly reports beside laptop during financial analysis at office desk
00:15
HD
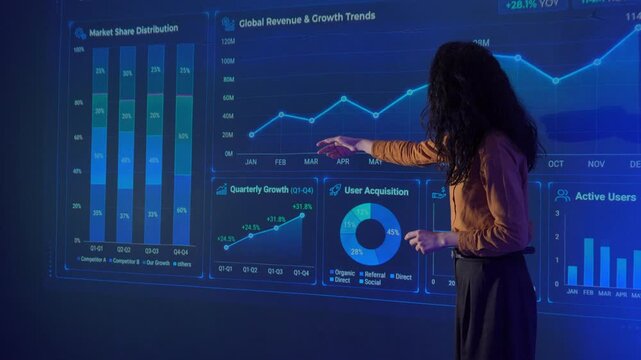
Businesswomen analyzing global market trends and revenue data during a corporate presentation, teamwork, data analytics, financial strategy, and technology-driven decision making in a modern office.

00:17
HD
Business quarterly report documents animation with animated charts
00:08
HD
Animated quarterly growth dashboard with rising bar charts
00:10
HD
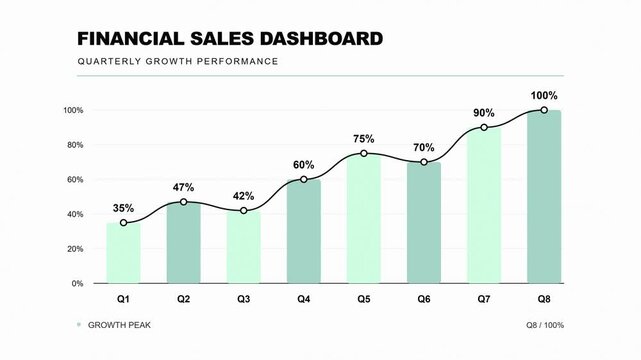
Financial sales quarterly growth performance chart dashboard. 4K Video
00:10
HD
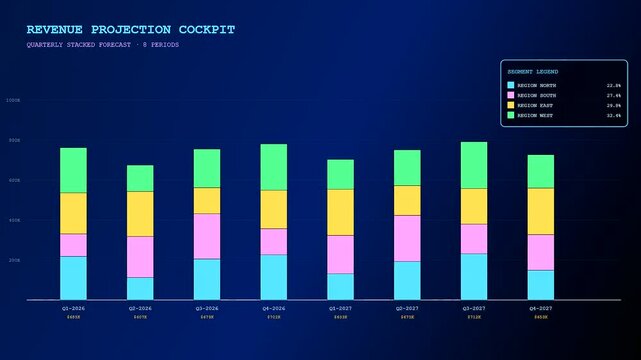
A digital predictive analytics display interface shows shifting quarterly revenue projections for multiple market regions using vibrant stacked bar charts on a deep dark blue screen
00:06
HD
Animated blue business infographic report with donut percentage charts, bar graphs and annual figures on tilted screen, corporate data analysis slides
00:15
HD
Businessman analyzes sector performance charts, papers, laptop desk at home. Financial investment audit, corporate market research analysis, quarterly revenue report review.
00:10
HD
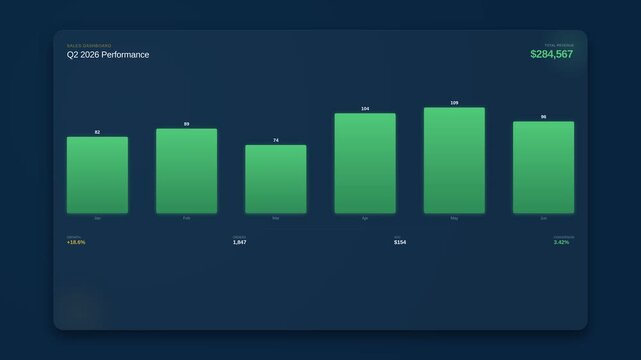
Green bar chart showing positive quarterly performance with upward trend on dark background
00:10
HD
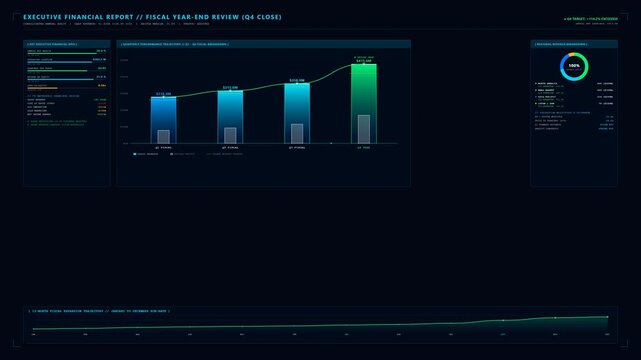
Ultra HD 4K corporate business Q4 financial report and fiscal year-end growth loop with rising quarterly comparison charts, EBITDA margins, and boardroom KPI HUD.
00:10
HD
Corporate dashboard with key performance indicators and quarterly growth charts
00:15
HD
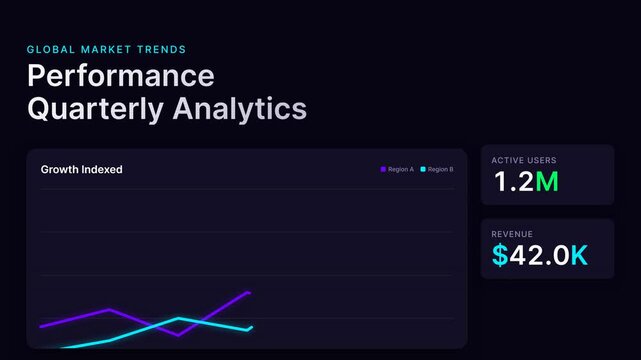
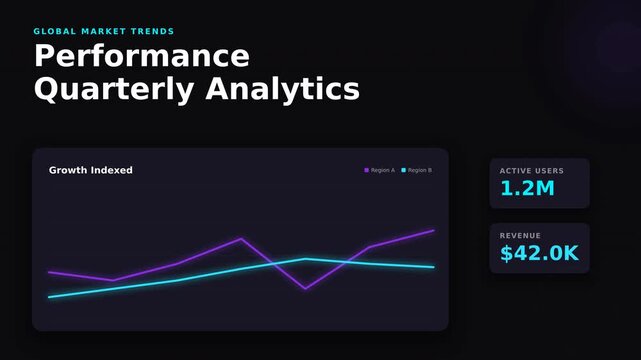
Performance quarterly analytics growth chart dashboard animation
00:10
HD
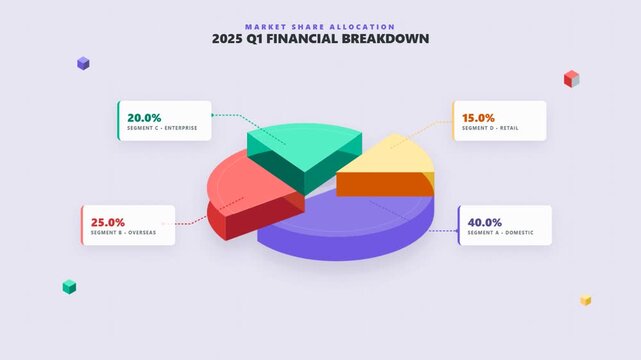
3D isometric pie chart showing quarterly financial breakdown and market
00:10
HD
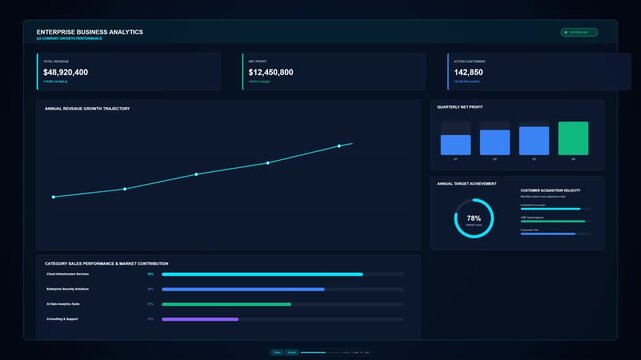
Sophisticated corporate business intelligence and analytics dashboard featuring real-time revenue line growth, quarterly profit performance bars, customer acquisition metrics, sales distribution, and
00:08
HD
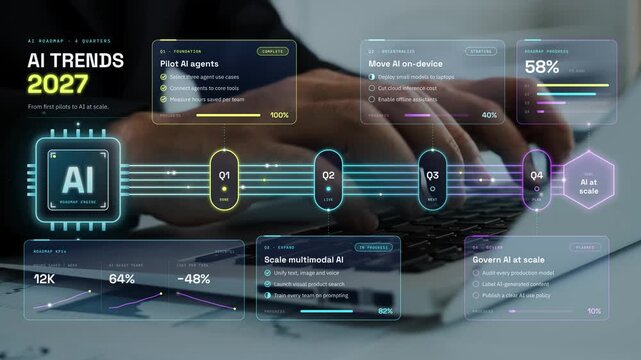
2027 artificial intelligence strategy plan with quarterly milestones to pilot AI agents, scale multimodal AI and govern AI at scale. Foretell.
00:12
HD
Glowing digital financial bar graph displaying quarterly earnings growth and metrics on dark screen
00:08
HD
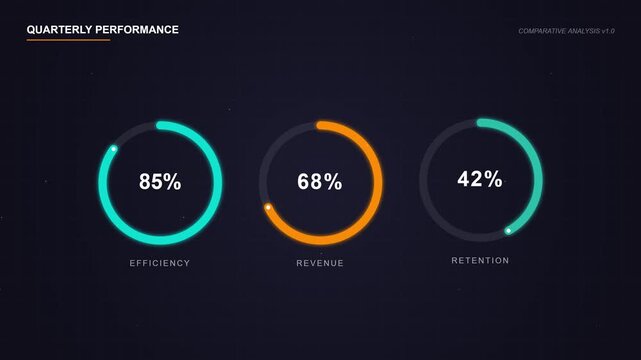
Corporate quarterly performance dashboard showing efficiency revenue and retention metrics.
00:05
HD
Animated business dashboard showing quarterly performance growth
00:10
HD
Generic quarterly performance report bar chart animation
00:05
HD
Laptops displaying modern financial dashboards with revenue charts help professionals analyze quarterly business performance.
00:10
HD
Animated earnings trend dashboard card displaying quarterly financial performance for corporate budgeting
00:08
HD
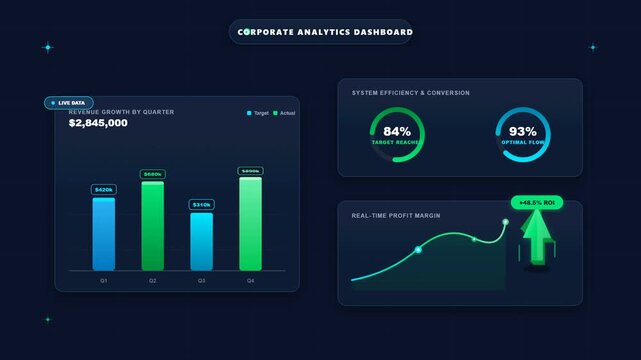
Corporate analytics dashboard showing quarterly revenue growth and profit margin
00:15
HD
Floating financial report studio showcasing quarterly earnings reviews and corporate balance sheets in a 4K loop.
00:08
HD
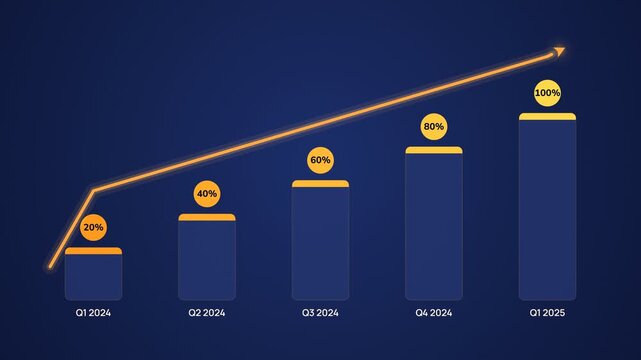
Business growth chart showing increasing quarterly performance from 2024 to 2025 with percentage indicators
00:10
HD
AI document summarization animation, scattered papers pulled into a vortex become a quarterly summary report
00:18
HD
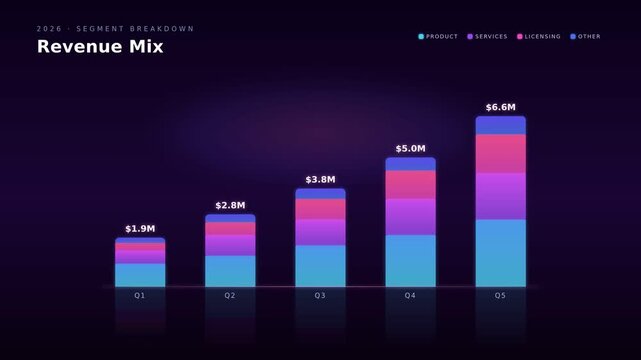
Stacked bar chart demonstrates quarterly revenue mix through segmented colorful blocks reflecting financial growth.
00:05
HD
Retro 80s synthwave animation of quarterly performance text with neon sun
00:08
HD
Businessman reviews quarterly macro-financial paperwork at office desk typing laptop. Corporate budget auditing, investment risk management, commercial tax accounting, economic market research.
00:27
HD
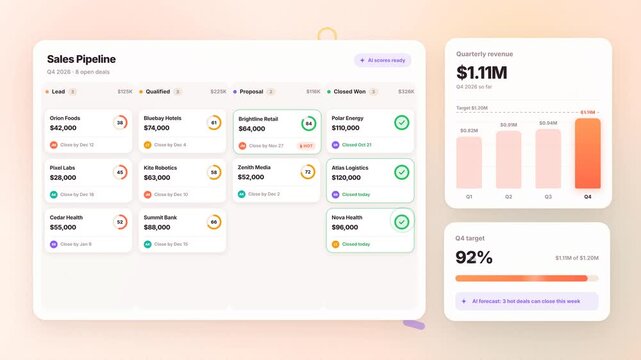
Sales pipeline dashboard displays deal stages, quarterly revenue growth, and a target surpassed on a pastel background
00:10
HD
Executive Reviews Company OKR Dashboard
00:27
HD
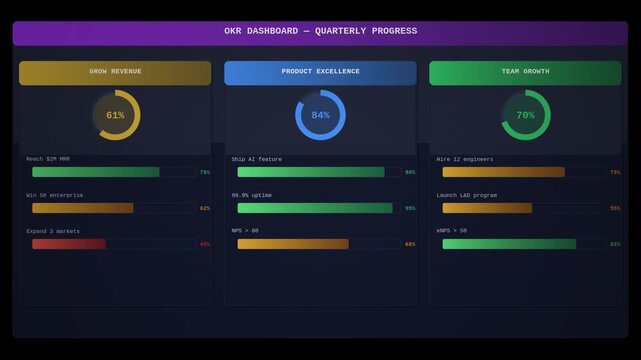
OKR dashboard quarterly progress animation seamless loop. Available with transparent background and alpha channel.
00:12
HD
Digital bar chart showing quarterly and annual performance data
00:06
HD
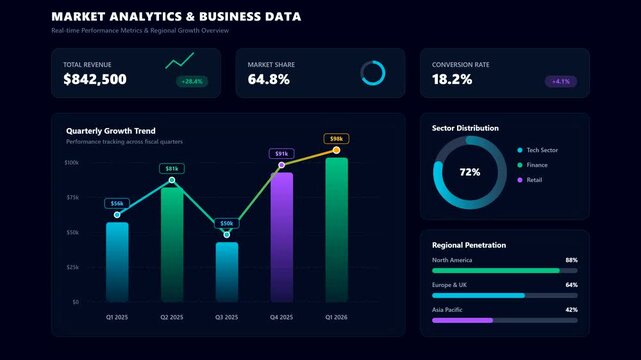
Real-time business analytics dashboard with animated quarterly growth trends and market performance metrics for corporate financial reporting
00:06
HD
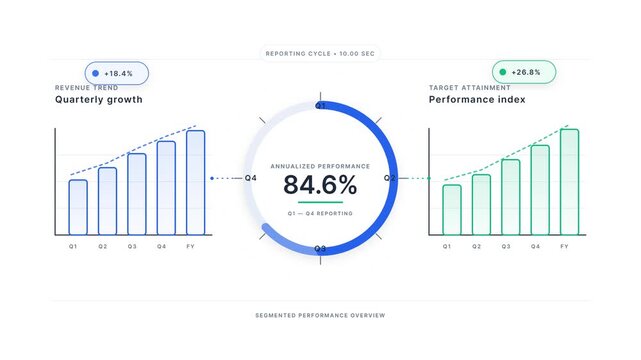
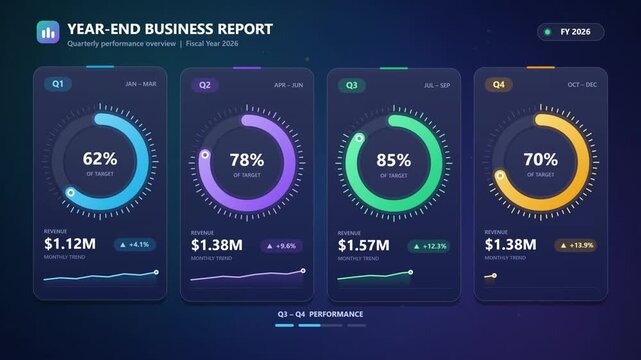
Business growth analytics dashboard animation featuring quarterly revenue trends and performance index charts with increasing data and circular progress indicators.
00:10
HD
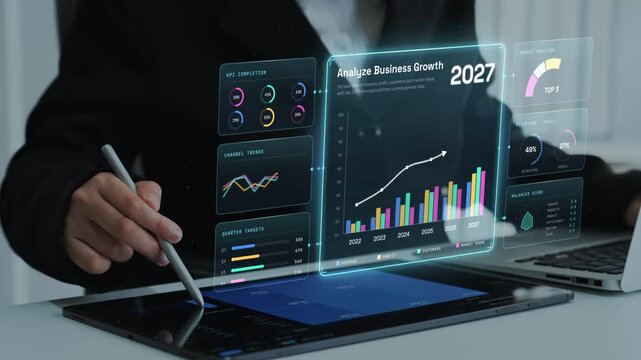
2027 business growth analysis showing rising revenue and profit trend, KPI completion, quarterly targets and market position for strategic planning. Foretell.
00:12
HD
Dynamic horizontal bar chart illustrating quarterly performance growth
00:15
HD
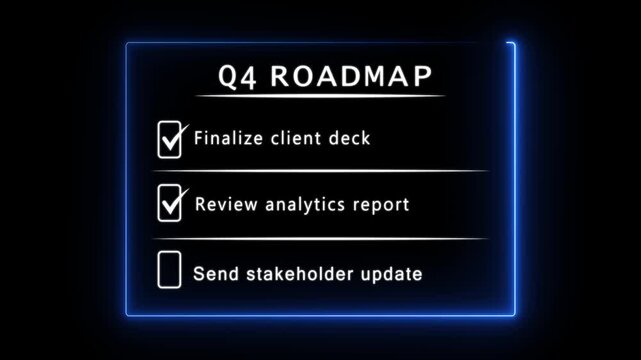
Business project roadmap checklist framed by glowing blue neon lines, displaying quarterly planning task list on dark background.
00:10
HD
Financial data visualization with charts and graphs showing quarterly growth analysis
00:10
HD
Financial dashboard performance interface showing quarterly revenue growth and profit trends in an animated digital motion graphic video clip display
00:05
HD
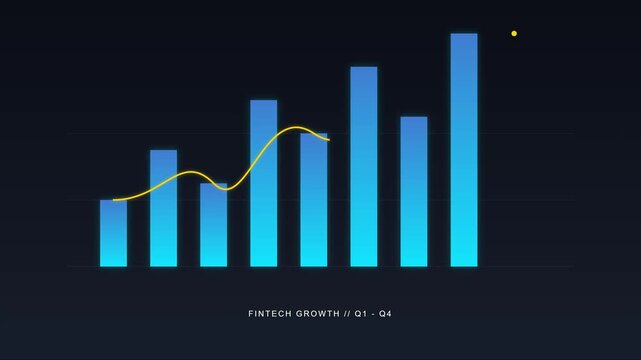
Fintech growth bar chart animation: quarterly financial performance analysis and business success metrics with rising trend line 4k
00:10
HD
Animated quarterly revenue growth executive kpi card tracking business performance on a corporate dashboard
00:08
HD
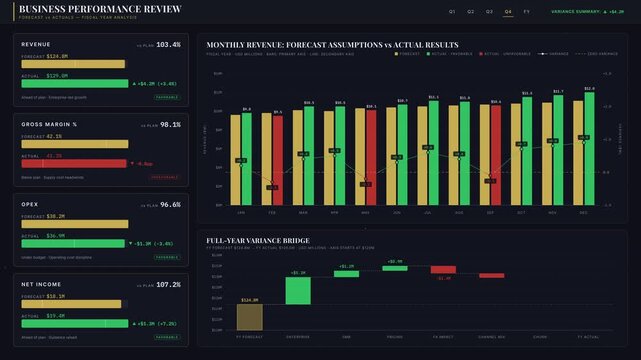
Executive business performance dashboard animation comparing financial forecast assumptions against actual quarterly results with premium dark interface design.
00:15
HD
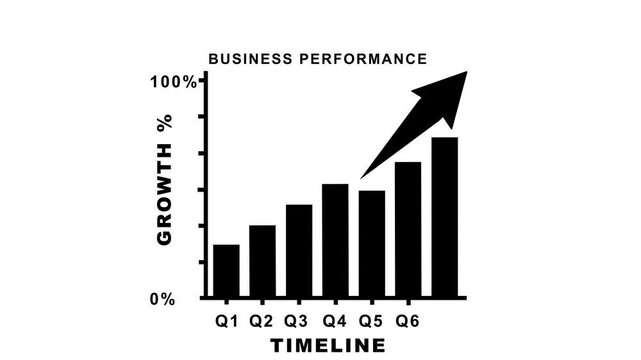
black business performance bar chart with rising upward arrow icon for quarterly growth tracking, sales metrics, revenue progress, financial timeline
00:10
HD
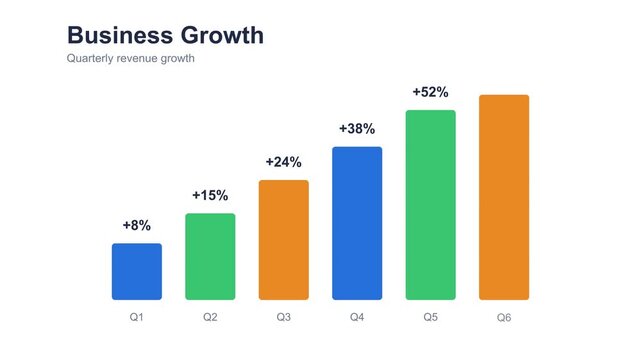
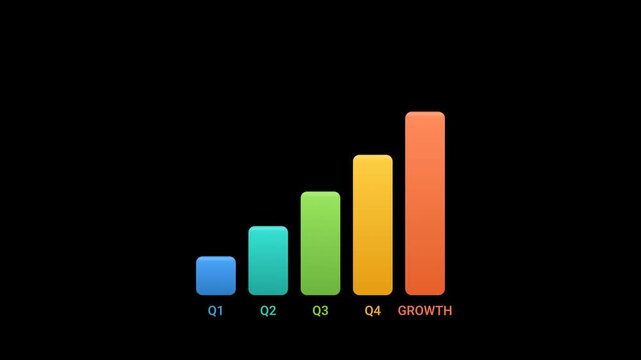
business growth with this clean and professional 2D animated bar chart. This motion graphics video features colorful vertical bars, increasing business statistics, quarterly performance indicators, an
00:10
HD
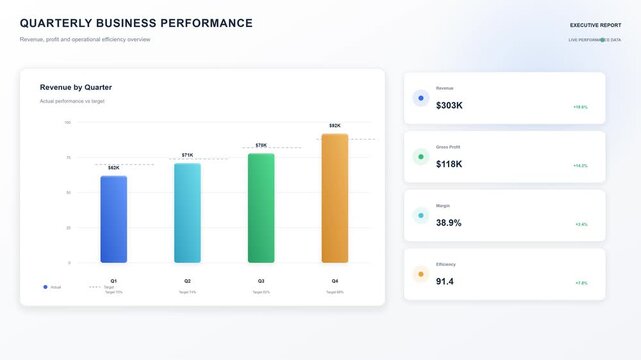
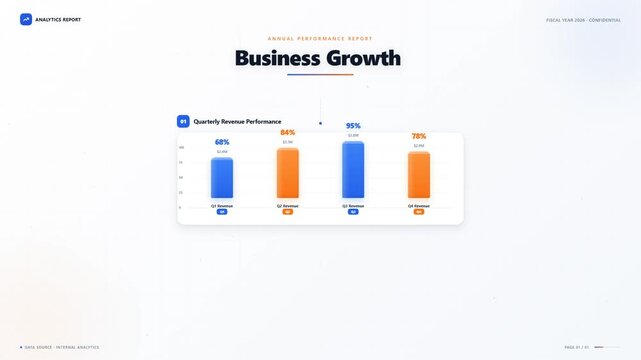
Business growth annual performance report dashboard with quarterly revenue bar chart
00:15
HD
Animated business quarterly growth chart line graph motion animation 4k
00:10
HD
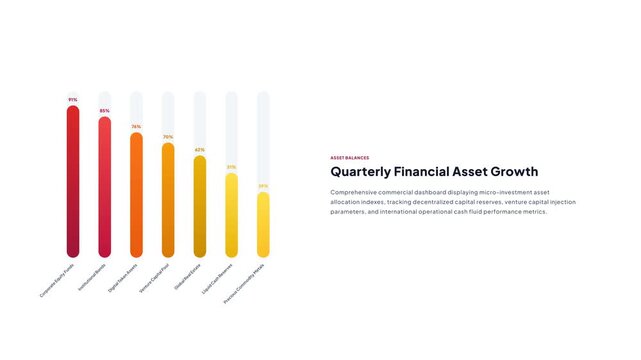
Financial asset growth dashboard with colorful vertical pill charts representing quarterly performance metrics
00:06
HD
Auditor analyzes financial document charts holding pen in office. Corporate accounting audit review, quarterly liquidity assessment, investment risk analysis, business performance report.
00:13
HD
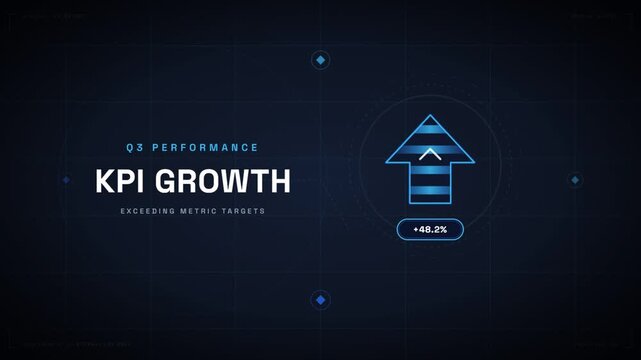
KPI growth digital dashboard showing quarterly performance upward trend
00:10
HD
Financial management interface focusing on corporate quarterly earnings statistics alongside abstract business growth graphics
00:16
HD
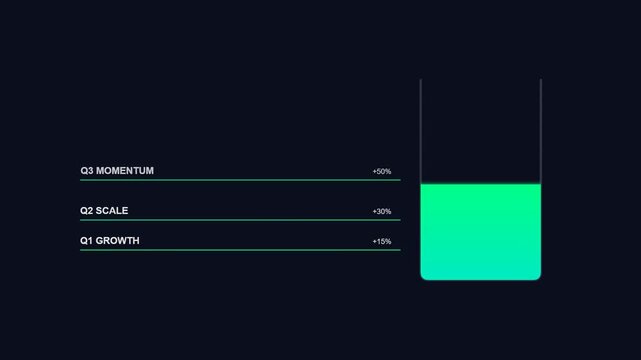
Animated business growth infographic showing quarterly progress from Q1 growth to Q3 momentum with percentage increases and rising green liquid bar chart on a dark background.
00:08
HD
Generic business bar chart showing quarterly performance data animation
00:10
HD
Flat design quarterly review meeting with dashboard and avatars
00:05
HD
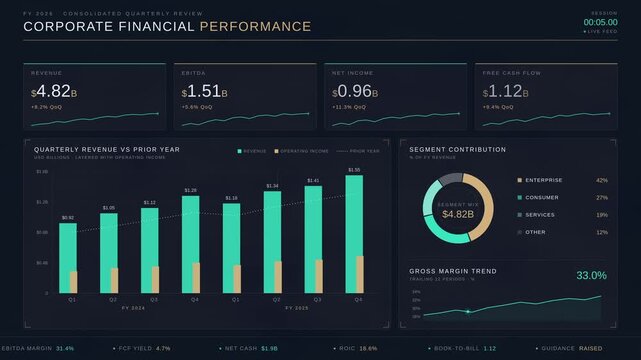
Corporate financial performance dashboard showing revenue and quarterly growth metrics on dark screen
00:15
HD
New year 2027 financial performance with growing bar chart, quarterly progress and target achievement for investment and profit. Foretell.
00:10
HD
Business growth bar chart animation: rising quarterly financial performance and success metrics
00:30
HD
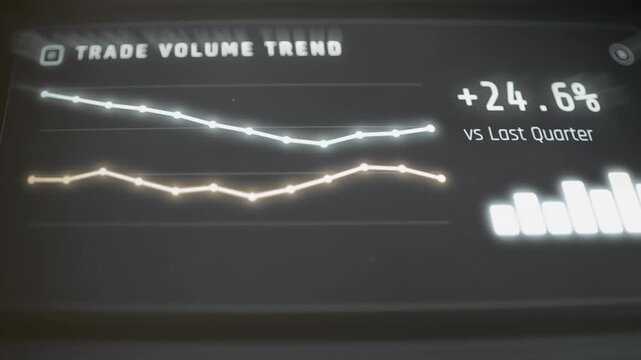
Trade volume trend reveals 24.6 percent quarterly growth
00:11
HD
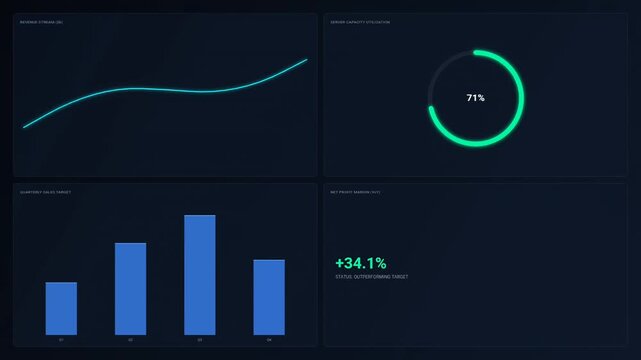
Executive Business Dashboard Grid Looping Animation With Revenue Line Chart Radial Gauge Quarterly Bar Chart And Profit Margin Indicator On Dark Glassmorphism Background For Corporate Analytics
00:05
HD
Business purple quarterly report seamless loop motion background
00:10
HD
Rising financial 3D bar graph and quarterly growth report motion graphic on a dark background
00:10
HD
Animated quarterly revenue growth executive kpi card tracking business performance on a corporate dashboard
00:08
HD
Commercial motion graphics video themed around the New Year 2027 countdown and annual business growth analytics infographic. Includes digital clock animations, quarterly performance bar charts, and mi
00:15
HD
Animated monthly sales bar chart with gradient ui for business data visualization and quarterly revenue growth analysis
00:10
HD
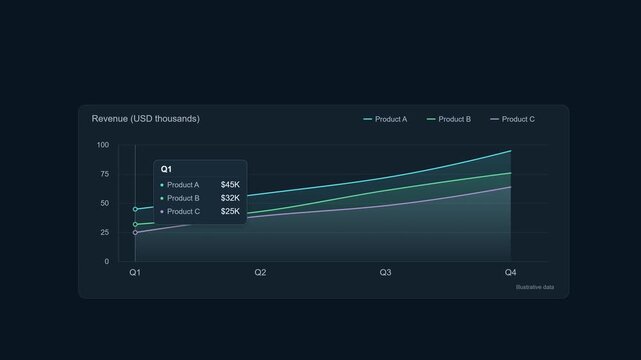
Quarterly Revenue Comparison Area Chart With Animated Data Tooltip 4K dark mode business analytics animation comparing fictional quarterly revenue for three products
00:10
HD
Rising 3D bar chart animation of quarterly revenue growth with dollar signs on white background
00:15
HD
Financial Analytics. Concept of a report on declining sales. Negative financial audits, documentation of quarterly losses, and analytical summaries. 2D animation in 4K resolution, an alpha channel
00:05
HD
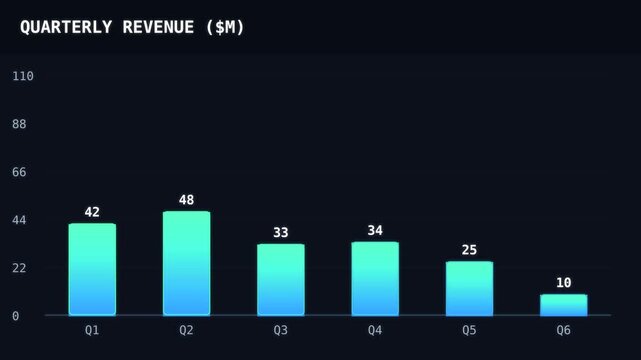
Teal to blue gradient bars growing from zero in a staggered cascade with counting values. Illustrative quarterly revenue chart for business content.
00:10
HD
Sleek digital dashboard with glowing neon line graphs showing quarterly performance analytics, concept for an income tracker and financial growth monitoring, ideal for business presentations and SaaS
00:10
HD
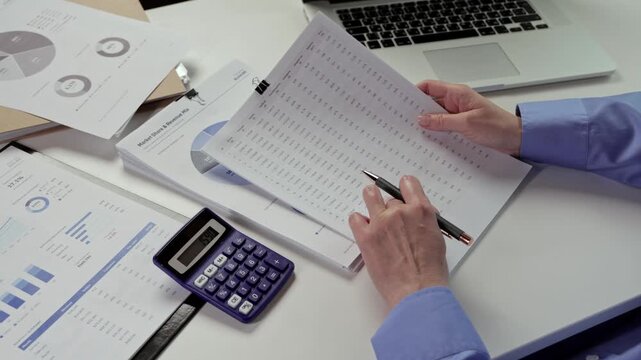
Hands reviewing quarterly reports and calculating results with calculator beside laptop and financial charts in an office, overhead business analysis scene
00:23
HD
Glowing financial analytics dashboard displaying quarterly revenue growth
00:10
HD
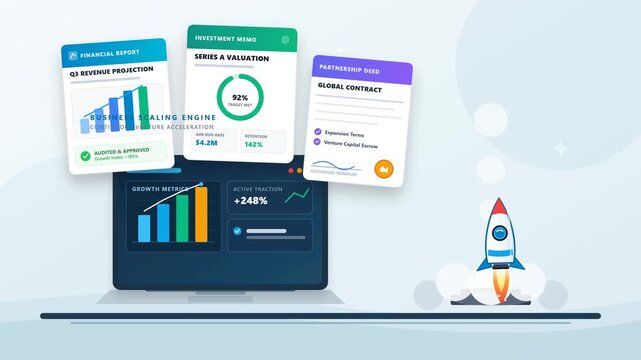
A modern business motion graphic featuring a sleek laptop emitting quarterly financial reports, analytical charts, and investment documents, while a powerful rocket launches dramatically into the sky.
00:10
HD
Generic business bar chart quarterly performance report motion graphic
00:10
HD
Annual business financial dashboard displaying quarterly revenue growth metrics and progress analytics in a modern dark mode data visualization interface
00:10
HD
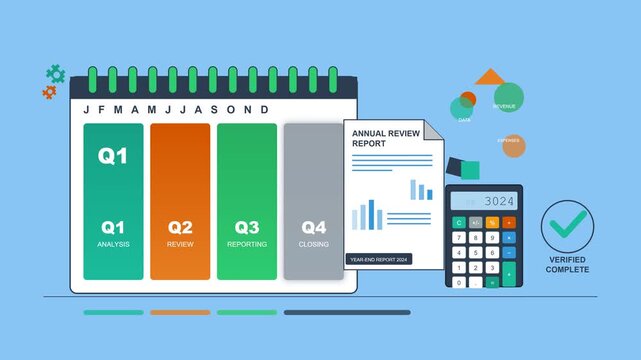
Business annual review report and financial planning illustration showing quarterly cycles from Q1 to Q4 with a calendar, calculator, and verified checkmark for accounting and audit concepts.
00:08
HD
Corporate success 2027 with rising performance index, quarterly growth percentages and upward momentum symbolizing progress, advancement and prosperity. Foretell.
00:12
HD
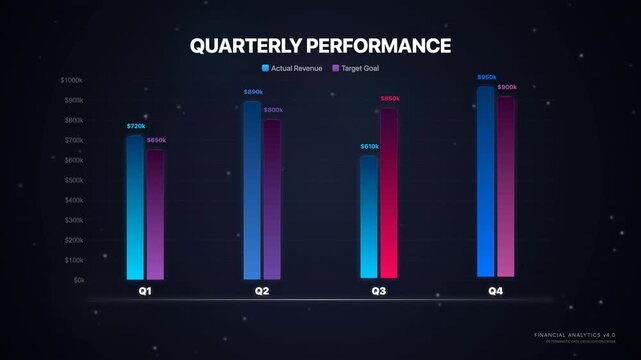
Animated bar chart showing quarterly financial performance with actual revenue vs. target goals, perfect for business reports, marketing analytics and corporate presentations
00:10
HD
Digital quarterly performance graph showing positive growth financial data visualization
00:05
HD
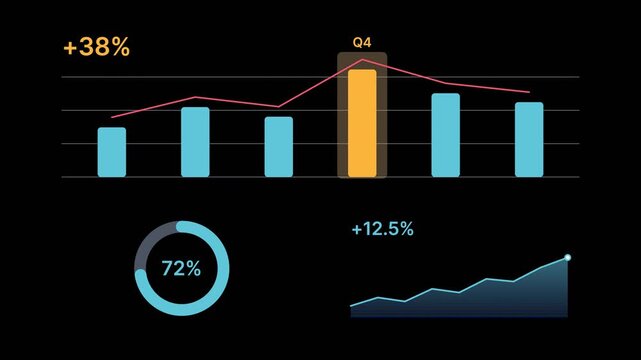
highlight bar slides across a column chart and stops on the best period, plus donut and line chart. For quarterly reports
00:12
HD
Middle aged Caucasian businesswoman presenting quarterly analytics on digital screen to colleagues. Ideal for corporate training, marketing, and leadership projects
00:16
HD
Businessman reviewing quarterly global robotics market report at wooden desk beside calculator tablet computer in office workspace.
00:21
HD
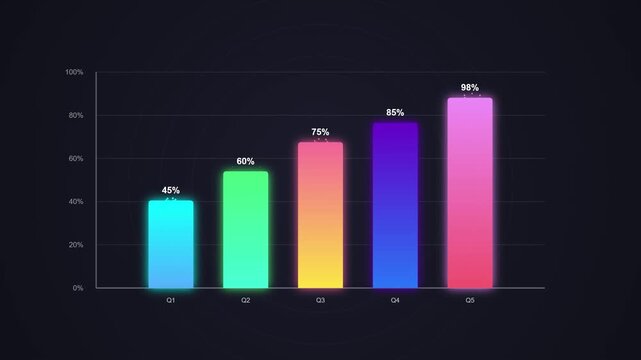
Vibrant bar chart display showcasing business performance growth trends with colorful financial markers for quarterly analysis reports and professional dashboard visual data presentation
00:15
HD
A financial bar chart with a calculator and an orange pen, highlighting business growth, analysis, and quarterly financial planning. Close up.
00:14
HD
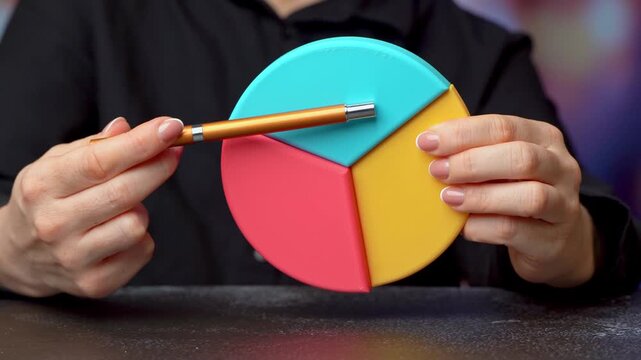
Businesswomen discuss the business pie chart. Summing up the results and financial reporting. Analyzing quarterly data, revenue shares and overall company performance.
00:22
HD
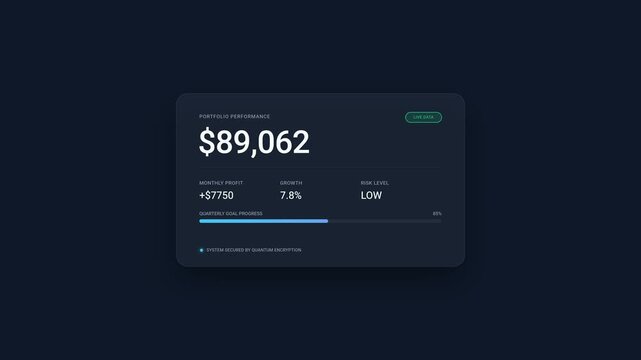
portfolio performance dashboard card widget with monthly profit counter and quarterly goal progress bar
00:10
HD
Business growth presentation scene with animated annual revenue line trajectory and quarterly performance bar charts
00:06
HD
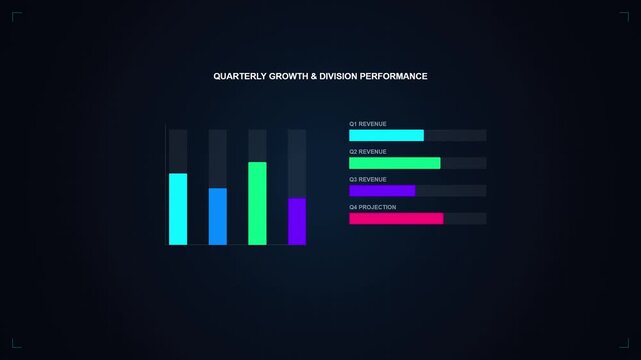
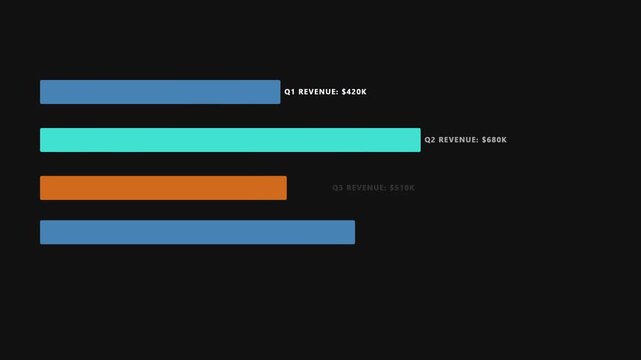
Animated horizontal bar chart displaying quarterly revenue growth from Q1 to Q4 with financial data and dollar values on a dark background for business presentations and corporate reporting.
00:08
HD