A link to set your password has been sent to: To access your purchases in the future you will need a password.
Create without limits — unlimited downloads, plus powerful AI editing
New filters added
Sort by

32,937 results for process mapping in videos

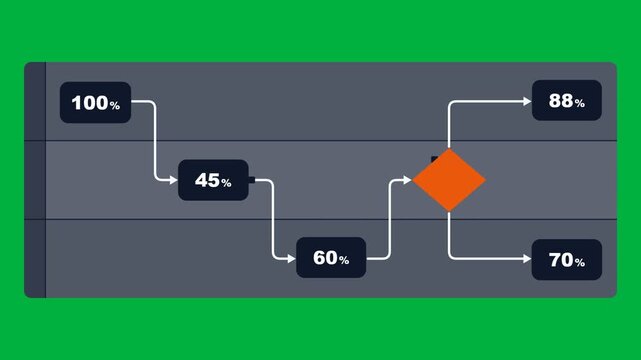
Process optimization across teams in swimlanes on green screen
00:10
HD
Scheme hierarchy management of corporate. Digital technology of business process and workflow automation with flowchart and processing management.
00:12
HD
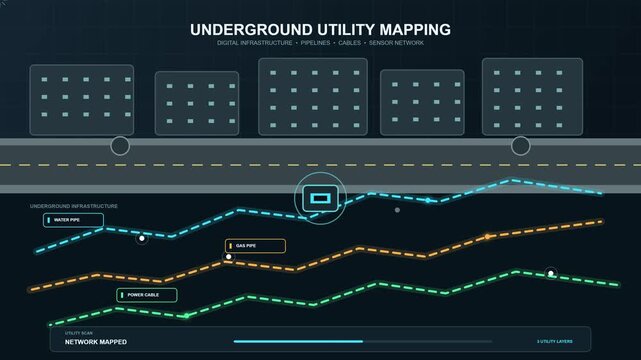
Underground utility mapping interface display showing pipeline network detection process with dynamic digital scanning animation on dark tech background.
00:10
HD
A sleek, minimal 2D vector animation demonstrating an automated site mapping process with a robotic total station positioned on a tripod over open terreno.
00:06
HD
Workflow optimization concept featuring interconnected gears, task management, collaboration, process mapping, review, and automation for business productivity and efficiency Marrow
00:10
HD
Animation of statistical and stock market data processing over world map against blue background
00:15
HD
Animation of technology and business process SAAS with digital interface icons. world map background 4k animation video
00:10
HD
Minimalist graphic animation of growing flowchart nodes
00:15
HD
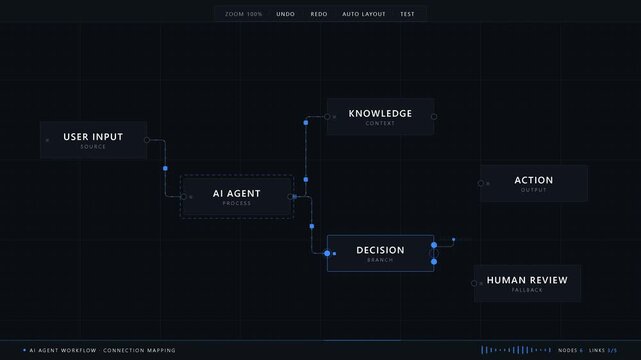
A clean dark-mode no-code workflow canvas illustrating the connection mapping of AI agent modules with animated paths and decision outputs for automation processes.
00:15
HD
Business Analyst Working On Customer Journey Map
00:11
HD
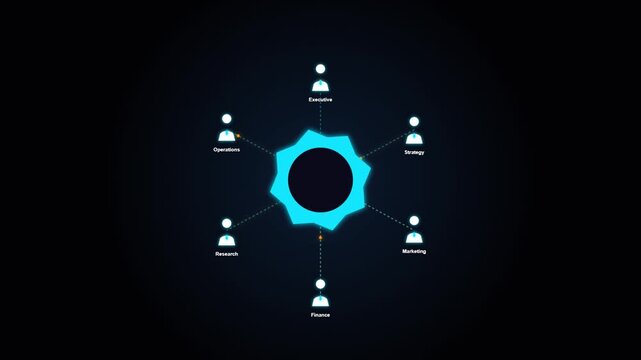
Corporate Organization Chart and Business Management Network Animation Featuring Connected Department Icons and Central Gear Symbol for Professional Collaboration Concept
00:10
HD
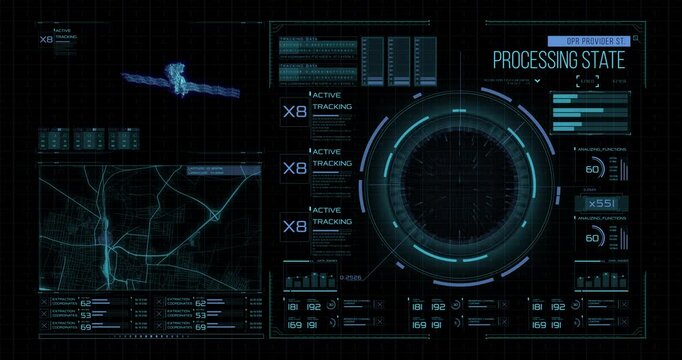
Futuristic tracking interface displays a digital satellite, city map, circular scanner and data processing indicators.
00:15
HD
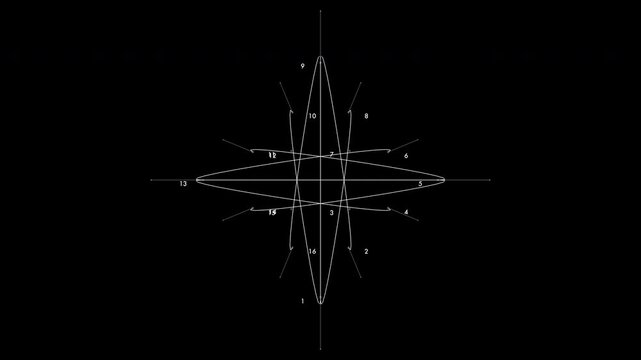
An evolving geometric chart mapping math vectors and numeric intersections along coordinate lines. Tailored for software developer backgrounds and sci-fi movies.
00:20
HD
Business Goal Process Road map To Financial Success Flat Design Animation. Businessman Follows A Strategic Roadmap Through Idea, Planning, Optimization, and Growth Toward A Final Target
00:06
HD
Animated five-step process infographic with colored connector lines on a white background.
00:15
HD
Digital workflow process map with animated data nodes animation
00:12
HD
Glowing cyne Neon Flowchart Diagram Animation on Black Background Business Process Workflow Loop 4K video
00:10
HD
Futuristic digital world map interface with radar scanning and data visualization elements on a dark blue background
00:13
HD
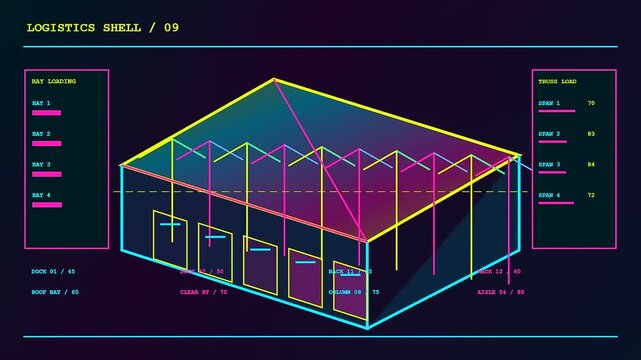
A digital bim modeling interface showing structural warehouse design layouts with glowing isometric lines and changing data metrics over a dark screen in motion graphics
00:06
HD
START Process Flowchart Animation, Connected Workflow Steps and Decision Path on Black Background, 4K video
00:10
HD
Team workflow handoff between departments in violet swimlanes
00:10
HD
Customer journey mapping concept with connected business touchpoints, engagement strategy and digital experience management icons
00:12
HD
Staffing allocation is visually presented through these glowing digital interfaces displaying organized team structures and network data flow nodes on a dark screen monitoring system display
00:06
HD
Feedback Loop process layout surrounded by glowing radial tech symbols and blue light network nodes over an abstract dark world map backdrop.
00:10
HD
A futuristic depiction of a collaborative business diagram displayed on a sleek table, illustrating the connections within a project management framework. Raster
00:20
HD
Global payment map connects cross border services
00:10
HD
Global technology engineering working process with world map
00:20
HD
Mortgage Pre Approval Decision Flowchart. Routing a buyer application through lender credit review
00:08
HD
Animated dotted loop path and moving arrow line on dark and light backgrounds, minimalist motion design element for infographics, maps, and travel concepts."
00:11
HD
Worker Performs Precise Measurement On Machined Component With Advanced Scanning Equipment In Workshop
00:10
HD
Advanced ai agents infographic animation featuring glowing neon icons representing machine learning, software development, neural networks, digital innovation, automation, and strategic business
00:10
HD
Neon flowchart diagram animation, digital process mapping and data logic concept
00:10
HD
Change management network animation with glowing data connections and technology icons, digital transformation strategy and organizational process concept.world map and floating particles background.
00:10
HD
Customer journey map displayed as digital marketing funnel, showing user experience strategy, business management workflow, and buying process cycle
00:10
HD
White flowchart diagram process mapping on alpha channel transparent background. Professional business logic tree and organizational chart. animation
00:10
HD
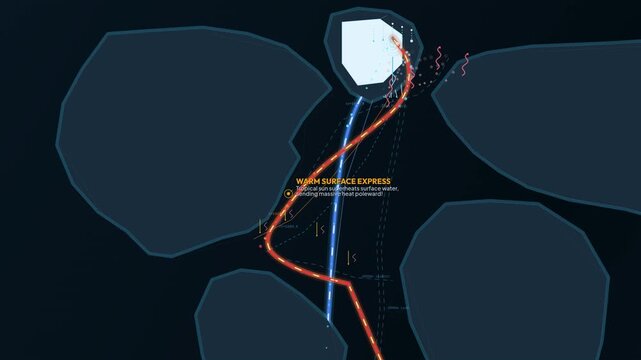
2D animation of the global thermohaline circulation explaining ocean currents, heat transfer, deep water formation, and the climate regulation process across the world map
00:59
HD
Workflow automation and business process mapping idea on the transparent background. Representing workflow automated, process planning, business flow, system optimization. HD video animation
00:10
HD
Explore a sophisticated collaborative AI agent dashboard showcasing inter-agent communication flows, request-response cycles, and detailed task dependency mapping in a sleek interface.
00:15
HD
Digital world mapping lines process binary algorithm calculations over continental vector maps. Computer storage systems use a digital world mapping lines interface track.
00:13
HD
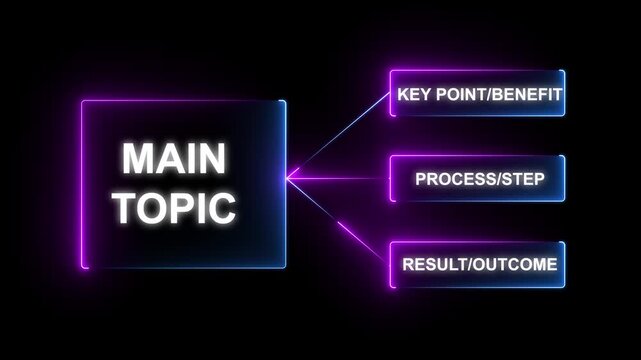
Digital Process Flow Diagram Animation, Main Topic with Connected Workflow and Key Points, 4K video
00:10
HD
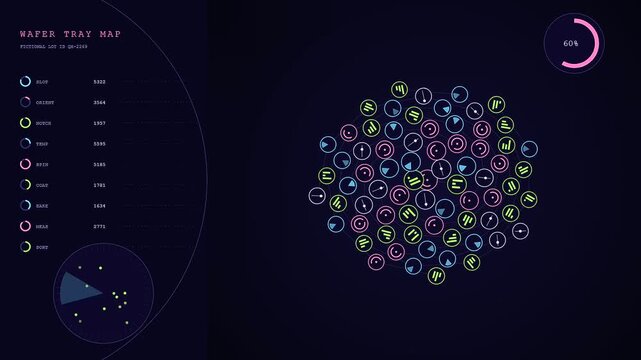
a cleanroom assembly process displayed on a digital interface showing circular tray mapping with glowing nodes that shift and populate in a dark system monitor
00:06
HD
Scheme hierarchy management of corporate. Digital technology of business process and workflow automation with flowchart and processing management.
00:13
HD
Abstract digital illustration of an AI decision flow showing glowing data lines converging into a central HUD target reticle on a dark blue background.
00:10
HD
Digital navigation process providing location guidance, mapping routes, and identifying waypoints on a modern screen for efficient travel and exploration
00:17
HD
Workflow optimization concept featuring interconnected gears, task management, collaboration, process mapping, review, and automation for business productivity and efficiency Marrow
00:10
HD
Semiconductor manufacturing process monitor for EUV lithography with a wafer map
00:11
HD
Business process mapping animation featuring interconnected hexagonal infographic for corporate strategy, digital workflow management, data analysis, and modern organizational planning
00:10
HD
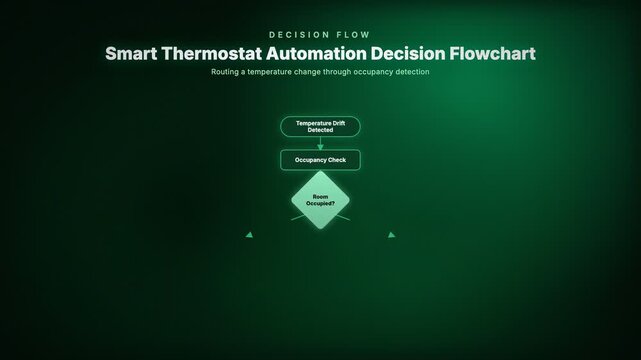
Smart Thermostat Automation Decision Flowchart. Routing a temperature change through occupancy detection
00:08
HD
A fluid token stream flows across dark digital interfaces showcasing complex network nodes connected by glowing lines and shifting waveforms in a cinematic motion graphics sequence
00:06
HD
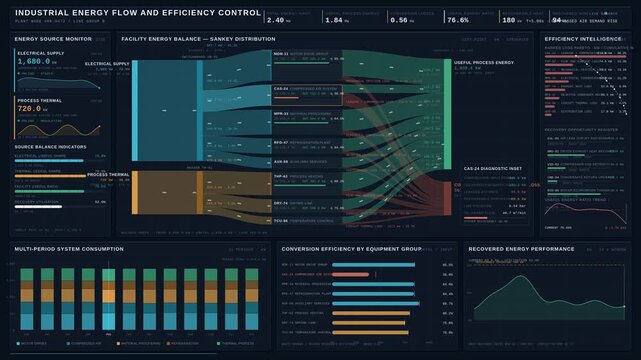
Industrial energy flow dashboard mapping facility consumption, efficiency losses, and recovery opportunities with Sankey diagrams and real-time analytics.
00:15
HD
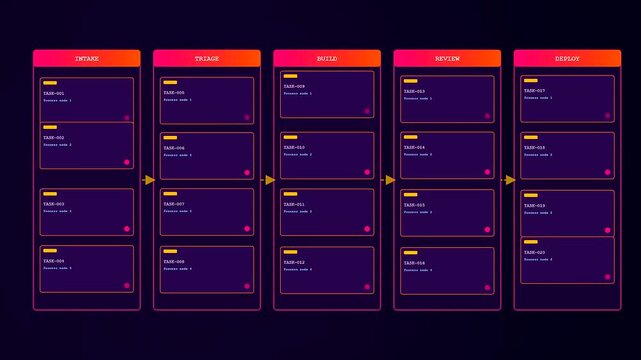
A digital workflow map displaying complex administrative task progression in multiple sections with illuminated rectangular frames and neon glowing accents against a deep dark purple environment
00:06
HD
Glowing neon flowchart diagram animation for business process and data mapping blue
00:10
HD
Enterprise integration dashboard powered by System Flow interface with secure process monitoring and advanced digital technology management concept.world map and floating particles background.4K
00:10
HD
Customer journey mapping and marketing campaign concept, Target audience experience plan symbol, Business growth sales chart, Organization management team.
00:16
HD
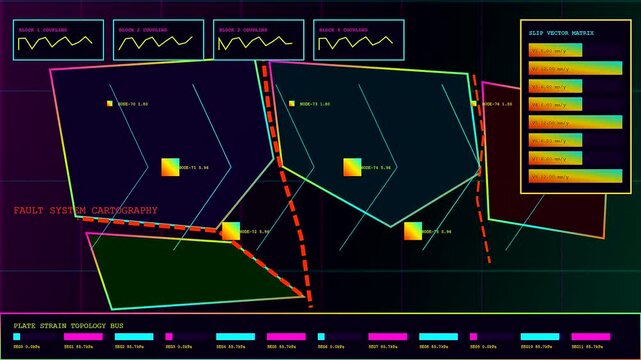
Complex catastrophe mapping systems display animated seismic grid data across a dark digital interface showing fluctuating fault movement metrics and geometric tectonic plate motion patterns in motion
00:06
HD
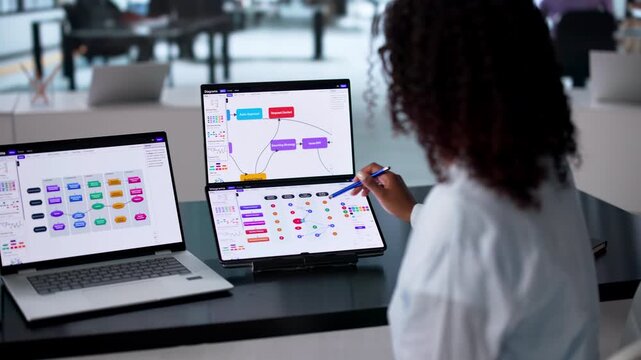
Team members gather around a table to review project models and share ideas in a modern office setting
00:17
HD
Business Analyst Reviews RACI Matrix Diagram
00:21
HD
ETL (Extract, Transform, Load) tool process concept.Extract, Transform, Load, Data, Integration, Pipeline, Cleansing, Mapping, Automation. futuristic grit technology background
00:10
HD
Consolidation Process Diagram Representing Unified Business Systems Structure, Resource Integration, Workflow Efficiency, and Centralized Operational Management Strategy.4k motion graphics video
00:11
HD
Ideation Process Highlighted on Glowing Hexagonal Grid with Futuristic Interface and Soft Golden Lighting
00:10
HD
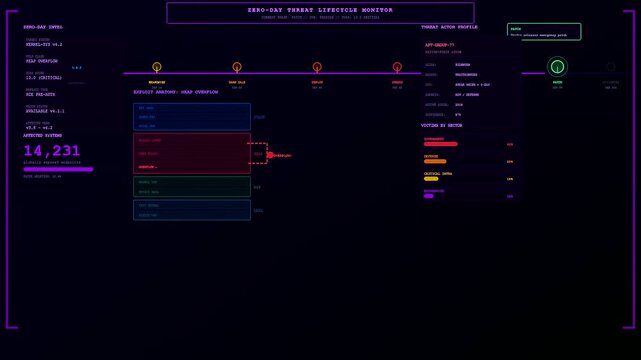
A digital cybersecurity threat map glows with neon purple interface elements displaying global network vulnerabilities and server status updates during a routine software security assessment process
00:06
HD
ai location pin checking and failed process motion graphics animation loop showing map marker scanning and error status indicator.
00:09
HD
Neon Blue Project Management Schedule Planning and Workflow : project Gantt chart, milestone target flag, Kanban board tasks, document folder check, calendar schedule clock, process flowchart
00:10
HD
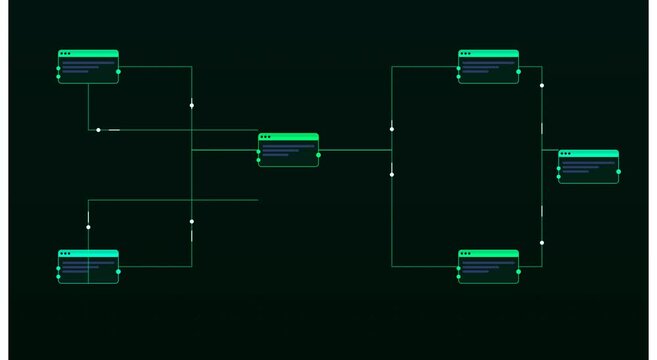
Page mapping process visualizing website structure. Content organization. And user flow with interconnected browser windows. Depicting strategic planning. Analysis
00:17
HD
Top view of business team working together to brainstorm environmental idea by using mind map. Aerial view of smart manager talking and putting hands together or making stack of hand. Alimentation.
00:17
HD
Futuristic neon flowchart diagram with glowing connected blocks and dynamic digital pathways representing system workflow, data processing, and modern black background.Motion animation 4k video
00:10
HD
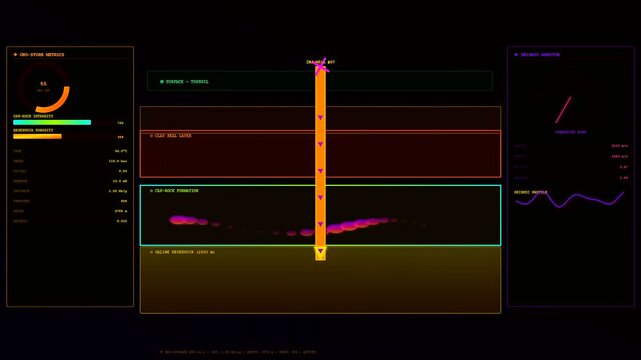
Digital displays showing carbon sequestration processes within underground geological layers while monitoring fluid movement and storage metrics through a dynamic graphical interface of data analysis
00:06
HD
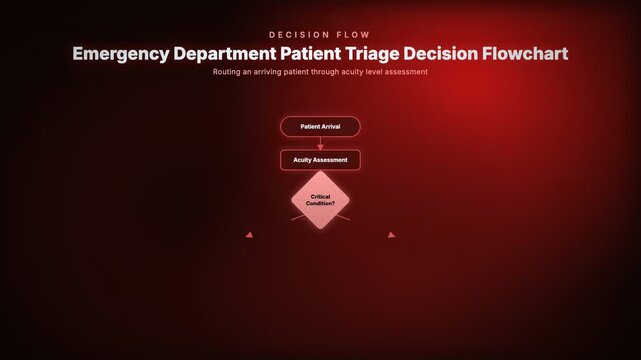
Emergency Department Patient Triage Decision Flowchart. Routing an arriving patient through acuity level assessment
00:08
HD
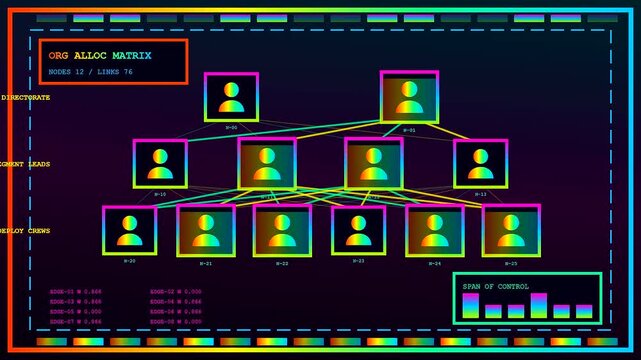
a professional staffing allocation matrix display showing organizational hierarchy structures with multiple connections and node links on a dark digital interface screen inside a server room
00:06
HD
A black node connector with numbered 1 2 3 4 on white, useful for process maps, workflow stages, animated sequence diagrams, and planning visuals.
00:10
HD
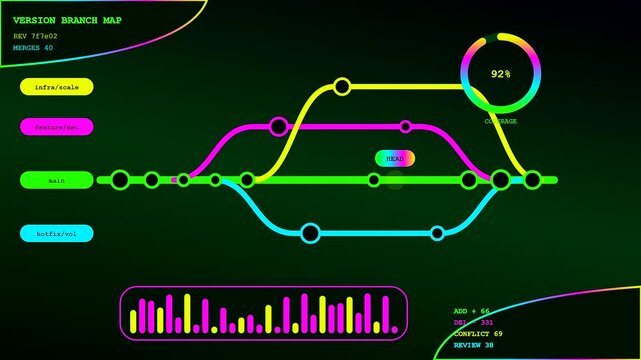
Digital infrastructure code scripting interface displaying branching version control paths with neon colored glowing line graphs and dynamic circular statistics on a dark monitor display
00:06
HD
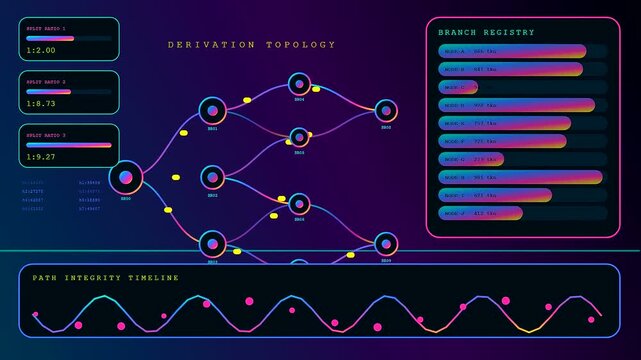
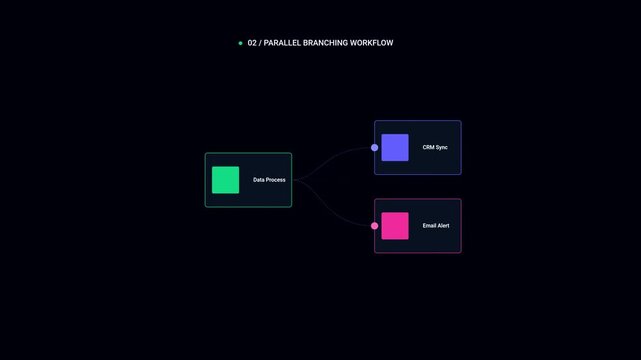
Parallel branching workflow diagram showing software development process and data stream management logic.
00:15
HD
Animation of technology and business process talent
 with digital interface icons. world map background 4k animation video
00:10
HD
Conversion process visual theme with connected glowing radial tech icons and neon blue circuit light rays across a dark world map backdrop.
00:10
HD
A young engineer with a pen at his chin thinks for a beat and then points at the note that answers his colleague's question inside a dimly lit machine learning startup office.
00:10
HD
Neural Network Embedding Model Diagram with Geometric Data Processing Illustration
00:05
HD
Male Specialist Works at a Computer While a Female Analyst Reviews a Tablet, Monitoring Information Flow Overlays That Map Network Traffic, System Status, and Data Center Activity.
00:13
HD
Abstract business automation background representing corporate workflow optimization, process mapping, and efficiency.
00:14
HD
Digital work flow process map with animated visualization motion graphics on transparent background
00:10
HD
Business Analyst Reviews OKR Diagram
00:20
HD
Line icon of a branching flowchart diagram with dashed connecting lines linking multiple rounded nodes representing process flow and decision mapping
00:10
HD
Advanced business discovery process tracking network mapping innovation metrics, ideal for corporate project launch planning and R&D department briefings
00:17
HD
business acceleration concept on virtual screen with business, technology and network icons around technology interface. 4k animation video on world map background.
00:10
HD
System implementing ratio based mapping for data visualization, strategic planning, resource allocation, and process automation with robotic arms handling products on a conveyor
00:17
HD
Business Process Management concept showing workflow analysis, process optimization, team collaboration, automation, and performance improvement Marrow
00:10
HD
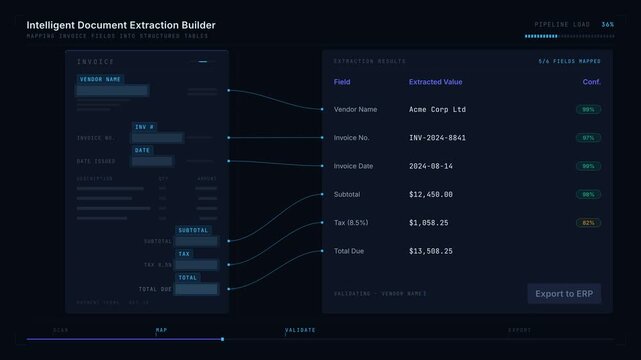
A sophisticated intelligent document extraction process mapping invoice fields into structured tables with animated highlights and data extraction visuals.
00:15
HD
Digital technology of business process and workflow automation with flowchart and processing management.Scheme hierarchy management of corporate.
00:11
HD
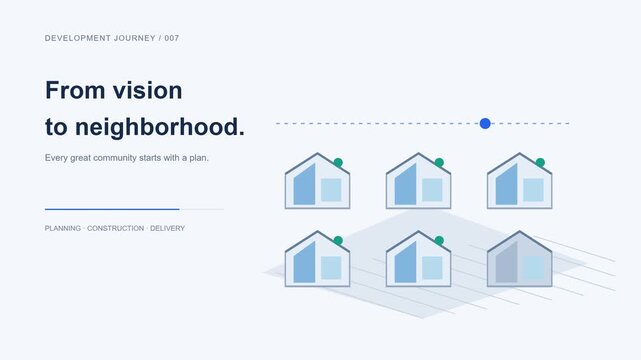
Minimalist animation showing residential neighborhood development process
00:15
HD
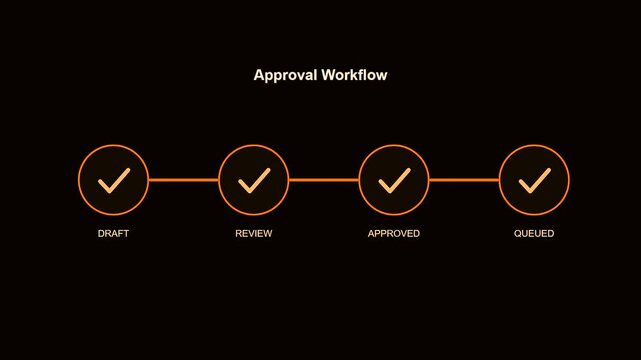
A content scheduler interface visualizes progress bars with glowing orange circular nodes showing distinct workflow steps from draft to queued status in a digital monitoring environment
00:06
HD
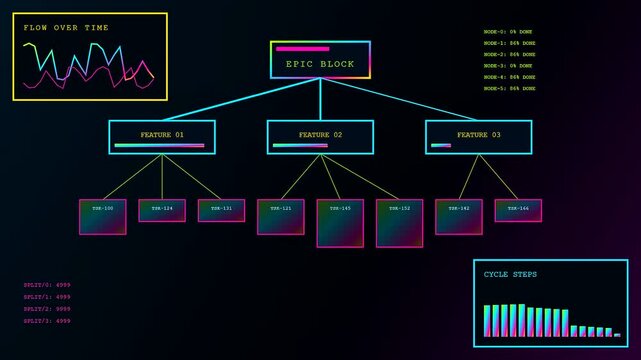
An organized agile backlog display showing task hierarchies and productivity metrics with neon glowing flowchart nodes on a dark interface for modern project management monitoring
00:06
HD
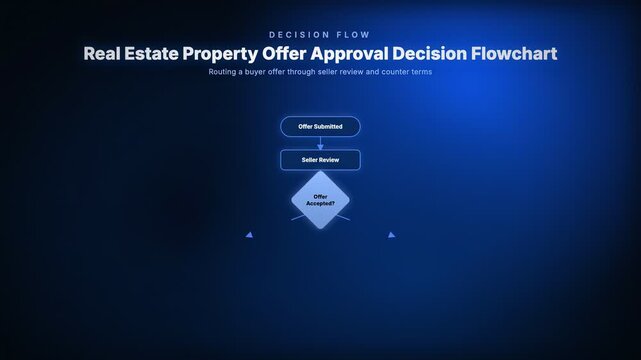
Real Estate Property Offer Approval Decision Flowchart. Routing a buyer offer through seller review and counter terms
00:08
HD
Animation of world map over data processing on black background
00:12
HD
4K animation aerial view of night map with 3d building and destination moving location path with grain processed
00:20
HD
Business hand interacting with virtual flowchart interface process automation visualization workflow design dashboard system integration mapping decision making framework
00:10
HD
Illuminated brain profile depicting neurological sensory mapping, representing cognitive processing and neural connections characteristic of autism spectrum neurodiversity
00:05
HD
A person stands facing a dynamic display of floating papers and lights, suggesting creativity or brainstorming ideas.
00:05
HD
Woman writing and sticking post it in empathy map, user experience design (ux) methodology and technique used as a collaborative tool to gain a deeper insight into their customers, users and clients
00:18
HD
Consolidation Process Diagram Representing Unified Business Systems Structure, Resource Integration, Workflow Efficiency, and Centralized Operational Management Strategy.
00:12
HD
Optimization Software Technology Process System Business concept. operations to achieve the best possible performance, efficiency, or outcomes using data, analysis, and continuous refinement.
00:10
HD
Workflow automation, process planning, system optimization, business process mapping concept. Businessman using flowchart interface on virtual screen. 4K 3D video animation
00:12
HD