A link to set your password has been sent to: To access your purchases in the future you will need a password.
Create without limits — unlimited downloads, plus powerful AI editing
New filters added
Sort by

3,131 results for physics chart in videos

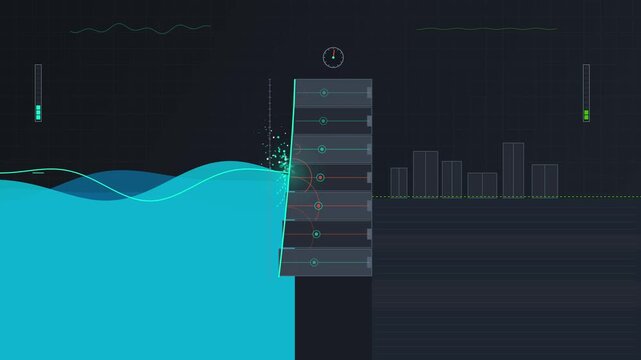
Animated scientific simulation of fluid wave pressure on a barrier wall
00:08
HD
Red Neon Sine Wave Oscillation Animation
00:10
HD
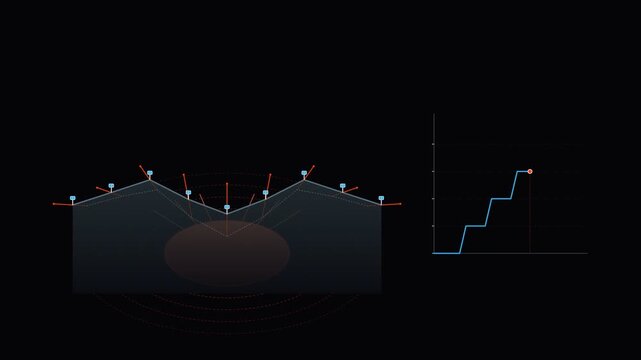
Technical diagram showing structural mechanics and wave propagation with step chart
00:08
HD
Stem lollipop chart animation loop
00:10
HD
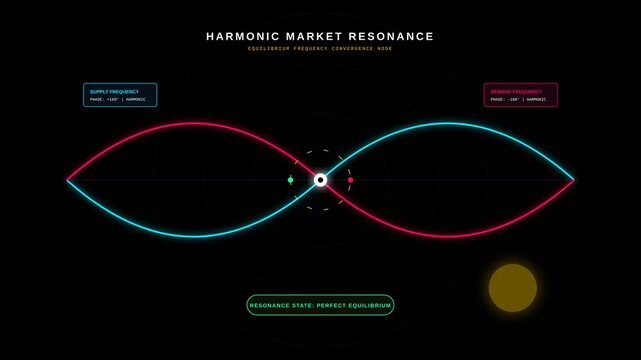
Harmonic Market Resonance Animation Showing Economic Equilibrium Frequency and Supply Demand Waves
00:10
HD
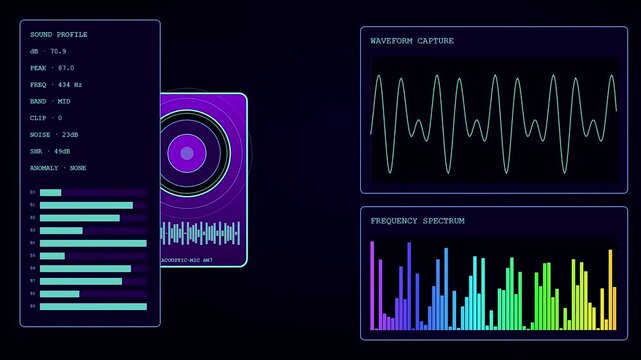
Digital factory sensor monitoring interface screens display oscillating sound wave patterns and multicolored frequency spectrum bar charts for advanced acoustic data analysis in a dark environment
00:06
HD
thin white line cross with narrow arrows similar to a compass points or x and y axis blank empty graph grid chart animated intro and outro 4K animation graphic
01:00
HD
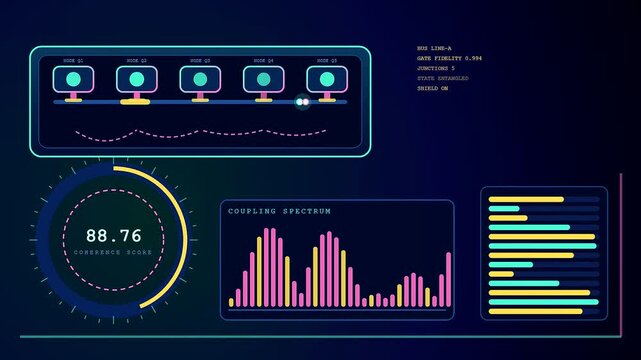
A digital display showcasing electron tunneling simulation within a complex interface showing fluctuating coherence scores and graphical data bars moving across dark blue panels of light
00:06
HD
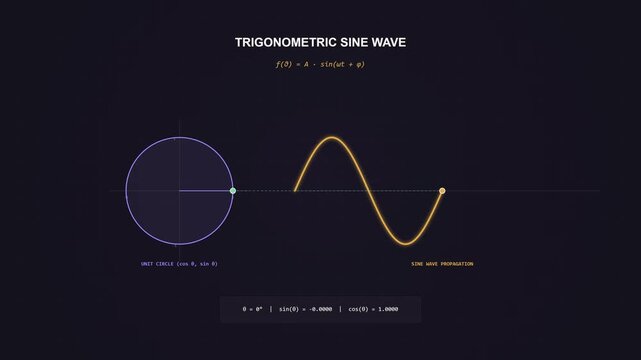
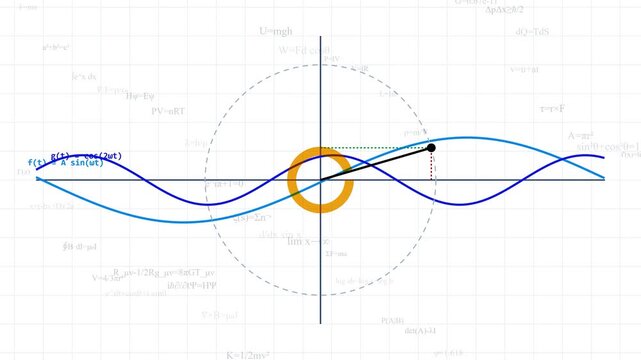
Educational animation showing trigonometric sine wave propagation from a unit circle with mathematical formula and angle calculations
00:10
HD
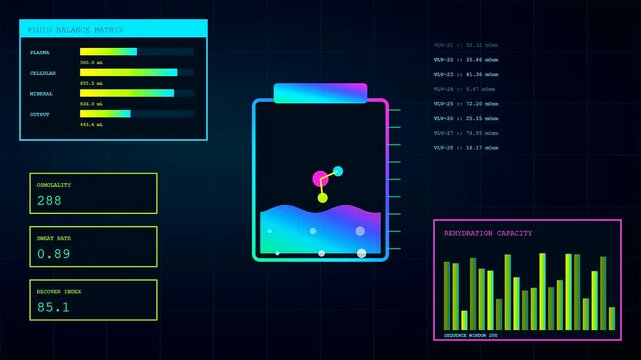
Monitoring recovery analytics on a vibrant digital display showing health metrics in three stages with glowing neon fluid levels and shifting charts for biological data
00:06
HD
Abstract Animated Curved blue Line Wave on Black Background Seamless Loop
00:10
HD
Newton's cradle with coin, house, safe, chart and shield swinging, chain reaction and financial risk concept, animation
00:08
HD
Sketch physics infographic icon animation - smooth progressive reveal
00:08
HD
Digital science animation, technology data analysis, network science, biotechnology structure, chemistry symbols, innovation graph
00:06
HD
Digital medical interface tracking patient rehabilitation progress and physical therapy data on futuristic HUD.
00:14
HD
Futuristic digital communication tower emitting radio waves amidst abstract glowing data charts
00:15
HD
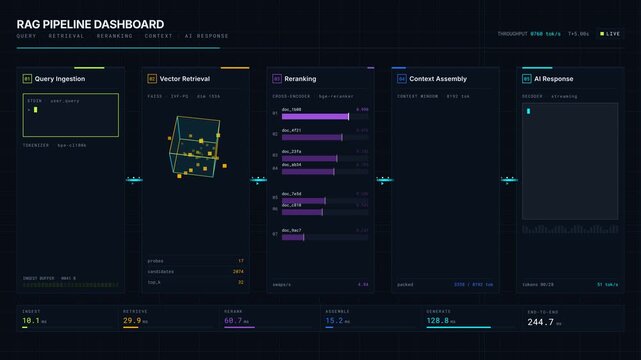
Explore a 4K dark mode RAG Pipeline Dashboard showcasing Query Retrieval, Reranking Context, and AI Response with animated neon visuals and dynamic data representation.
00:15
HD
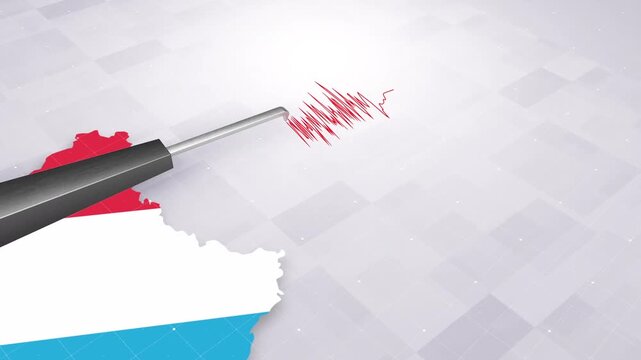
Luxembourg Earthquake Concept With Seismograph And Map
00:20
HD
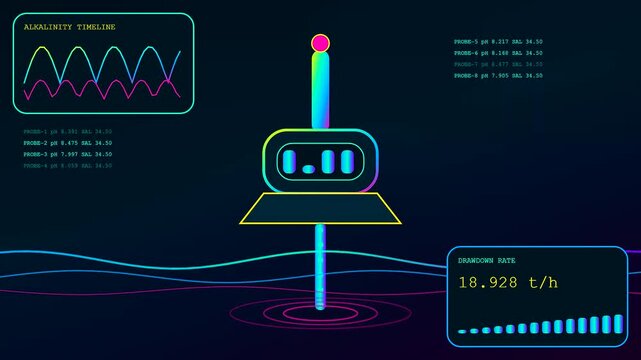
Industrial ocean carbon capture monitoring system showing real time fluid analysis waveforms and dynamic data processing metrics on a dark digital holographic screen display interface
00:06
HD
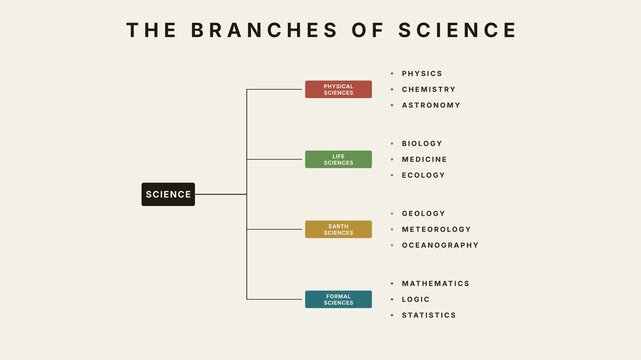
The branches of science infographic tree chart animation showing physical, life, earth, and formal sciences
00:12
HD
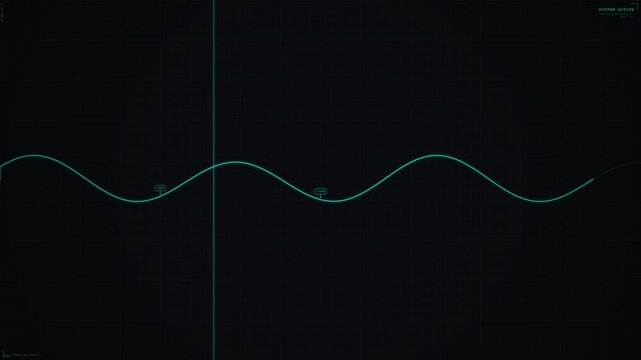
Green Sine Wave Oscillating on Black Screen
00:15
HD
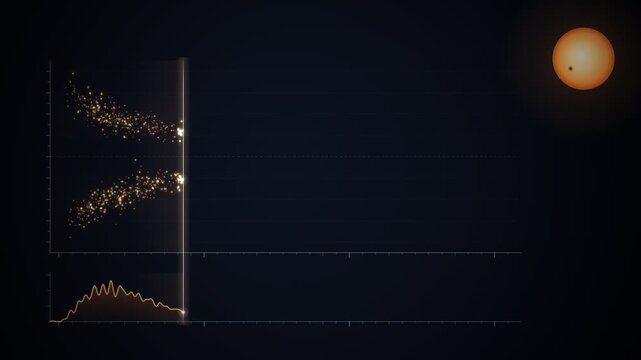
Sunspot Cycle Butterfly Diagram Solar Activity Chart Build Animation
00:15
HD
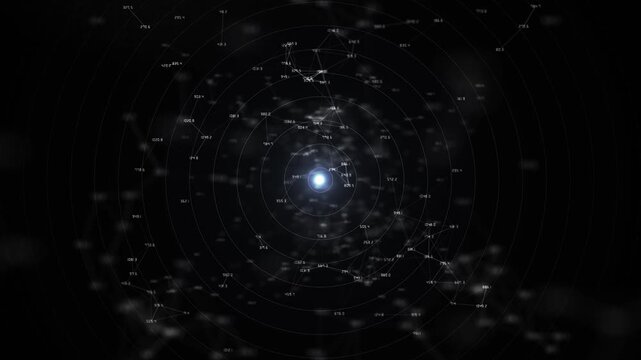
Circular interface telemetry, measurements, values, spatial points luminous center. Useful for simulations, diagnostics, quantum research, astronomy, monitoring, calculations, advanced data analysis.
00:20
HD
Abstract electric arc surge and glowing constellation network on dark blue background representing digital connections in deep space
00:12
HD
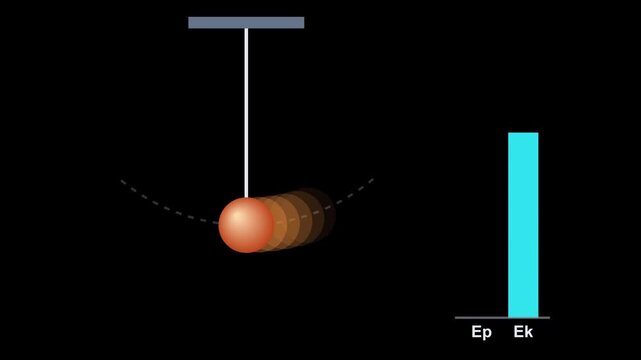
Pendulum movement illustration demonstrating energy conversion between potential and kinetic states with a dynamic bar chart for physics education
00:08
HD
Volumetric diagnostics display flickering on screen showing glowing neon spheres with oscillating waveforms and rhythmic bar charts animating in a continuous loop for medical data visualization
00:06
HD
Human Foot Reflexology Nerve Points Anatomy Medical Visualization
00:06
HD
A digital virtual lab interface showing chemical reaction data with liquid filled flasks and animated charts flowing across three distinct panels in a dark room
00:06
HD
Digital Forensics Interface Showing Ballistic Trajectory Reconstruction and Analytical Data Analysis
00:10
HD
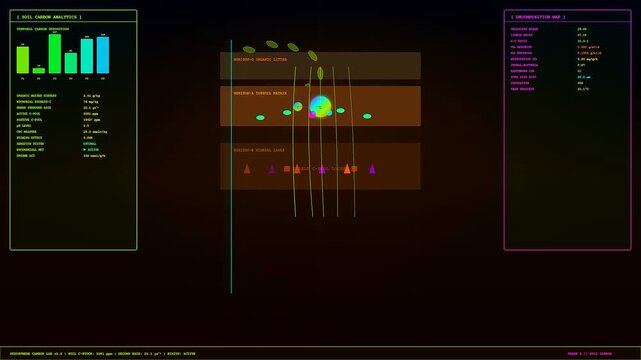
Digital displays showing carbon sequestration data with glowing charts and soil composition graphics for ecological monitoring and climate research studies in a dark laboratory setting
00:06
HD
Abstract background featuring multiple overlapping sine wave patterns on a dark background.
00:20
HD
Blue Sine Wave Oscilloscope Animation
00:15
HD
A visual representation of a sine wave depicted through vertical line bars
00:10
HD
Futuristic glowing golden line chart showing growth on black background, digital business financial success trend concept
00:08
HD
Digital recovery analytics interface displaying spinal health status and biometric data points inside a dark virtual environment with vibrant glowing neon charts and graphical information bars
00:06
HD
Educational doodle sketch notebook background hand drawing science icons math physics study template animation creative
00:15
HD
Futuristic digital HUD telemetry interface with abstract audio waveforms, sound waves, and tech data visualization chart
00:15
HD
the biometric validate system monitors human skeletal motion on a digital screen featuring glowing colorful line wave charts and geometric node patterns for analysis
00:06
HD
Scientific illustration of wave propagation and vector analysis around a central point, depicting principles of motion, frequency, and oscillation in an abstract diagram for research
00:30
HD
Industrial carbon capture digital interface display showing fluid liquefaction vessel pressure monitoring with data charts and graphs in a dark laboratory setting for scientific observation
00:06
HD
Stepped milestone bar progress chart loop
00:10
HD
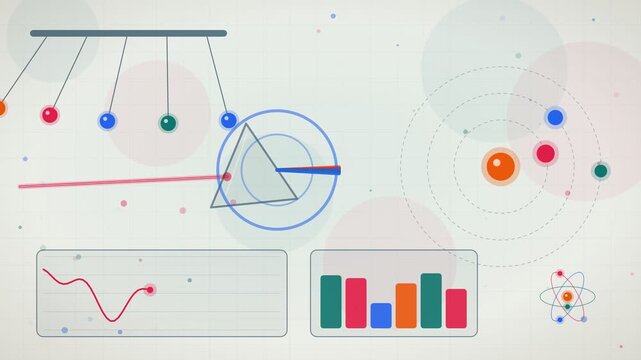
Educational Physics Infographics Animation Featuring Newton's Cradle, Prism Light Dispersion, and Scientific Data Charts on a Light Background
00:10
HD
Glowing blue wave line moving on dark grid background, abstract digital signal, sound waveform, data analytics, technology chart, futuristic interface and cyber motion video
00:08
HD
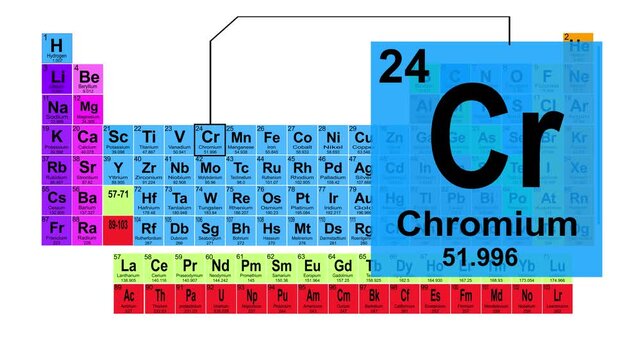
Periodic Table 24 Chromium Element Sign With Position, Atomic Number And Weight.
00:15
HD
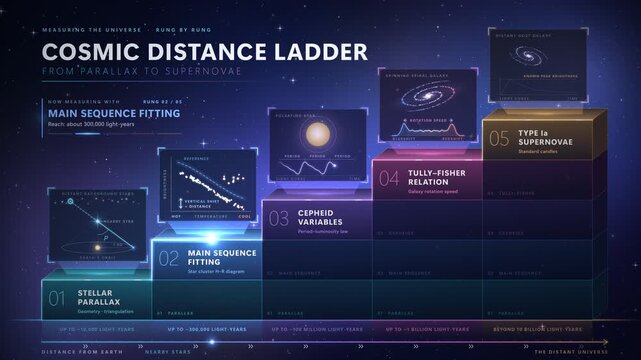
Cosmic Distance Ladder Infographic Animation Explaining Astronomical Measuring Methods
00:15
HD
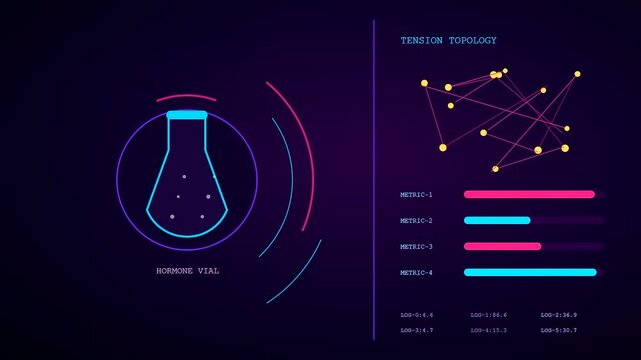
a clinical stress assessment visualized through an animated laboratory beaker icon displaying fluctuating digital data streams and changing bar charts on a glowing deep purple display
00:06
HD
A colorful, oscillating sine wave transitions from blue to green and yellow across a dark background, illustrating sound, frequency, or data signals.
00:05
HD
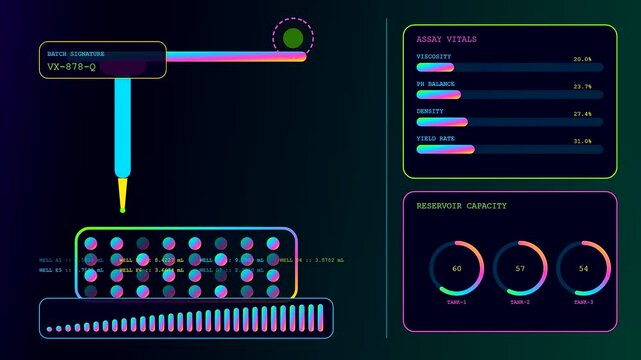
A digital virtual lab interface displays fluid chemical analysis process on a dark screen with vibrant neon bar charts and circular data panels in motion
00:06
HD
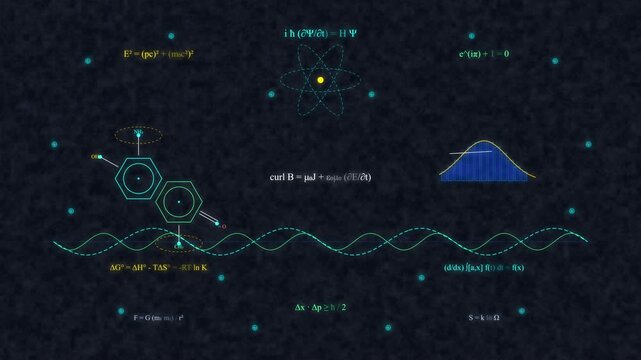
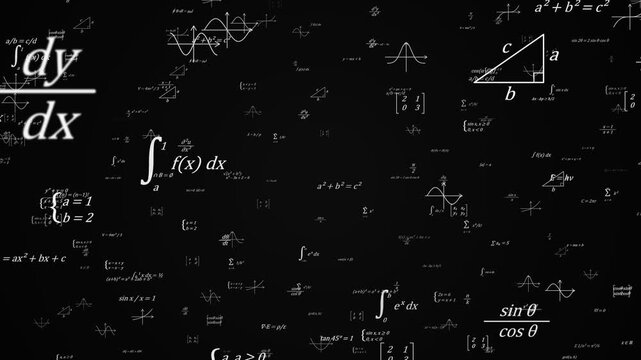
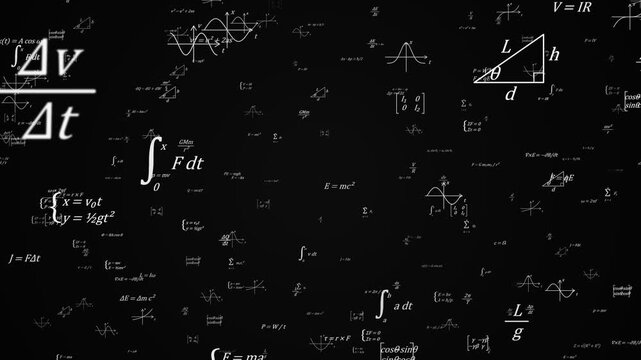
Math formulas, equations and graphs flying toward the camera and passing by on a black background, seamless loop education animation
00:24
HD
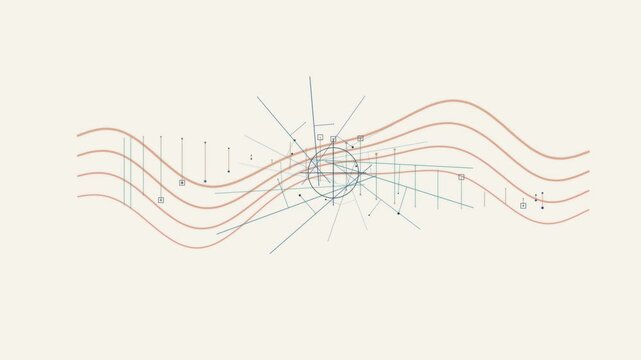
Abstract mathematical wave function diagram with geometric intersecting lines and data points line point science physics equation line point science physics equation
00:10
HD
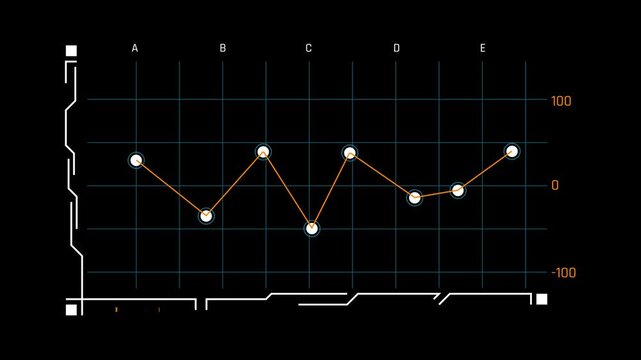
Futuristic Sci-Fi HUD Line Graph with Orange Scale and Coordinate Grid on Black Background
00:20
HD
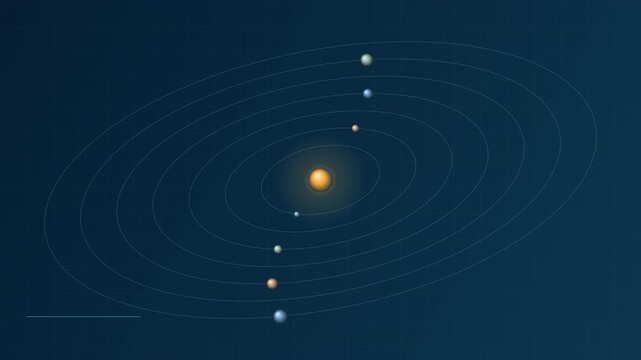
Planetary orbits around a central sun in a stylized solar system diagram on dark background
00:12
HD
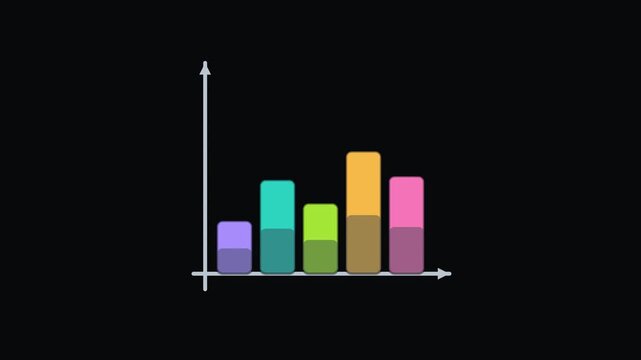
Bar chart growing - Physics, Chemistry and Maths Classroom Teaching Diagrams
00:08
HD
Abstract scientific simulation showing particle physics experiment with glowing energy levels
00:08
HD
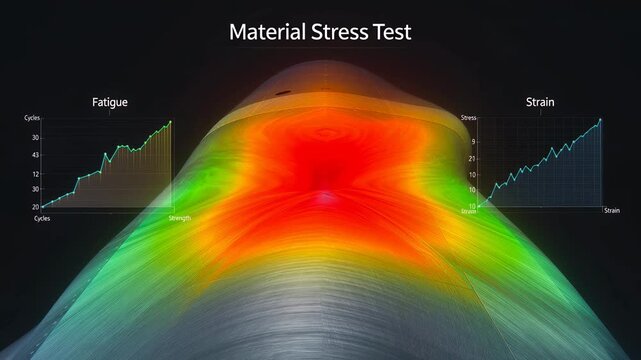
Material stress test visualization showing heat map analysis of metal
00:10
HD
Aerodynamic wind tunnel simulation showing airflow over an airfoil
00:10
HD
Blue glowing wave graph forming on a dark digital background
00:06
HD
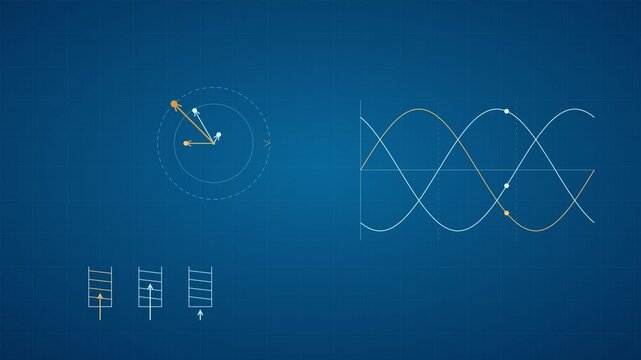
Three Phase AC Power Sine Wave Physics Chart
00:08
HD
Futuristic financial market analysis graph showing stock exchange data trends and growth statistics
00:05
HD
Abstract neural network digital background with glowing connections and nodes
00:05
HD
Dynamic blue abstract background featuring smooth flowing waves with glossy reflections and modern design
00:05
HD
A digital conversion funnel display presents changing line graphs and colorful bar charts on a dark screen featuring shifting numerical data in a neon interface
00:06
HD
Reaction Energy Diagram Showing Catalyst Lowering Activation Barrier Seamless Loop
00:15
HD
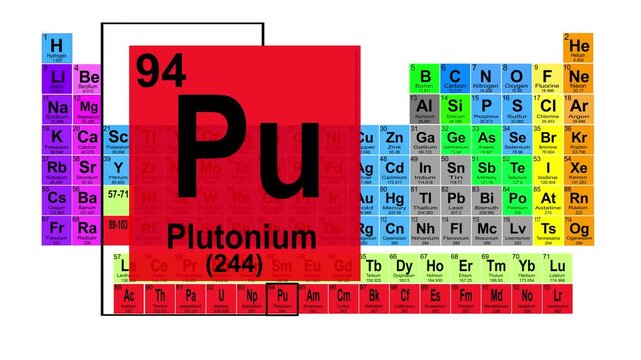
Periodic Table 94 Plutonium Element Sign With Position, Atomic Number And Weight.
00:15
HD
Minimalist Red Seismograph Waveform Polygraph Line Animation Motion Graphics Loop
00:08
HD
Quantum cryptography data processing shown through glowing animated bar charts and circular network nodes with blue neon digital interface elements evolving on a dark screen display
00:06
HD
Abstract Glowing Teal Wavy Line Chart with Tracking Dot Loop Animation Background
00:15
HD
Digital displays in a virtual lab showing glowing dna helix structures with oscillating wave patterns and circle charts floating in dark environment with vibrant neon light
00:06
HD
Deep Sea Trench Vertical Profile Scanner Interface with Hydrostatic Pressure Telemetry Data Monitor
00:10
HD
Physics formulas and equations flying toward the camera and passing by on a black background, mechanics, energy, electricity and relativity, seamless loop science education animation
00:24
HD
Futuristic technological concept featuring a glowing abstract spacecraft navigating through a digital financial candlestick chart against a deep dark background
00:08
HD
Glowing Blue Line Chart Showing Upward Financial Trend Loop
00:10
HD
Abstract Digital Blue Neon Curve Graph on Dark Grid Background Representing Data Visualization and Technical Analysis of Waveform Motion Render
00:10
HD
Vector Field Mathematical Visualization with Glowing Cyan Directional Arrows on Coordinate Grid for AI Data Flow, Physics Simulation and Big Data Computing Background
00:18
HD
Oscilloscope wave signal monitor testing animation
00:15
HD
Digital interface displaying scientific plasma physics wave lines and data graphs
00:08
HD
Blue digital frequency waves oscillating in multiple hud interface panels
00:10
HD
Pie chart animation on black background. Pie chart digital financial data segment. Pie chart business statistics visualization graphic for annual reports.
00:06
HD
Clean 4K textless animated radial gauge progress breakdown chart featuring concentric multi-colored ring arcs with smooth spring physics, glowing circle tip markers, rotating telemetry laser sweep, an
00:12
HD
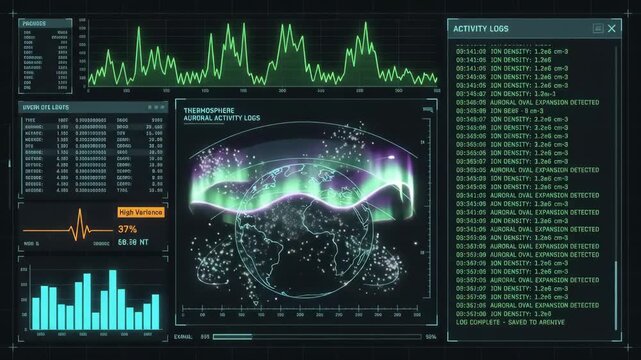
Futuristic digital interface displaying thermosphere auroral activity logs with glowing planet Earth visualization and data graphs on dark high-tech background
00:06
HD
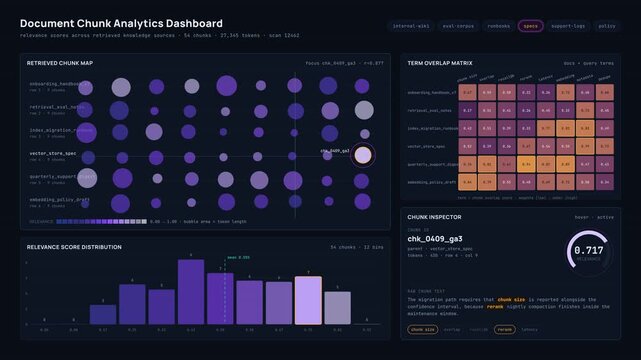
Explore a sleek dark analytics dashboard showcasing relevance scores for document chunks with animated bubble charts and dynamic visualizations in 4K resolution.
00:15
HD
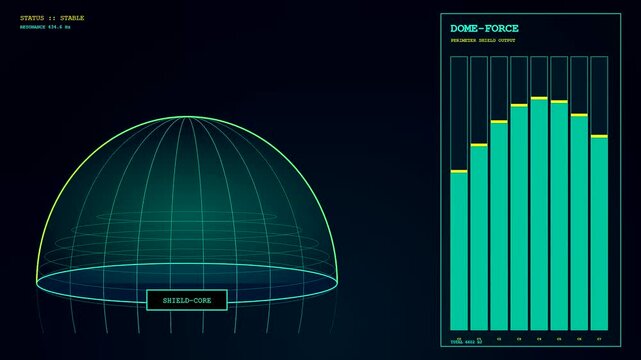
A digital geofence perimeter light dome glows with animated holographic bar charts tracking shifting energy levels in a dark electronic interface display for monitoring data
00:06
HD
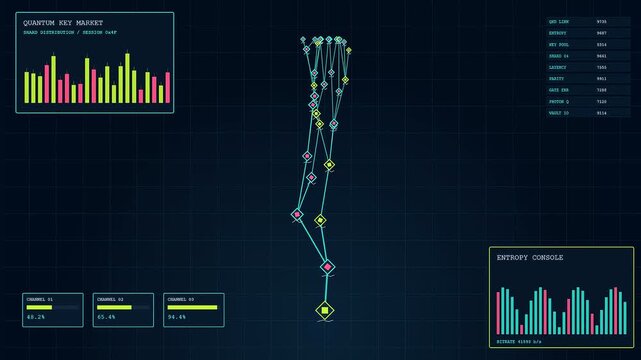
a complex quantum encryption interface features glowing data nodes linked by lines on a dark digital grid surrounded by various scrolling bar charts and metrics
00:06
HD
Abstract digital interface animation showing mechanical tension and physics testing
00:10
HD
Futuristic Sci-Fi HUD Data Visualization Screen, Digital Analytics Charts and Scientific Diagrams, Abstract Math Graph Interface Loop on Dark Background
00:15
HD
A detailed biophilic architecture interface display showing environmental metrics and data visualizations with floating nodes over a dark digital surface in a professional monitoring system
00:06
HD
Digital data visualization with molecular structures and analytics charts.
00:08
HD
A digital virtual lab interface displays light refraction through a glowing prism with shifting spectral data metrics and circular monitoring charts in a dark room environment
00:06
HD
Abstract digital oscilloscope waveforms oscillating on a dark grid for data analysis.
00:05
HD
Plasma turbulence visual analysis featuring glowing blue nebulous entities moving rhythmically across dark screens showing shifting wave graphs and bar charts in a simulated scientific environment
00:06
HD
Futuristic digital user interface with glowing geometric shapes and data charts glowing over a dark colorful gradient background
00:08
HD
Futuristic digital dashboard with neon data charts and analytics
00:12
HD
Circular progress radial gauge chart loop
00:10
HD
Electromagnetic wave propagation diagram showing electric and magnetic field oscillations in physics concept
00:08
HD
Abstract golden wave lines with glowing nodes on dark background representing digital audio signal or technology data stream
00:10
HD
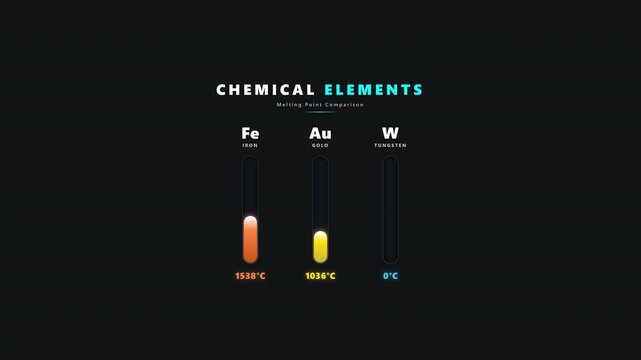
Chemical Elements Melting Point Comparison Infographic Motion Graphic on Alpha Channel
00:10
HD
Abstract digital simulation of physics and motion on black background
00:08
HD
A detailed 3D motor dashboard visualizing performance under changing load conditions with dynamic metrics and glowing indicators in vivid colors and subtle animations.
00:15
HD
Futuristic Deep Space Vector Map Interface Animation with Dynamic Light Trajectory and Navigation
00:10
HD
Animated laptop showing medical heart rate graph and emergency alert
00:08
HD