A link to set your password has been sent to: To access your purchases in the future you will need a password.
Create without limits — unlimited downloads, plus powerful AI editing
New filters added
Sort by

19,768 results for increase and decrease in videos

Net zero goals and CO2 reduction strategy driving sustainability, green energy integration, net zero emissions policies, and climate-friendly sustainability solutions for business and society. Muxer
00:12
HD
Declining bar chart with downward trend, Blue bar chart with falling line graph decline in business data, finance performance and analytics animation
00:07
HD
England economic bar chart graph showing decreasing downturn with national Flag 3D animation on black background.
00:16
HD
Outline icon animation for control, speed, scale, indicator, and pointer.
00:05
HD
bank interest rates
00:06
HD
Namibia Oil Prices Decline with Oil Barrels, Gold Coins and Downward Green Arrow, 3D Economic and Financial Market Concept
00:11
HD
Calculator App Icon with Changing Numbers on Green Screen
00:07
HD
Vector depicting the concept of effective financial management and optimizing costs by actively monitoring diverse subscription services and reducing unnecessary monthly payments
00:17
HD
Interactive plus minus counter button ui for web and mobile app animation 4k interface
00:10
HD
Animated Glowing Green Arrows Appearing and Growing Upwards, Followed By Glowing Red Arrows Appearing and Growing Downwards On a Black Background, Suitable for Stock Market, Business, Finance
00:07
HD
Price drop animation from 1299 to 849 with 35 percent sale discount
00:10
HD
Corporate Net Zero Transformation: Footprint Reduction Animation, CO2 Emission Data Visualization
00:06
HD
Influence of endorphin boost on stress reduction values. Scales of cause and effect. Meter showing increasing high values. Getting good results.
00:11
HD
Resource management and streamlined operations concept with performance icons for business efficiency.
00:10
HD
Carbon Footprint Reduction and Tree Growth Cycle Motion Graphics
00:13
HD
Video with the phrase Live the Moment in Spanish, animated word by word with letter spacing reduction and sharp zoom transitions, delivered in four background and outline versions.
00:12
HD
Neon green dollar coin stack with downward arrow animation for financial growth and savings concepts
00:10
HD
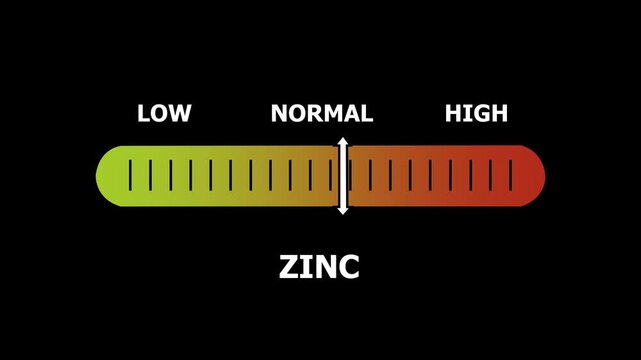
zinc level indicator scale. Low normal & high meter infographic animation. Showing high zinc level color gauge indicator. on a black background 4k animation video
00:10
HD
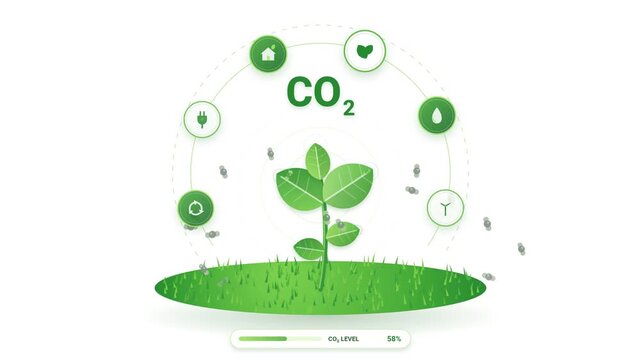
Green energy and carbon neutral concept, plant growing with eco icons and CO2 text, environmental sustainability concept
00:10
HD
Bright white 3D number 2033 text animation floating against a deep black void offering a vibrant and modern visual for the year with a sense of digital energy.
00:10
HD
Visual Representation of Artificial Intelligence Impact on Quality and Cost in Business Environment with Silhouettes and Cityscape Background Sigmoid
00:10
HD
Neon Cost Reduction Dollar Icon Animation, Falling Stock Market Graph and Financial Crisis Concept, 4K
00:10
HD
Charts up and down, line graph, stock market and exchange data, trading screen. Investment, business, financial market, analyzing, growth, wealth. 3D animation
00:12
HD
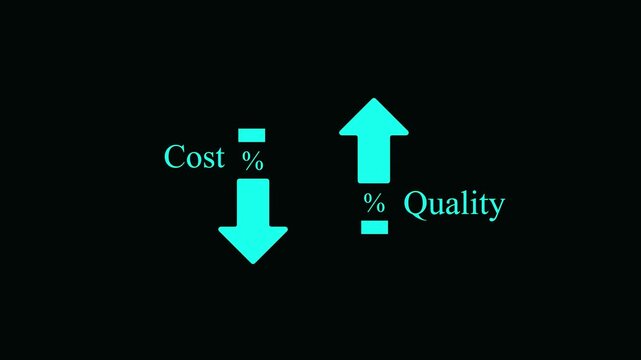
Glowing quality and cost control concept on transparent background. Successful organization strategy and management quality control. Percentage icon of quality with up arrow and cost with down arrow
00:10
HD
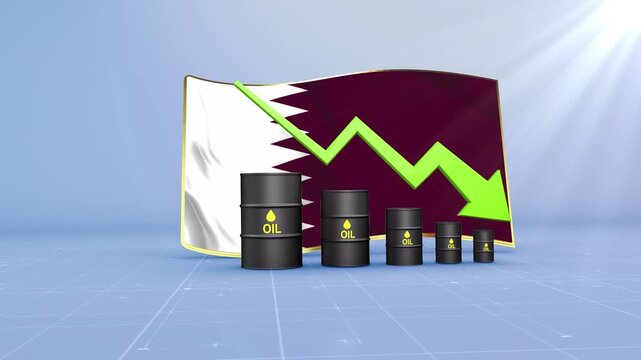
Qatar Oil Price Falling with Oil Barrels Downward Green Arrow and 3D Financial Data Visualization Graphs for Economy and Business Concept
00:11
HD
Cameroon Oil Prices Decline with Oil Barrels, Gold Coins and Downward Green Arrow, 3D Economic and Financial Market Concept
00:11
HD
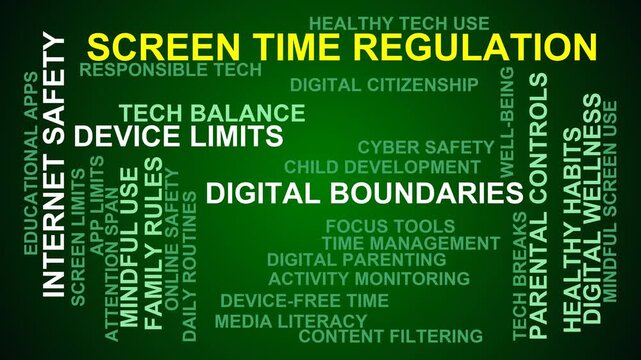
Screen Time Regulation Word Cloud
00:11
HD
Business operating costs featuring financial instruments, increasing expenses, and warning signs for managing and optimizing company budget expenditures
00:17
HD
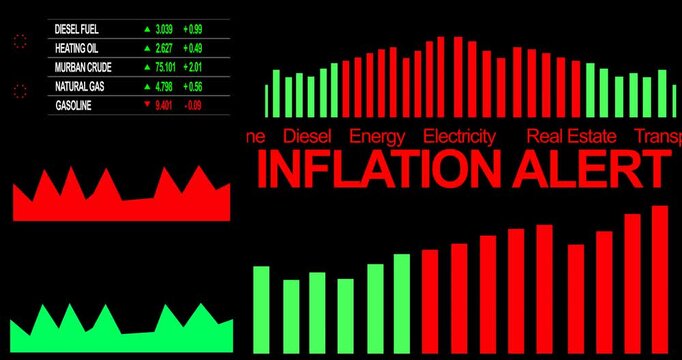
Animated financial dashboard showing rising inflation rates and CPI data with alert indicators. The video presents increasing cost of living metrics, including categories such as energy, food, and hou
00:14
HD
A glowing blue neon graphic featuring a percentage sign (%). It is flanked by a upward-pointing arrow on the left and a downward-pointing arrow on the right against a dark background.
00:10
HD
Libido Level Gauge Increasing and Decreasing Indicating Desire and Hormonal Response Animation
00:19
HD
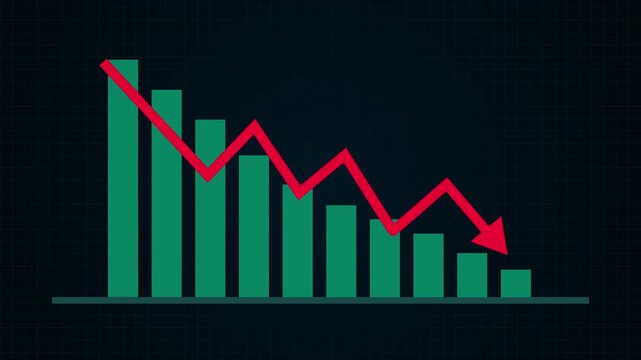
Business decline bar chart animation with falling line graph and shadow effects on transparent background. Indicate revenue decline, financial loss, negative growth
00:06
HD
Glowing neon green animated line graph illustrating a downward market trend on black background. 4K Video motion graphic animation
00:10
HD
Two ladder icons with directional arrows showing ascending and descending paths representing progression or skill level system
00:10
HD
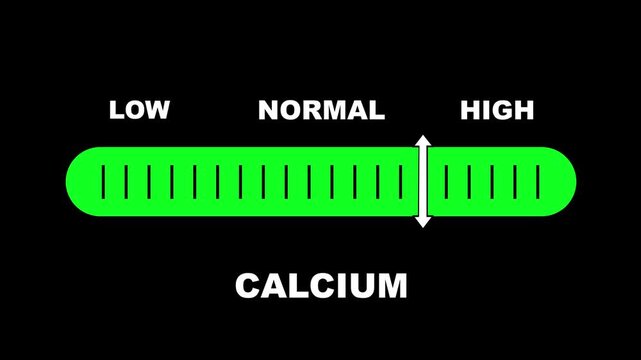
Calcium level indicator scale. Low normal & high meter infographic animation on black background. Showing high calcium level color gauge indicator for nutrition and bone health monitoring

00:10
HD
Bar graph rises and falls illustrating market fluctuations on a white background
00:10
HD
Mobile Network Signal Strength Animation
00:05
HD
2027 New year with change to UP and Down arrow. Interest rate, GDP, stocks market, financial, deflation and Inflation, mortgage, debt, Loan and Economic Recession
00:09
HD
Increasing counting number 0 to 10k for price like views figures or amount concepts.4k motion graphics video animation
00:10
HD
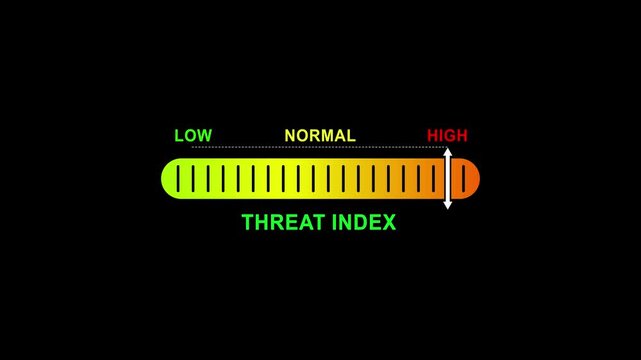
threat index level indicator scale.Low normal high meter infographic animation on black background. Showing high pressure level color gauge indicator for health monitoring and safety analysis.4k
00:10
HD
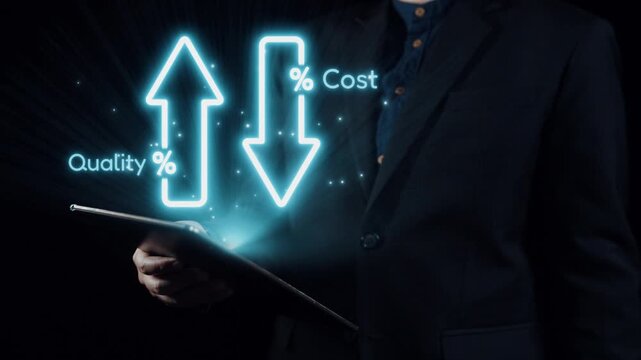
A businessman in a dark suit holds a tablet displaying glowing arrows representing quality and cost fluctuations, symbolizing financial analysis and strategic planning. Qubit
00:14
HD
Down business arrow decline investment and trading loss economic recession video.
00:07
HD
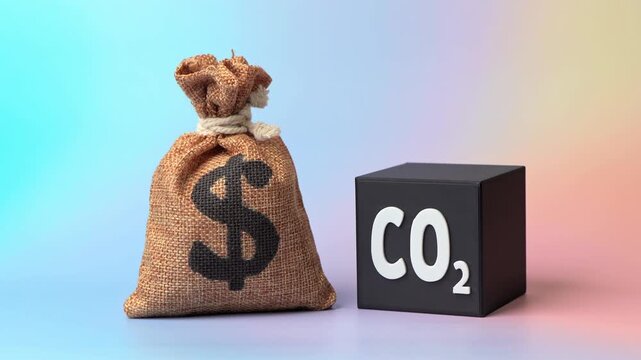
A CO2 cube and a dollar money bag. Recycling grants. Reducing environmental impact while generating income. Increase in the cost of emission quotas for enterprises. Waste recycling
00:14
HD
Luminous blue neon bar chart with clear downward trend line indicating financial decline
00:10
HD
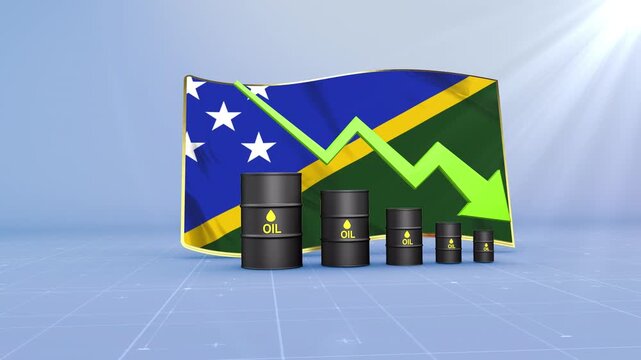
Solomon Islands Oil Price Falling with Oil Barrels Downward Green Arrow and 3D Financial Data Visualization Graphs for Economy and Business Concept
00:11
HD
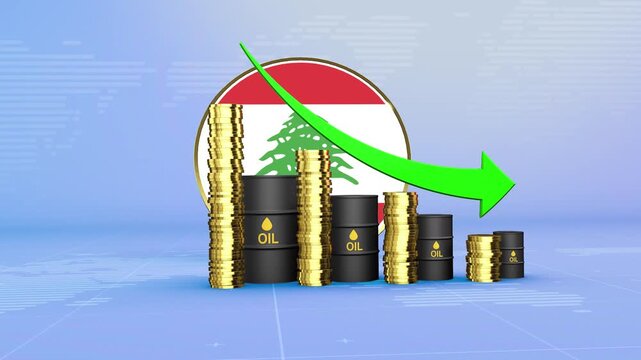
Lebanon Oil Prices Decline with Oil Barrels, Gold Coins and Downward Green Arrow, 3D Economic and Financial Market Concept
00:11
HD
White fluffy mycelium threads fill a mold around a small object, creating soft packaging that later breaks down into dark soil
00:15
HD
Product pricing operations reflecting competitive price strategy, discount calculations, sale promotion, and online e commerce management on a white background
00:17
HD
Green Bar Chart Showing Financial Decline with Stacked Coins and Upward Arrow finance. Stacked coins on green bars showing financial decline with upward arrow overlay, graph.
00:12
HD
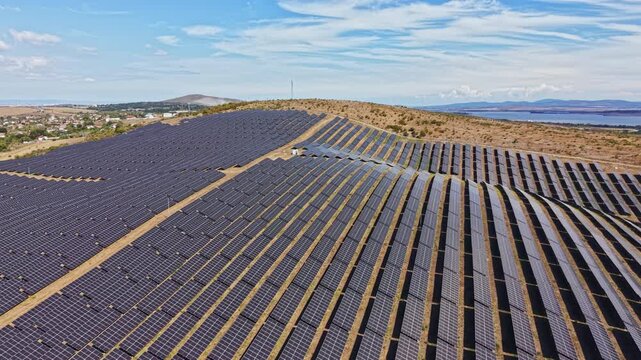
Large fields of solar panels are arranged on a hillside, reflecting sunlight under a clear blue sky. The location supports green energy efforts in a rural setting.
00:17
HD
Business growth concept in graph chart showing marketing sales profit increasing to future target . growing business concept animation on black background. 4k video
00:10
HD
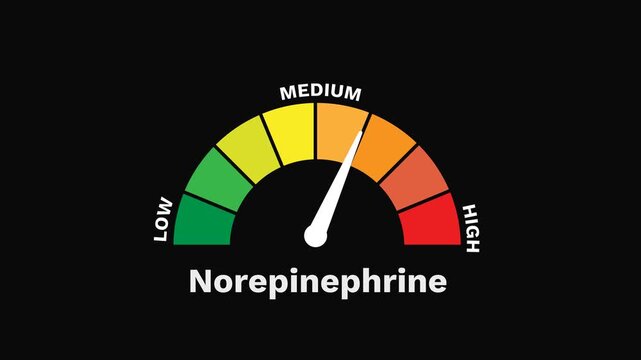
Norepinephrine Level Gauge Increasing and Decreasing, Alertness and Stress Response 2D Motion Graphic
00:19
HD
Glowing neon line House under protection icon with up arrow isolated on black background. a glowing light drawing a neon outline of houses decreasing in size. House, home building. 4K animation Video.
00:10
HD
Cyan downward arrow for cost and upward arrow for with percentage symbols on a solid black background for business performance analysis
00:10
HD
Glowing neon line graph downwards against black background animation. Stock market losses and descending trading graph and downward arrows recession
00:10
HD
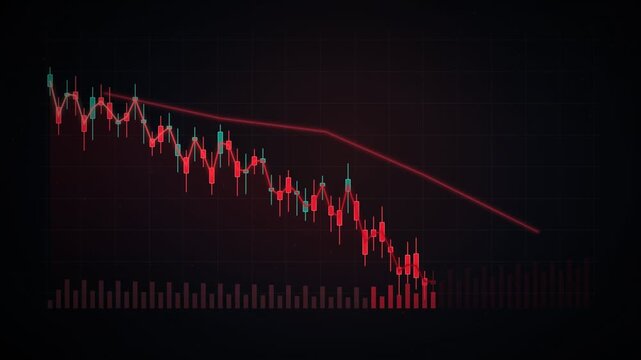
Stock market candles with falling prices of securities. Loss of assets in equities, showing a decreasing trend, poor performance, and financial losses due to economic crisis.
00:17
HD
White dollar sign graph showing a downward trend. money financial loss and economic downturn shown.
00:10
HD
Panoramic wide graphic animation of red arrows pointing down on black background screen with letterbox borders showing failure and loss.
00:10
HD
Business Analytics Dashboard Motion Graphic with Growth Statistics
00:10
HD
market sentiment level indicator scale. Low normal high meter infographic animation on black background. Showing high pressure level color gauge indicator.4k animation video
00:10
HD
This image depicts the concept of net zero emissions, featuring a globe with green leaves and various environmental icons, embodying the vision of a sustainable future. Qubit
00:14
HD
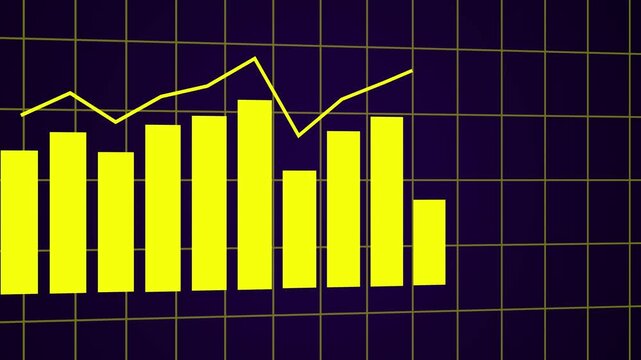
Animated yellow bar chart and line graph showing financial data on grid background
00:10
HD
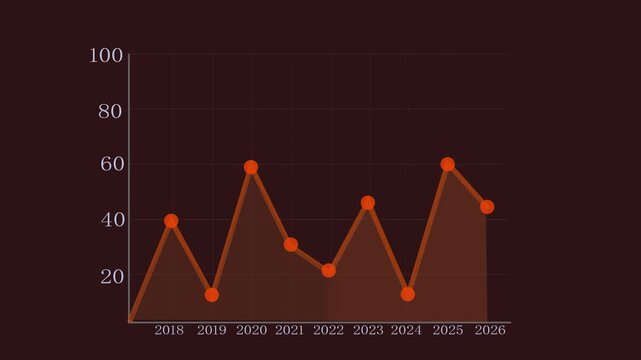
Line graph models track chronological statistics updates across the year 2026. Financial market analytics software modules look crisp across this grid. Timeliness grow.
00:05
HD
Down curve arrow animation, Falling prices concept arrow animation.
00:15
HD
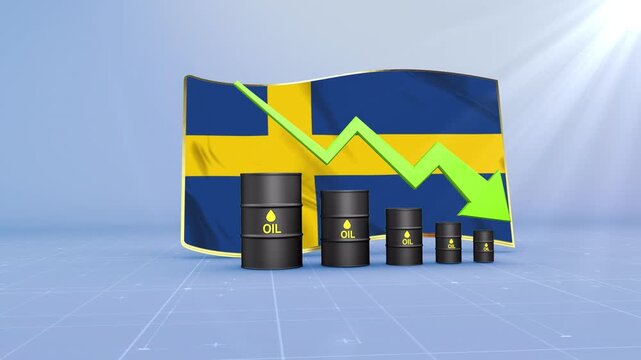
Sweden Oil Price Falling with Oil Barrels Downward Green Arrow and 3D Financial Data Visualization Graphs for Economy and Business Concept
00:11
HD
Central African Republic Oil Prices Decline with Oil Barrels, Gold Coins and Downward Green Arrow, 3D Economic and Financial Market Concept
00:11
HD
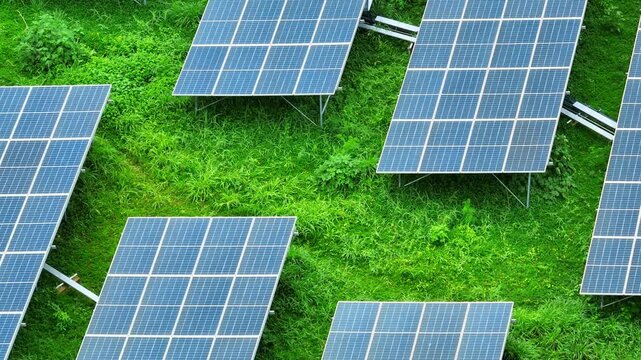
Drone aerial scene of a photovoltaic farm across green vegetation reflects modern clean energy infrastructure, reduced carbon emissions, energy transition and sustainable economic growth. 4k.
00:10
HD
Business analytics visualizes financial accounting, profit and revenue analysis, cost reduction strategies, and budget planning for economic management
00:17
HD
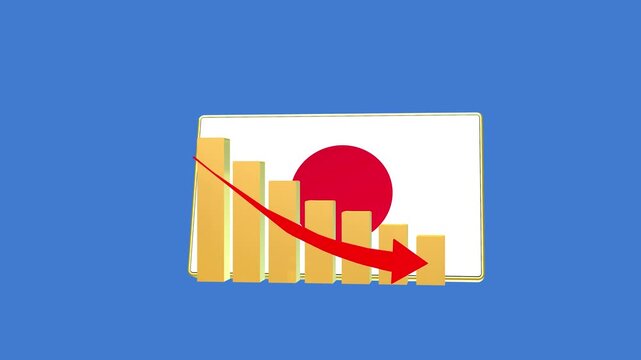
Japan economic bar chart graph showing decreasing downturn with national Flag 3D animation on black background.
00:16
HD
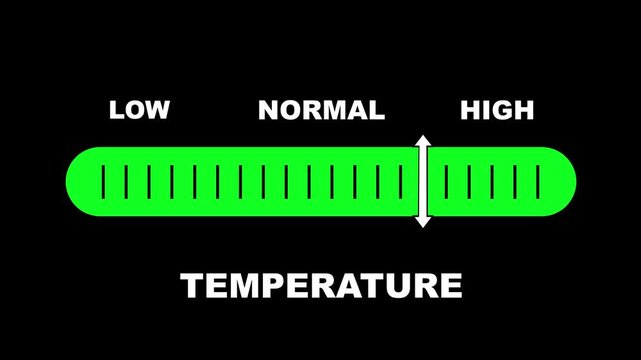
Temperature level indicator scale. Low Normal High meter infographic animation on black background. Animation showing high temperature level color gauge indicator for weather and climate monitoring.
00:10
HD
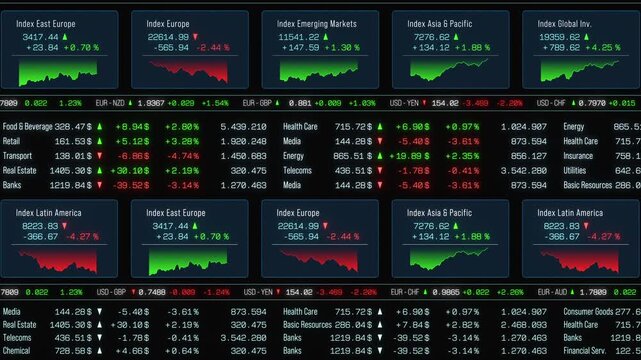
Trading screen Asia Pacific, North America index chart up, Europe and Latin America index down, stock market data. Financial market, sector data, prices, trading volume, investment information.
00:10
HD
Bad Economy Recession Graph Chart Animation 2d Animation with Alpha Matte
00:16
HD
Animation of small business sales report showing a decreasing red arrow graph, decreasing purchasing power due to inflation, economic concept
00:15
HD
Bright white 3D number 2044 text animation floating against a deep black void offering a vibrant and modern visual for the year with a sense of digital energy.
00:10
HD
Business decline bar chart animation with falling line graph and shadow effects on transparent background. Indicate revenue decline, financial loss, negative growth
00:06
HD
Success trend animation with green arrow moving upward step by step, with video animation.
00:10
HD
Animated gauge meter with changing numbers on green screen
00:05
HD
3D blue descending bar chart visualizing financial decline data metrics and economic market trends for professional business analysis presentation
00:10
HD
Digital stock market trading data grid animation with moving financial numbers and price charts for business presentation and background loop
00:20
HD
success rate level indicator scale. Low normal high meter infographic animation on black background. Showing high pressure level color gauge indicator.4k quality animation video
00:10
HD
A businessman uses a smartphone to review quality and cost metrics while working on a laptop in a dark office. The image illustrates data analysis in a modern environment. Qubit
00:14
HD
Red arrows falling downward motion graphics for economic loss and financial failure concept loop.
00:17
HD
Neon purple and white jagged line graph with arrow pointing up on black background Keywords.A arrow pointing downwards with a white visual impact effect on a black background.
00:12
HD
Red Arrow Pointing Down in Front of Glass Bar Chart Showing Financial Decline
00:05
HD
Tunisia Oil Price Falling with Oil Barrels Downward Green Arrow and 3D Financial Data Visualization Graphs for Economy and Business Concept
00:11
HD
Bangladesh Oil Prices Decline with Oil Barrels, Gold Coins and Downward Green Arrow, 3D Economic and Financial Market Concept
00:11
HD
Three-word text animation featuring Explore New Models with sequential word reveal, spacing reduction effect, and zoom transition in 3840x2160 format.
00:12
HD
Operational expense chart visualizing financial analysis, budgeting, and cost management with rising expenses, risks, and careful monitoring for business strategy and success
00:17
HD
North Korea economic bar chart graph showing decreasing downturn with national Flag 3D animation on black background.
00:16
HD
Fire danger level indicator scale. Low normal & high meter infographic animation on black background. Showing high fire danger level color gauge indicator for safety and risk monitoring.
00:10
HD
Burning “perfectionism” label held by hand, symbolizing self-acceptance, progress over perfection, reduced pressure, and freedom from unrealistic standards and self-criticism.
00:19
HD
Outsourcing concept. Person using laptop with business services and collaboration icons, external service providers, cost reduction, operational efficiency and business management.
00:15
HD
Minimalist downward trend arrow line motion abstract visual stock symbol financial decline data analytics
00:10
HD
Dynamic Motion of Direction Down Arrows with Alpha Channel on Black Background. Glowing down arrow animation.
00:12
HD
Money increases icon, dollar rate increase stretching arrow up icon .Glowing up arrow with dollar sign. Glowing neon line of dollar sign icon and up arrow isolated on transparent.Business growth
00:10
HD
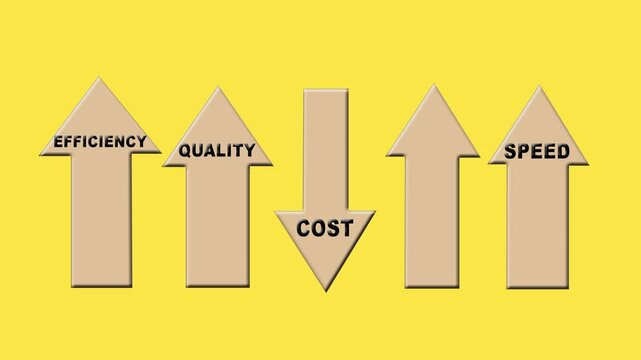
Business optimization concept. increasing efficiency, and speed while reducing costs
00:08
HD
Animated progress bar with percentage counter pink on black background, animation loading
00:10
HD
Futuristic Headphone Audio Volume Control Slider HUD Animation
00:10
HD
satisfaction rating level indicator scale. Low normal & high meter infographic animation. Showing high satisfaction rating level color gauge indicator. on a black background 4k animation video
00:10
HD
Hand drawn plus and minus sign sketch animation loop.
00:10
HD