A link to set your password has been sent to: To access your purchases in the future you will need a password.
Create without limits — unlimited downloads, plus powerful AI editing
New filters added
Sort by

19,768 results for increase and decrease in videos

Mobile Network Signal Strength Animation
00:05
HD
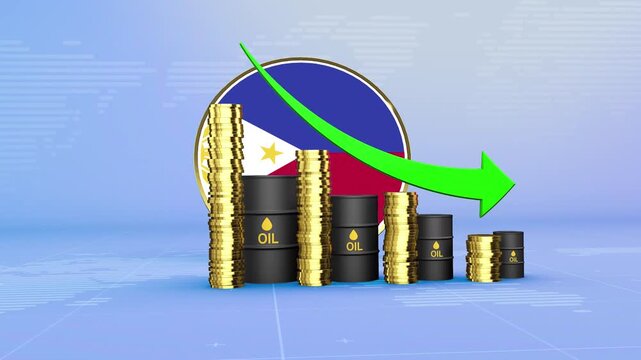
Philippines Oil Prices Decline with Oil Barrels, Gold Coins and Downward Green Arrow, 3D Economic and Financial Market Concept
00:11
HD
Net zero goals and CO2 reduction strategy driving sustainability, green energy integration, net zero emissions policies, and climate-friendly sustainability solutions for business and society. Muxer
00:20
HD
Health care concept. Keyword weight and increase and decrease neon glowing arrow icons.
00:08
HD
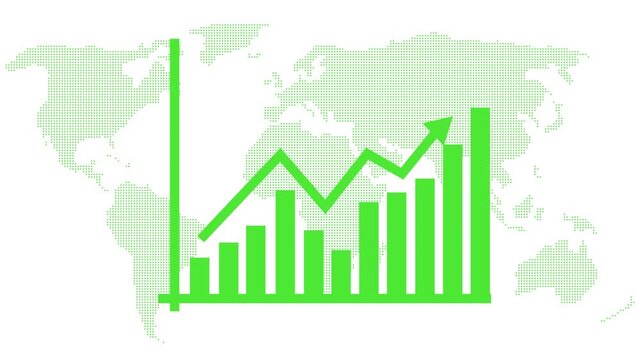
Revenue and Profit Growth Animation for Corporate Business Reports
00:08
HD
Dopamine Level Gauge Increasing and Decreasing Indicating Reward and Motivation Animation
00:19
HD
3D Rendered Red Percent Symbol Isolated on a Clean Light Gray Background for Black Friday and Sales Promotions
00:05
HD
Lush green forest with glowing co2 symbol and downward arrows, representing carbon absorption and climate
00:08
HD
Glowing neon line House under protection icon with up arrow isolated on black background. a glowing light drawing a neon outline of houses decreasing in size. House, home building. 4K animation Video.
00:10
HD
Cambodia Crude Oil Price Drop with Oil Barrels Downward Green Arrow and 3D Financial Data Visualization Graphs for Economy and Business Concept
00:11
HD
Immunity level indicator scale. Low Normal High meter infographic animation on black background. Showing high immunity level color gauge indicator for health monitoring and wellness.
00:10
HD
radiation level indicator scale. Low normal & high meter infographic animation. Showing high radiation level color gauge indicator. on a black background 4k animation video
00:10
HD
Animated Cricket Match Runs Per Over Bar Chart Showing Scoring Performance
00:10
HD
Increasing counting number 0 to 100k for price like views figures or amount concepts .4k motion graphics video animation
00:10
HD
priority level indicator scale. Low normal high meter infographic animation on black background. Showing high pressure level color gauge indicator.4k quality animation video
00:10
HD
Minimalist black arrow pointing downwards on a clean white background in motion graphics.
00:10
HD
4K motion graphic of Graph chart marketing sales profit decreasing with alpha channel transparency. 2D cartoon animation of Downfall financial status of corporate business on white background.
00:10
HD
Losses On Colourful Tachometer Animation 2d Animation with Alpha Matte
00:16
HD
Arrow graphics showing progression and expansion across a blue background with black dividers
00:05
HD
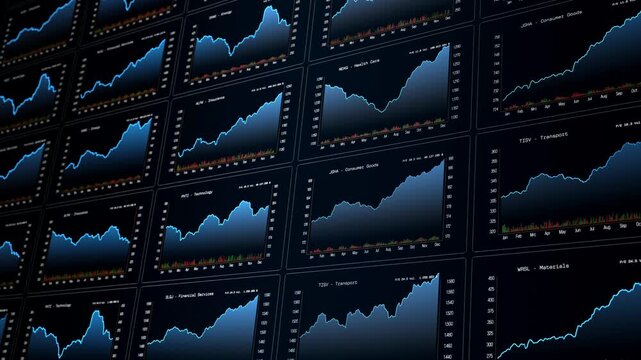
Charts up and down, line graph, stock market and exchange data, trading screen. Investment, business, financial market, analyzing, growth, wealth. 3D animation
00:12
HD
Clean Carbon Reduction Tracker Dashboard with Descending Emissions Steps and Green Energy Growth
00:05
HD
Two red arrows point left and right, representing give and take in true and false ways.
00:09
HD
Three-word text animation featuring Play Your Favorites with sequential word reveal, spacing reduction effect, and zoom transition in 3840x2160 format.
00:12
HD
Temperature thermometer icon animation. Classic glass thermometer temperature increasing and decreasing from 1 to 100, thermometer cooling animation on black background. 4k video
00:10
HD
Probability level indicator scale. Low Normal High meter infographic animation on black background. Animation showing high probability level color gauge indicator for statistical analysis and outcome.
00:10
HD
Hand writing tax reduction concept on blackboard with yellow chalk for financial savings
00:06
HD
Financial stock market chart showing downward price trend
00:08
HD
Financial analysis displaying an upward trend, indicating potential market recovery and economic expansion, with concepts of decrease, risk, and data management for business success
00:17
HD
Candlestick chart showing financial market data with an upward trend on a dark background.
00:10
HD
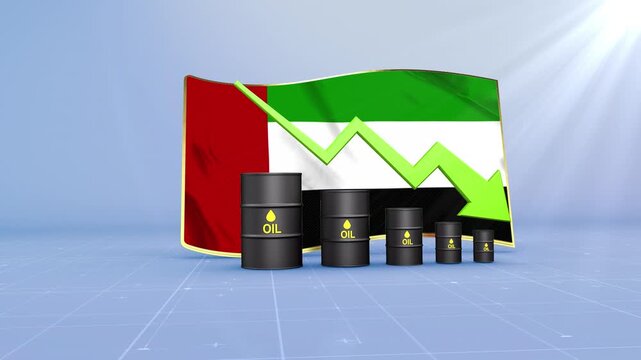
United Arab Emirates Oil Price Falling with Oil Barrels Downward Green Arrow and 3D Financial Data Visualization Graphs for Economy and Business Concept
00:11
HD
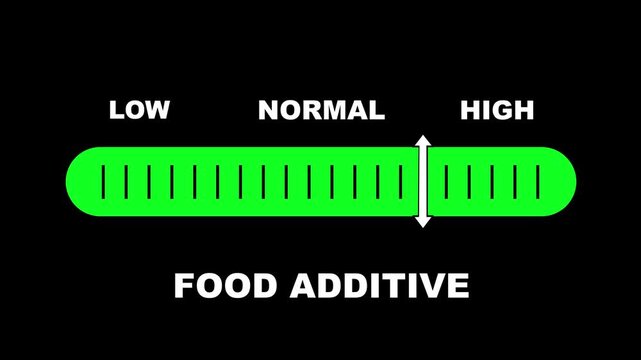
Food additive level indicator scale. Low normal high meter infographic animation on black background. Showing high food additive level color gauge indicator for nutrition and food safety monitoring.
00:10
HD
Energy discount icon animated with flash and percentage symbol motion graphic.
00:05
HD
Clean CGI Depiction of PET Scan Style Brain Activity Highlighting Areas of Decrease and Increase in Neural Function Suitable for Educational and Research Presentations
00:08
HD
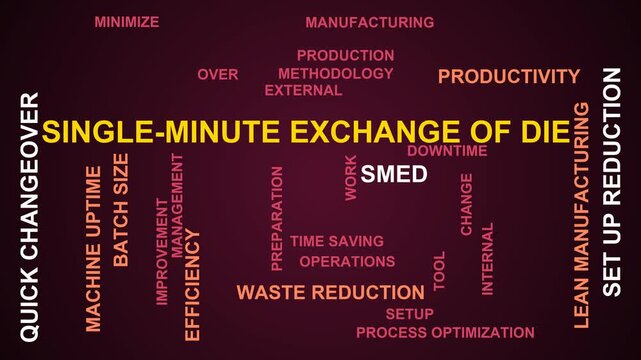
Single Minute Exchange Of Die Word Cloud
00:11
HD
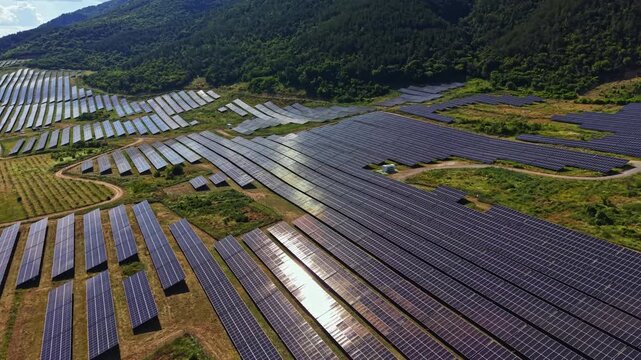
Rows of solar panels stretch across the landscape under clear skies. The sun reflects off the panels, showcasing the energy production in a rural area during daytime.
00:20
HD
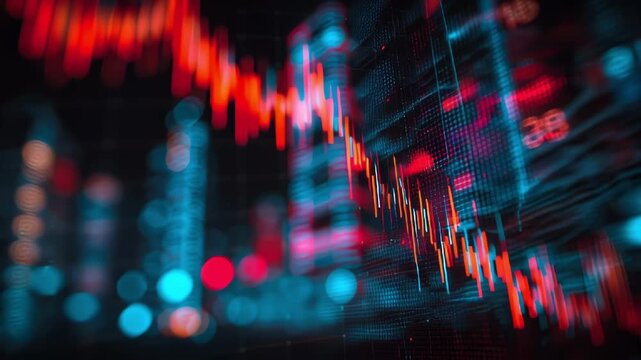
Abstract digital graph depicting a downward trend with red and blue data points against a dark background representing financial loss or market decline
00:08
HD
Red Down Arrow and Green Up Arrow with Horizontal Lines on animation Black Background arrows. Smooth animation of green up and red down arrows with moving lines for data visualization.
00:07
HD
Financial Growth Trend Animation with Positive Revenue Indicators
00:09
HD
success level indicator scale. Low normal & high meter infographic animation. Showing high success level color gauge indicator. on a black background 4k animation video
00:10
HD
Animated Colorful Bar Chart Growing and Shrinking on White Background
00:06
HD
business score level indicator scale. Low normal high meter infographic animation on black background. Showing high pressure level color gauge indicator.4k animation video
00:10
HD
Eco-friendly Green Footprint Vector Logo Design for Ecological Trail and Nature Conservation
00:08
HD
Testosterone level meter showing progress from beginner low cyan zone to expert high red zone. Testosterone level speedometer gauge with low and high levels. 4k video animation
00:10
HD
Abstract financial chart with falling bars downward market trend and low performance with grid and world map details animation
00:10
HD
Close-up of hands typing on laptop. Digital arrow points downward with 'COST %' text. Shows focus on budgeting or financial reduction. Ideal for business, finance
00:10
HD
Italy economic bar chart graph showing decreasing downturn with national Flag 3D animation on black background.
00:16
HD
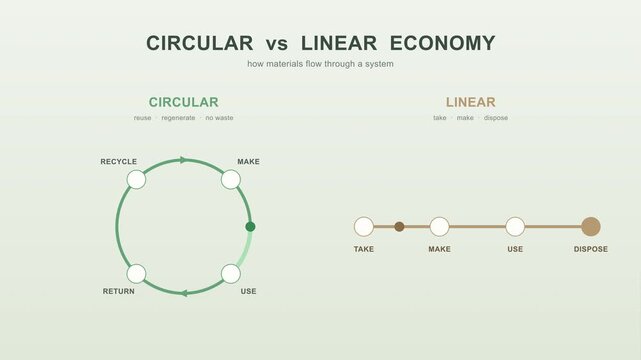
Circular vs linear economy diagram showing resource cycles, sustainability, and waste reduction concepts
00:08
HD
Video with the phrase Feel the Energy in Spanish, animated word by word with letter spacing reduction and sharp zoom transitions, delivered in four background and outline versions.
00:12
HD
Panama Oil Prices Decline with Oil Barrels, Gold Coins and Downward Green Arrow, 3D Economic and Financial Market Concept
00:11
HD
Latvia Oil Price Falling with Oil Barrels Downward Green Arrow and 3D Financial Data Visualization Graphs for Economy and Business Concept
00:11
HD
Animated orange curved statistical graph line with smooth motion and transparent background for video.
00:05
HD
Financial Decline Graphic Red Downward Arrow and Crashing Market Chart Line
00:05
HD
A graph displays financial market trends with green and red bars on a screen
00:08
HD

Hand drawn fluctuating line chart animation showing changing values, market volatility, financial analysis, data trends, uncertainty and performance movement.
00:07
HD
danger level indicator scale. Low normal & high meter infographic animation. Showing high danger level color gauge indicator. on a black background 4k animation video
00:10
HD
4K Editorial Paper Craft ESG Carbon Reduction Report Animation
00:12
HD
Business growing bar chart with dashed trend line showing market peak and decline. Ideal for financial risk analysis, sales decrease, and stock market volatilit
00:07
HD
This image showcases a digital representation of carbon dioxide reduction strategies and green energy initiatives with various eco-friendly icons and a focus on sustainability and innovation. Cipher
00:10
HD
radiation level indicator scale. Low normal & high meter infographic animation. Showing high radiation level color gauge indicator. on a white background 4k animation video
00:10
HD
Futuristic dollar countdown timer animation, glowing dollar symbol integrated with a circular countdown display, numbers decreasing smoothly from 0 to 200
00:10
HD
An electronic monitor showcasing low financial growth trends and negative returns for corporate market analysis presentations
00:15
HD
Outline bar chart animation reveals downward falling fiscal columns. Financial economic loss reflects across the outline bar chart. Negative corporate investment data marks the bar chart.
00:12
HD
Animation showing downward blue arrow over bar graph indicating financial decline
00:14
HD
Abstract financial chart with falling bars downward market trend and low performance with grid and world map details animation
00:10
HD
Lean thinking concept. Cost reduction concept. Business process improvement. Maximising productivity and quality, reducing time and cost. Cost cutting, lean process for surviving the recession.
00:10
HD
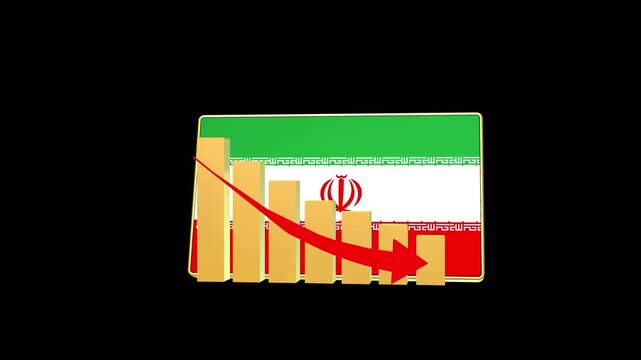
Iran economic bar chart graph showing decreasing downturn with national Flag 3D animation on black background.
00:16
HD
Neon blue outline of a person standing by a screen with up and down arrows indicating progress icon
00:08
HD
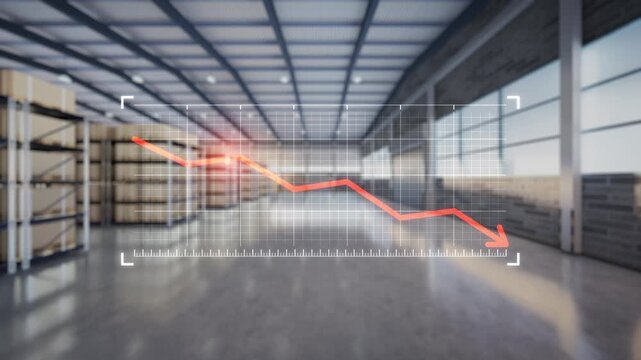
Industrial warehouse footage featuring declining financial graph overlay, falling arrow, business loss, economic downturn, market decline, reduced production, logistics slowdown, supply chain crisis.
00:14
HD
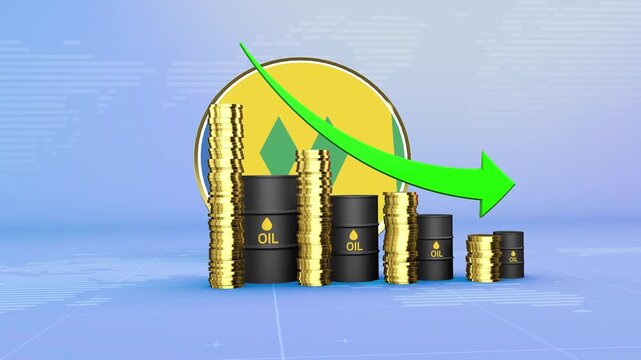
Saint Vincent and the Grenadines Oil Prices Decline with Oil Barrels, Gold Coins and Downward Green Arrow, 3D Economic and Financial Market Concept
00:11
HD
Ireland Oil Price Falling with Oil Barrels Downward Green Arrow and 3D Financial Data Visualization Graphs for Economy and Business Concept
00:11
HD
Business professional using laptop with holographic cost reduction graph and bars. Concept of financial efficiency, budget cutting, expense management, and corporate profit optimization.
00:10
HD
Cryptocurrency trading. Bitcoin stock graphic. Bitcoin mining and Finance banking management concept, oil and Money trading, Digital trade platform. Profit and loss graph. Online trading
00:13
HD
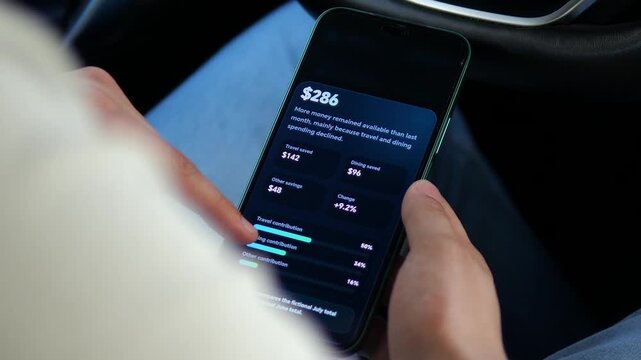
User reviews a mobile savings analysis showing higher month-over-month retention as reduced travel and dining expenses strengthen personal budgeting and financial resilience.
00:07
HD
fitness level level indicator scale. Low normal high meter infographic animation on black background. Showing high pressure level color gauge indicator.4k quality animation video
00:10
HD
A numeric counter with plus and minus controls on black, useful for quantity selection concepts, value changes, and animated number graphics.
00:10
HD
Customer satisfaction level indicator scale. Low normal & high meter infographic animation on black background. Showing high level color gauge indicator for business service quality and experience.
00:10
HD
Churn Rate Percentage Decrease Animation on Green Screen Background.
00:06
HD
A diverse group of professionals collaborates around a table, focusing on carbon emission strategies. Infographics highlight various environmental concepts and sustainability icons. Raster
00:12
HD
water pollution level indicator scale. Low normal & high meter infographic animation. Showing high water pollution level color gauge indicator. on a black background 4k animation video
00:10
HD
Financial operations with currency exchange and banking fees, optimizing capital for cost reduction and efficient money payments within global economic transactions
00:17
HD
Green animated bar graph chart business finance growth success presentation 4k loop. Animated business green bar graph chart data infographic economic trend 4k seamless.
00:11
HD
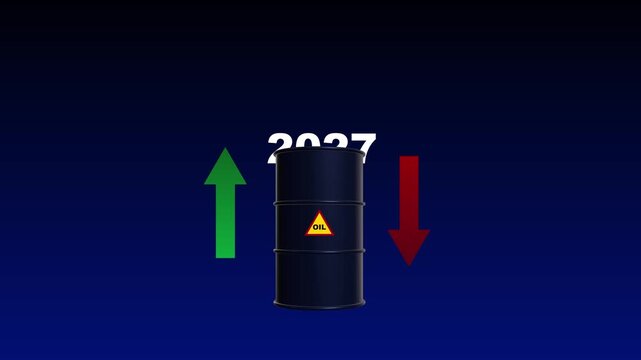
2027 Oil Market Outlook Showing Uncertain Price Movement, With Conflicting Upward and Downward Signals Reflecting Market Volatility, Energy Demand, and Investment Risk
00:10
HD
Animated business graph chart showing rising financial growth, glowing profit increase, and upward sales arrow on green background representing future business success and expansion
00:17
HD
Quality control and company cost reduction. Successful organization strategy and management. cost reduction and improving quality. Money loss icon
00:10
HD
Lean thinking concept. Cost reduction concept. Business process improvement. Maximising productivity and quality, reducing time and cost. Cost cutting, lean process for surviving the recession.
00:10
HD
Business falling and rising graph depreciation of currency and economy. Infographic with global data of world statistics and showing losses and growth or global decline
00:10
HD
Business growth and success arrow, growing business chart animation with dollar sign.
00:10
HD
Quality control and company cost reduction. Successful organization strategy and management. motion graphic of Successful organization strategy concept.
00:10
HD
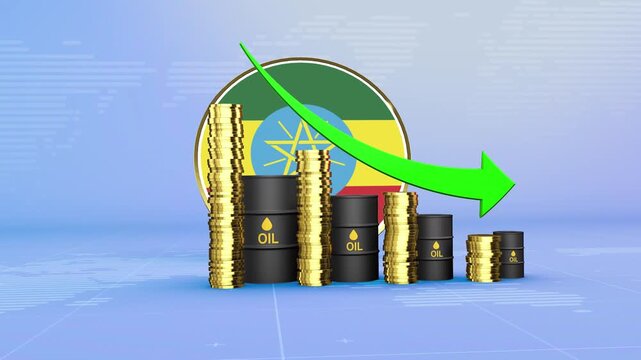
Ethiopia Oil Prices Decline with Oil Barrels, Gold Coins and Downward Green Arrow, 3D Economic and Financial Market Concept
00:11
HD
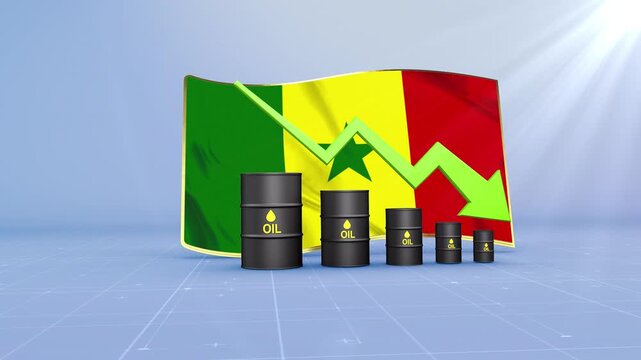
Senegal Oil Price Falling with Oil Barrels Downward Green Arrow and 3D Financial Data Visualization Graphs for Economy and Business Concept
00:11
HD
Stock Market Down Red CandleSticks. High quality 4k footage
00:19
HD
Cryptocurrency trading. Bitcoin stock graphic. Bitcoin mining and Finance banking management concept, oil and Money trading, Digital trade platform. Profit and loss graph. Online trading
00:12
HD
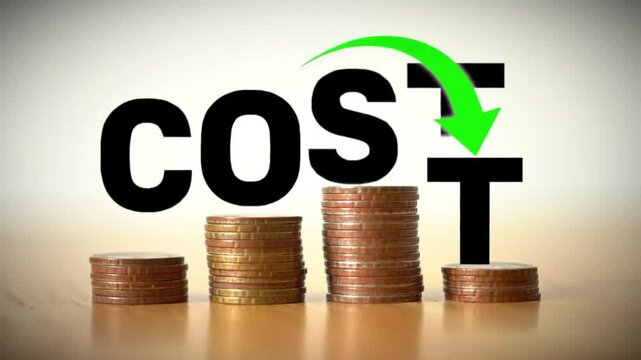
Cost Reduction Displayed with Stacked Coins and Downward Arrow on White Background
00:08
HD
Bar Chart and Line Chart Down Graph
00:08
HD
Abstract glowing neon swipe arrow. 4k animation. Down to up neon line arrow direction animation. Neon line raising business arrow on black background.on black backgraund .HD video animation.
00:10
HD
Abstract organic shapes growing in size against a blue background with cinematic motion
00:05
HD
Weight level indicator scale. Low normal & high meter infographic animation on black background. Showing high weight level color gauge indicator for body weight and health monitoring.
00:10
HD
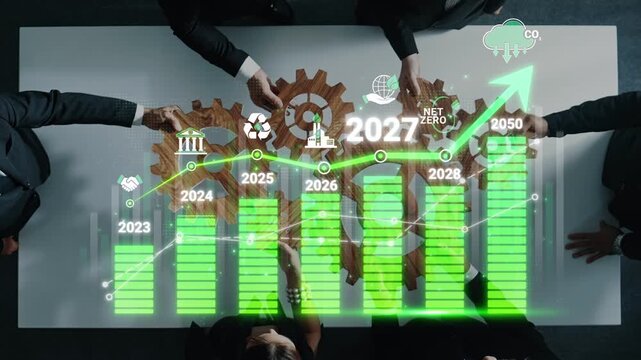
Business team meeting to discuss sustainability goals with graphs, charts, and green technology icons aiming for net zero targets by 2050 Sigmoid
00:15
HD
satureated fat level indicator scale. Low normal & high meter infographic animation. Showing high atureated fat level color gauge indicator. on a black background 4k animation video
00:10
HD
Lean production process diagram depicting manufacturing industry automation, smart factory managing product delivery, with efficiency and waste reduction
00:17
HD