A link to set your password has been sent to: To access your purchases in the future you will need a password.
Create without limits — unlimited downloads, plus powerful AI editing
New filters added
Sort by

19,768 results for increase and decrease in videos

Cost reduction and cost saving through digital transformation, business cost optimization, operational cost reduction, financial savings, and resource efficiency strategies for business success. Spire
00:20
HD
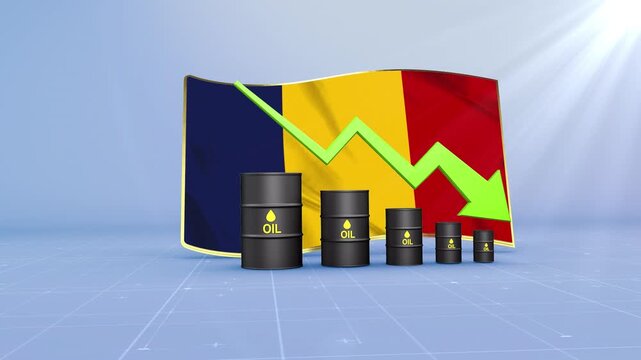
Chad Crude Oil Price Drop with Oil Barrels Downward Green Arrow and 3D Financial Data Visualization Graphs for Economy and Business Concept
00:11
HD
Business Line Graph Animation Data Analytics 4K  Financial Market Trends Chart Loop
00:10
HD
Bar graphs and linear graphs that fluctuate.
00:16
HD
Barista tilting milk pitcher pouring into blue cup as graphs overlaying showing coffee shop metrics
00:10
HD
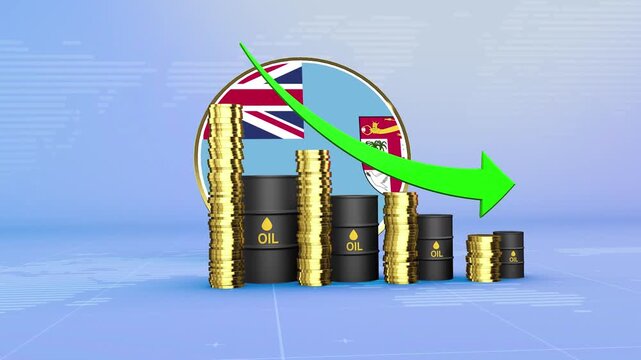
Fiji Oil Prices Decline with Oil Barrels, Gold Coins and Downward Green Arrow, 3D Economic and Financial Market Concept
00:11
HD
Cost and quality control concept.cost 40 % . Successful organization strategy and management.
00:13
HD
Computer Screen Displaying Graph Data Generative AI
00:08
HD
rapid warming, the thermometer rises from a temperature of + 21 to + 56 degrees
01:15
HD
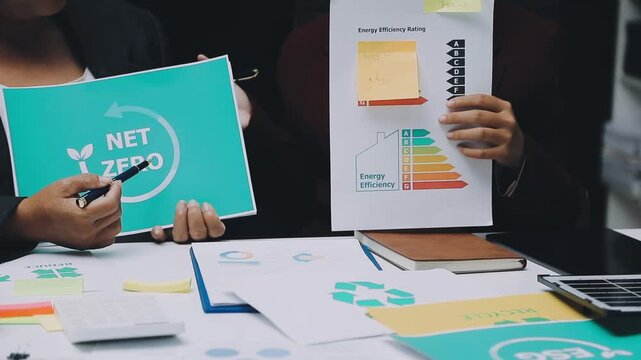
Energy audit smart home management delivers cost savings and business growth with improved rating system for energy use control and reduced expenses in residential and commercial hand
00:05
HD
Chalkboard falling graph and down arrow with hand drawing last bar
00:08
HD
The graphic illustration depicts the decline in company revenue visually over a specific period, reflecting a decrease in profit
00:06
HD
Three-word text animation featuring Develop New Skills with sequential word reveal, spacing reduction effect, and zoom transition in 3840x2160 format.
00:12
HD
forest with a digital overlay showing a bar graph and numerical data representing carbon offset values, carbon credit concept.
00:05
HD
Zoom in and out animation the rose symbol. Large black symbol in the center and four small symbols around. Seamless looped 4k animation on white background
00:12
HD
ESG concept with a animated sustainability sign and 3 different related frames
00:10
HD
Fire danger level indicator scale. Low normal & high meter infographic animation on white background. Showing high fire danger level color gauge indicator for safety and risk monitoring.
00:10
HD
Upward and Downward Stock Chart, Business and Finance Icon Motion Graphics on White Background
00:08
HD
35% Pie Chart Modern Animation
00:16
HD
Evolution of currencies in the world market with up and downs of South African rand, Euro, US dollar. Currency market with green and red digital animation of prices in financial and ecomonic crisis
00:20
HD
A professional businessman dressed in a suit stands confidently in a modern office, with holographic graphs and charts illustrating innovative cost reduction strategies. Qubit
00:12
HD
Palau Oil Price Falling with Oil Barrels Downward Green Arrow and 3D Financial Data Visualization Graphs for Economy and Business Concept
00:11
HD
Deflation Neon Text Animation Design
00:10
HD
A vibrant semi-circular meter with a needle indicating power levels from low to against a stark black backdrop. power level text or word low and medium to high meter concept.
00:10
HD
Digital cityscape with financial symbols and CO2 reduction animation
00:10
HD
Poland Oil Prices Decline with Oil Barrels, Gold Coins and Downward Green Arrow, 3D Economic and Financial Market Concept
00:11
HD
Interest rate increase concept. Businessman use a Neon up arrow with percentage symbols and upward arrows, symbolizing rising interest rates. financial growth, dividend yield,
00:10
HD
Abstract decrease icon on black background. Dollar rate up looped icon. Reduce costs sign and symbol.4k video
00:08
HD
Animated self drawing of continuous line design of money sacks and diagrams. Money bag with upward arrow representing financial growth. Economic growth decline graph symbol. 4K animation video
00:07
HD
Financial Stock Market Data Display - This video displays financial stock market data with fluctuating figures and trends.
00:08
HD
World Map with Financial Graphs and Red Arrows Indicating Downward Trend Suggesting Global Economic Decline and Financial Data Analysis with Bar Charts and Percentage Figures Highlighting Global
00:10
HD
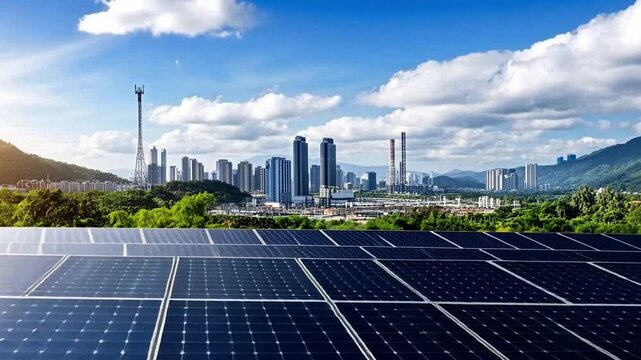
Modern city skyline with solar panels promoting sustainable investment in green energy solutions
00:10
HD
Three-word text animation featuring Expand Your Operations with sequential word reveal, spacing reduction effect, and zoom transition in 3840x2160 format.
00:12
HD
Asian business team discussion reusable product in office,start up eco-friendly business,environmental protection,sustainable business model,ESG strategy,team meeting,people work at home concept
00:13
HD
Zoom in and out animation the fox symbol. Large black symbol in the center and four small symbols around. Seamless looped 4k animation on white background
00:12
HD
Buy and sell signals for forex trade on candle stick graph. Stock market. Finance. Business success and growth concept. Loop animation.
00:15
HD
glowing neon Percentage growth and decline icon with up and down arrows. financial, business, and statistical analysis. Up and down percentage arrows icon. Perfect for reports and dashboards 4k.
00:10
HD
Glowing Neon Percentage Growth and Decline Icon Animation with Up and Down Arrows on Black Background, Financial Business Statistics, 4K Motion Graphics Loop..
00:10
HD
Spinning gold coin stack with rising and falling arrows
00:10
HD
 blue line graph showing a downward trend with percentage and dollar symbols indicating cost analytics and financial reduction on a dark grid background .4k
00:10
HD
A robotic hand points towards a digital representation of a cost percentage and a data graph, illustrating the intersection of technology and financial analysis in a corporate environment. Synapse
00:12
HD
Haiti Oil Price Falling with Oil Barrels Downward Green Arrow and 3D Financial Data Visualization Graphs for Economy and Business Concept
00:11
HD
Colorful Stock Market Graph with Candlestick Chart and Data Lines
00:05
HD
Businessmen crowd forming arrow shape pointing down, hd, against white
00:29
HD
In school, animation showing green bar graph with downward trend arrow for finance
00:14
HD
Kyrgyzstan Oil Prices Decline with Oil Barrels, Gold Coins and Downward Green Arrow, 3D Economic and Financial Market Concept
00:11
HD
Female researcher engineer touched screen, various animated Stock Market charts and graphs. Increase line. Artificial Intelligence
00:21
HD
Close up footage with the quick control radio buttons near the steering wheel of a car, and a hand adjusting the volume.
00:06
HD
Trading screen, stock market, stock index data, commodities, currency exchange rates. Charts and spreadsheets with market information, business, analyzing, financial figures. 3D animation
00:12
HD
Cost Reduction Business Growth Motion Graphics Line Chart Arrow Down Concept, Financial Loss Analysis, Budget Cut Optimization, Downward Arrow Graphic with Text Animation on Black Background.
00:10
HD
Escalator conceptual design engulfed in climbing plants, depicting the union of natural elements and corporate infrastructure. Corporate carbon reduction
00:10
HD
Animated digital gauge shows co2 meter level increasing gradually from low to high critical level, meter turns green, yellow, orange and finally red, digital HUD screen
00:18
HD
Three-word text animation featuring Grow With Consistency with sequential word reveal, spacing reduction effect, and zoom transition in 3840x2160 format.
00:12
HD
Glowing purple neon continuous line forming up and down arrows isolated on black background, perfect for finance, trade, and data exchange concept.
00:10
HD
Abstract decrease icon on white background. Royal blue dollar rate down looped icon. Reduce costs sign and symbol.
00:06
HD
Rapid change of stock market with Exchange and bid, offer, volume on screen display
00:14
HD
Stressed businessman holding hands on head while stock market value decrease
00:09
HD
Stock market tickers with digital animation of the evolution of stock market prices. Normal financial chart of stock exchange data with up and down in the world stock - 4K animation
00:15
HD
Cryptocurrency market candle chart price action. Computer screen close up
00:15
HD
Animated flat style graphic of a laptop screen with a red downward arrow and a gold coin with a dollar sign, representing online financial loss, decreasing profits, or negative economic
00:08
HD
Cost reduction and cost saving through digital transformation, business cost optimization, operational cost reduction, financial savings, and resource efficiency strategies for business success. Muxer
00:16
HD
Bahamas country flag and bar chart graph showing decreasing values a red arrow economic crisis concept. Flag of Bahamas
00:11
HD
Animated business data visualization bar chart purple pink neon grid background. Animated bar graph chart data visualization business finance purple pink neon 4k loop.
00:09
HD
Fading in translucent data panels animating line graphs and bar charts in office displaying metrics
00:05
HD
Zoom in and out animation the yin yang symbol. Large black symbol in the center and four small symbols around. Seamless looped 4k animation on white background
00:12
HD
Guinea-Bissau Oil Prices Decline with Oil Barrels, Gold Coins and Downward Green Arrow, 3D Economic and Financial Market Concept
00:11
HD
Increase economic graph. 3D Bar Chart 2.(included alpha)
00:15
HD
Cost and quality control concept.quality 40 % . Successful organization strategy and management.
00:13
HD
Graph and numbers in stock market. Success and growth concept. Business candle stick graph. Abstract finance on screen display. Loop animation.
00:15
HD
Neon business graph Profit and cost future concept up business graph icon animated Success , profit, growth concept
00:10
HD
Stock charts and green moving average with market data moving up. Trading, business, market research, investment, finanical data and information. 3D animation
00:24
HD
Neon line Cost Effective concept button on a futuristic computer screen. abstract technology background with rotating world map icon, Business, Technology, Internet and networking concept.
00:10
HD
Dynamic financial data visualization with green bars and lines
00:14
HD
Stacks of coins and gold bars word inflation. Decrease in price of gold in trade and savings in crisis recession
00:07
HD
"Neon Upward Graph Arrow Animation – Glowing Green Business Growth Chart on Black Background"
00:10
HD
Multicolored candy sweets arranged in shape of 1.4 percent on white
00:10
HD
Graphic animation of battery charging and percentage increasing from zero to one hundred on a black background. When charging, the battery changes color from red to white. 4K video. 60 fps
00:15
HD
Hangover, headache, fever, Sad woman at workplace in evening works at computer and has pain in her head, she leans cold glass of water to her head. Slow motion
00:41
HD
money stack on table, Wealth Increasing and Decreasing - Global Financing
00:05
HD
A glowing light bulb on a blue background, with an upward graph line representing growth or innovation.
00:05
HD
A robotic hand highlights the contrast between rising quality and falling costs in a sleek office environment, symbolizing the transformative power of technology in business. Auvana
00:12
HD
Bahrain country flag and bar chart graph showing decreasing values a red arrow economic crisis concept. Flag of Bahrain
00:11
HD
Money loss concepts. Cash down, arrow and dollar stocks graph, market fall. neon down arrow stocks graph with black background
00:10
HD
Property Tax Real Estate Sign Home for Sale House 3d Animation
00:08
HD
Zoom in and out animation the shorts symbol. Large black symbol in the center and four small symbols around. Seamless looped 4k animation on white background
00:12
HD
Egypt Oil Prices Decline with Oil Barrels, Gold Coins and Downward Green Arrow, 3D Economic and Financial Market Concept
00:11
HD
Abstract 3D number 1962 text animation floating against a deep black void offering a vibrant and modern visual for the year with a sense of digital energy. 4k motion video.
00:10
HD
A vibrant semi-circular meter with a needle indicating power levels from low to against a stark black backdrop. power level text or word low and medium to high meter concept.
00:10
HD
Financial stock market numbers. Business success and growth concept. Monochrome. Abstract economy data on screen display. Loop animation.
00:15
HD
Woman in suit with holographic world map and financial graph
00:08
HD
Human with control quality and cost optimization, price and value, product and services to improve customer,  marketing.management quality
00:10
HD
two direction arrow icon animated video
00:07
HD
A digital table of stock market values, company indices are developing, growing and / or decreasing.
00:11
HD
Closeup view of hand crosses out SALE on black chalkboard background. End of discount, special rate offer, promotion announcement, advertising, tax cut, tariffs increase, off season price decrease
00:06
HD
Indicator shows fund decreasing from high to low, fund gauge animation, business crisis, financial crisis, investment risk, money loss, fund dropping. Copy space.
00:20
HD
A man is made of leaves and branches walking forward. ESG Environmental, social, and governance, carbon reduction decarbonization net zero and climate change
00:10
HD
Red downward trend graph
00:08
HD
Smart Eco rooftop passive AI solar Save the planet earth in Net zero ESG SDGs plant go green world global low CO2 emission. Future growth Panels cells roof grid sun light electric power supply panel.
00:10
HD
Testosterone level meter showing progress from beginner low blue zone to expert high red zone. Testosterone level speedometer gauge with low and high levels. 4k video animation
00:10
HD
Market Volatility: A red line representing financial fluctuations dramatically charts the ups and downs, with grid lines hinting at market analysis and data trends.
00:10
HD