A link to set your password has been sent to: To access your purchases in the future you will need a password.
Create without limits — unlimited downloads, plus powerful AI editing
New filters added
Sort by

19,768 results for increase and decrease in videos

Net zero goals and CO2 reduction strategy driving sustainability, green energy integration, net zero emissions policies, and climate-friendly sustainability solutions for business and society. Muxer
00:12
HD
Panama Oil Price Falling with Oil Barrels Downward Green Arrow and 3D Financial Data Visualization Graphs for Economy and Business Concept
00:11
HD
word LOSS dips letter by letter as a red downward graph line draws beneath it and ends in a descending arrow. Useful for financial loss with a transparent alpha channel for compositing
00:08
HD
Financial consultant helping clients with personal debt reduction plans. Managing budgets. And calculating interest rates for loan payments and mortgage planning. Depicted as a comprehensive strategy
00:17
HD
Zigzag line with a downward arrow falling trend loss decline and negative business direction animation
00:06
HD
Oman Oil Prices Decline with Oil Barrels, Gold Coins and Downward Green Arrow, 3D Economic and Financial Market Concept
00:11
HD
Seamless loop digital finance counter. Muted red and off-white colors with a forward zoom impact at $0 and $1000. Condensed typography on green screen.
00:12
HD
Business interface displaying stock market graph charts with rising and falling indicators, financial analytics dashboard 4k video
00:15
HD
probability level indicator scale. Low normal & high meter infographic animation. Showing high probability level color gauge indicator. on a white background 4k animation video
00:10
HD
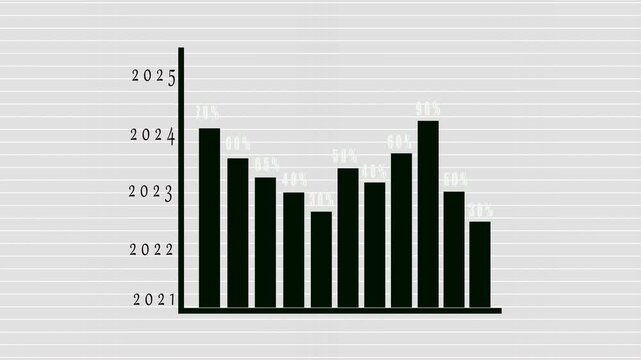
Bar graph animation business data growth financial report statistics infographic motion graphics modern. Business data animated bar graph chart growth financial statistics success report.
00:06
HD
Increasing counting number 0 to 100k for price like views figures or amount concepts .4k motion graphics video animation
00:10
HD
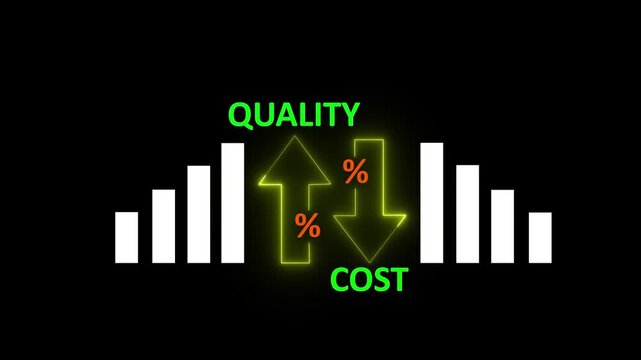
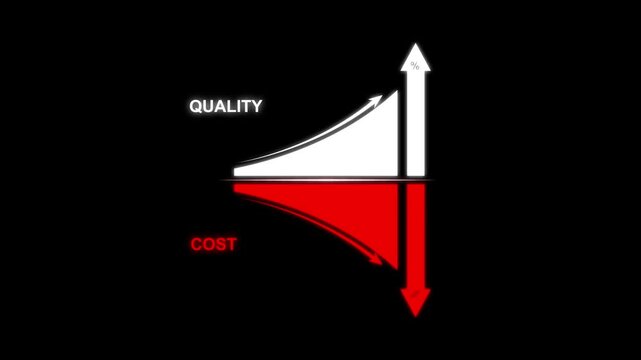
Glowing quality and cost control concept on transparent background. Successful organization strategy and management quality control. Percentage icon of quality with up arrow and cost with down arrow
00:10
HD
Reduce working day to increase efficiency and productivity, flexible work day for employee benefit.  Business animation video
00:06
HD
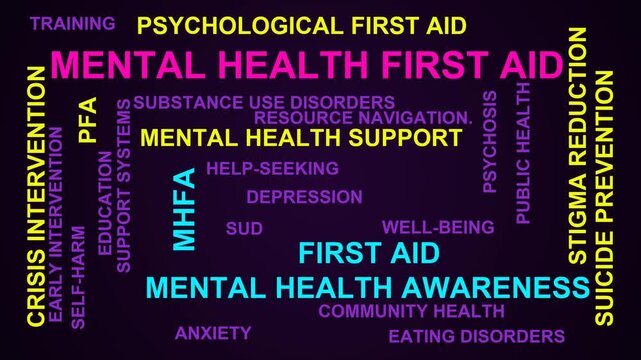
Mental Health First Aid Word Cloud
00:11
HD
Business Person Calculating Financial Budget and Debt Reduction Strategy
00:15
HD
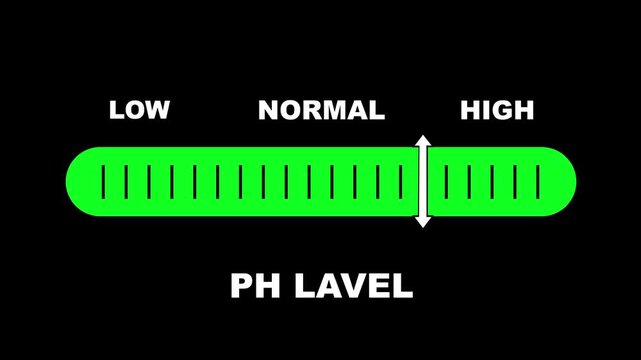
PH level indicator scale. Acidic Neutral Alkaline Low normal high stress meter infographic animation on black background. Animation showing high pH level color gauge indicator for health monitoring

00:10
HD
dollar up and down arrow animation, money icon, dollar sign, up and down arrows, 4k video.
00:10
HD
Business graph chart with growing business concept. Abstract decreasing business graph chart animation  background.
00:10
HD
Downward zigzag arrow symbolizing decline loss or falling trend animation
00:05
HD
Glowing Neon Percentage Growth and Decline Icon Animation with Up and Down Arrows on Black Background, Financial Business Statistics, 4K Motion Graphics Loop..
00:10
HD
A robotic hand points towards a digital representation of a cost percentage and a data graph, illustrating the intersection of technology and financial analysis in a corporate environment. Synapse
00:13
HD
France Oil Price Falling with Oil Barrels Downward Green Arrow and 3D Financial Data Visualization Graphs for Economy and Business Concept
00:11
HD
Sales funnel infographic showing lead conversion and cost reduction
00:06
HD
Comparing financial profit and cost using graphs, charts, and icons of income, expenditure, analysis, and investment for strategic business planning and budget management
00:17
HD
Animated Brightness Slider UI Moving from Low to High
00:09
HD
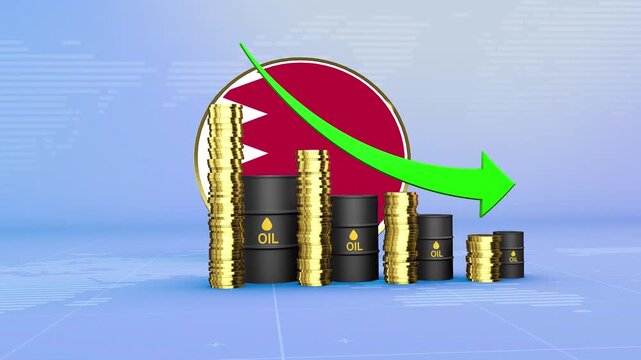
Bahrain Oil Prices Decline with Oil Barrels, Gold Coins and Downward Green Arrow, 3D Economic and Financial Market Concept
00:11
HD
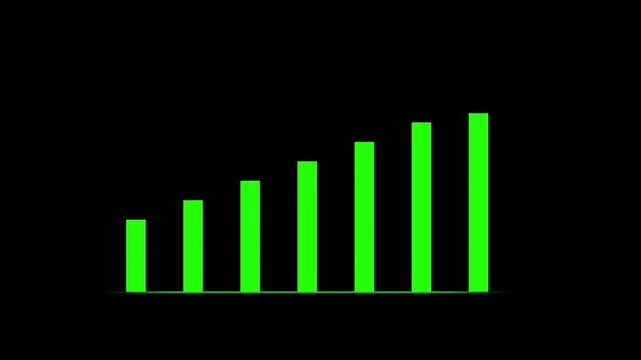
A vibrant and modern bar chart featuring five bright green vertical bars of varying heights against a deep black background, effectively illustrating data trends, growth, or performance metrics
00:10
HD
Animated digital blue bar chart showcasing business decrease Bar chart growth analysis with upward trend projection sand market trends.
00:10
HD
water pollution level indicator scale. Low normal & high meter infographic animation. Showing high water pollution level color gauge indicator. on a white background 4k animation video
00:10
HD
Vibrant 3D graphic illustration of '11
00:08
HD
Price drop announcement with original and sale price displayed on a modern interface with red background and radial
00:10
HD
Animated financial chart with falling bars coins and magnifying glass on green screen
00:05
HD
Quality vs Cost Comparison Chart with Business Decision Making and Performance Analysis Concept on Black Background..
00:10
HD
Arrow up business graph icon animation. Increasing business growth chart animation. Going up business graph concept.
00:07
HD
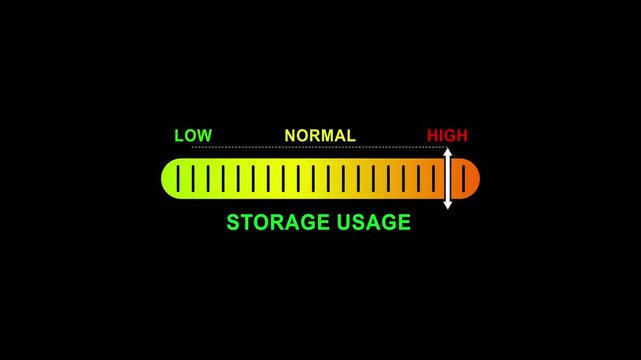
storage usage level indicator scale. Low normal high meter infographic animation on black background. Showing high pressure level color gauge indicator.4k animation video
00:10
HD
Animated green bar chart growing with video animated business
00:06
HD
Global financial market crash with downward arrow and graph on digital red grid background showing crisis and economic collapse impact concept- 4k black background icon animation
00:10
HD
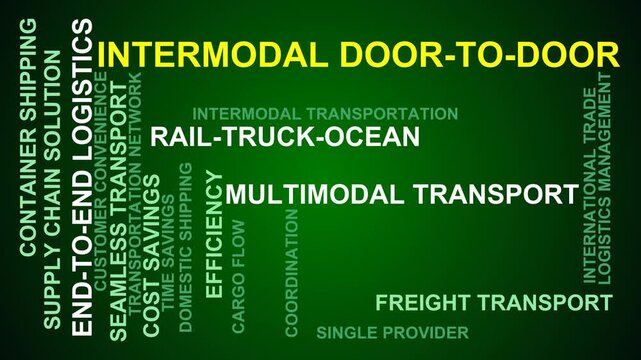
Intermodal Door-To-Door Word Cloud
00:11
HD
Zoom in and out animation the shopping basket symbol. Large black symbol in the center and four small symbols around. Seamless looped 4k animation on white background
00:12
HD
Glowing up and down arrows animation displays download metrics. Fast broadband internet speeds track with the up and down arrows. Digital data transfer rates drive these up and down arrows.
00:10
HD
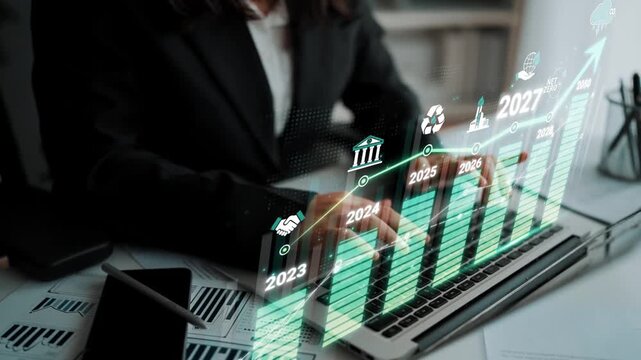
Business professional analyzing financial growth with digital charts and projections for future years in modern office setting Sigmoid
00:10
HD
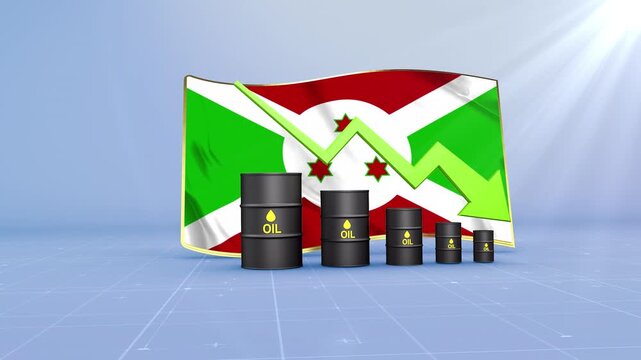
Burundi Crude Oil Price Drop with Oil Barrels Downward Green Arrow and 3D Financial Data Visualization Graphs for Economy and Business Concept
00:11
HD
Mold level indicator scale. Low Normal High meter infographic animation on black background. Animation showing high mold level color gauge indicator for air quality and health safety monitoring.
00:10
HD
Investment portfolio diversification concept showing various assets, financial instruments, and strategic management for risk reduction and optimizing returns
00:17
HD
security level indicator scale. Low normal & high meter infographic animation. Showing high security level color gauge indicator. on a black background 4k animation video
00:10
HD
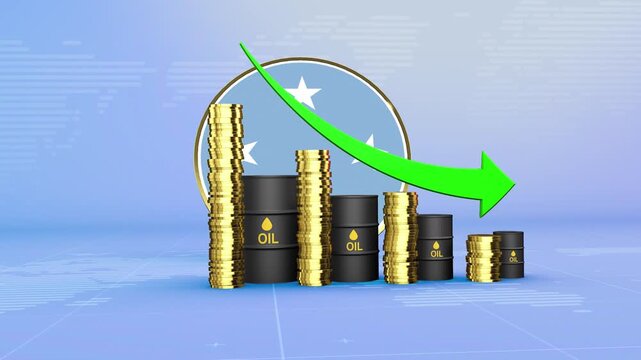
Micronesia Oil Prices Decline with Oil Barrels, Gold Coins and Downward Green Arrow, 3D Economic and Financial Market Concept
00:11
HD
Vibrant Green Digital Marketing Promotional Graphics for Seasonal Retail Shopping Events and Massive Discount Sales Campaigns
00:06
HD
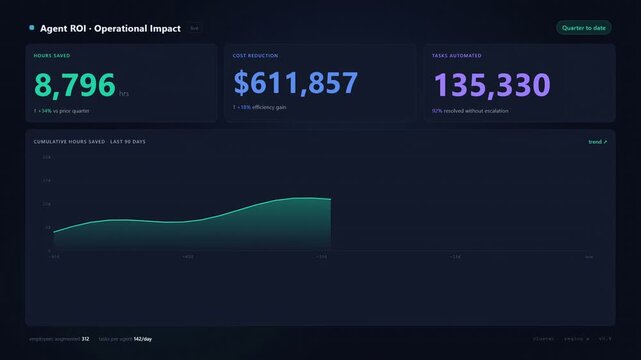
Animated Agent ROI & Operational Impact Dashboard UI. Dark mode interface showing hours saved, cost reduction, tasks automated counters, and cumulative growth charts.
00:15
HD
Percentage Sign Rain Alpha Channel Finance Motion Graphic Percentage signs fly float on transparent background. Sale campaigns discounts financial data interest rates taxes taxes inflation business gr
00:15
HD
Zigzag line with a downward arrow falling trend loss decline and negative business direction animation
00:06
HD
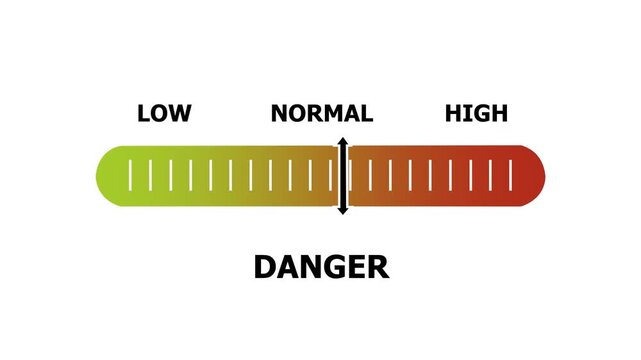
danger level indicator scale. Low normal & high meter infographic animation. Showing high danger level color gauge indicator. on a white background 4k animation video
00:10
HD
Speaker Volume Level Animation. Volume Sound Control Animation on Black Background, Audio Level Up and Down Icon.
00:10
HD
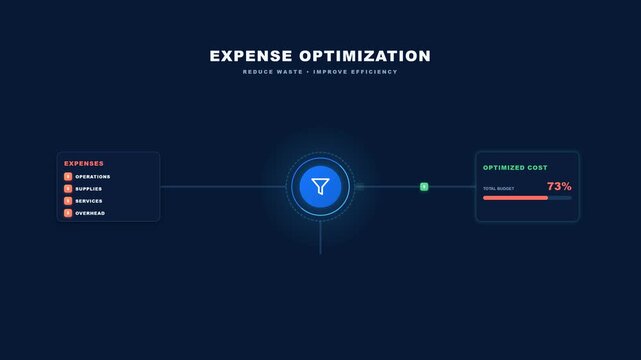
Expense Optimization abstract concept with filter and progress bar.
00:08
HD
White downward arrow for cost and upward arrow for with percentage symbols on a solid black background for business performance analysis
00:10
HD
hydration index level indicator scale. Low normal high meter infographic animation on black background. Showing high pressure level color gauge indicator.4k quality animation video
00:10
HD
Reuse level indicator scale. Low Normal High meter infographic animation on black background. Showing high reuse level color gauge indicator.
00:10
HD
Glowing green neon continuous line forming up and down arrows isolated on black background, perfect for finance, trade, and data exchange concept.
00:10
HD
Bright white 3D number 2036 text animation floating against a deep black void offering a vibrant and modern visual for the year with a sense of digital energy.
00:10
HD
Cost Reduction Business Growth Motion Graphics Line Chart Arrow Down Concept, Financial Loss Analysis, Budget Cut Optimization, Downward Arrow Graphic with Text Animation on Black Background.
00:10
HD
Green arrow pointing down over a dollar sign icon on a black background
00:10
HD
Net zero goals and CO2 reduction strategy driving sustainability, green energy integration, net zero emissions policies, and climate-friendly sustainability solutions for business and society. Muxer
00:12
HD
Bangladesh Crude Oil Price Drop with Oil Barrels Downward Green Arrow and 3D Financial Data Visualization Graphs for Economy and Business Concept
00:11
HD
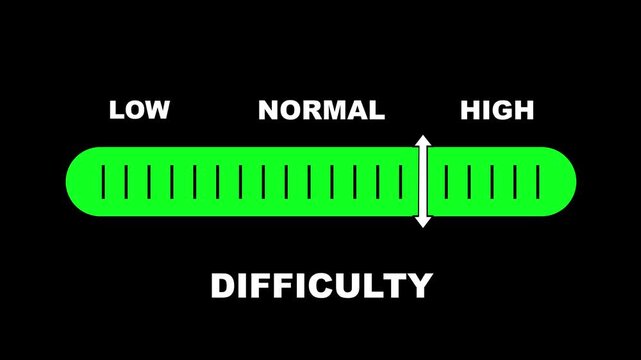
Difficulty level indicator scale. Low normal high meter infographic animation on black background. Showing high difficulty level color gauge indicator for skill assessment and performance monitoring.
00:10
HD
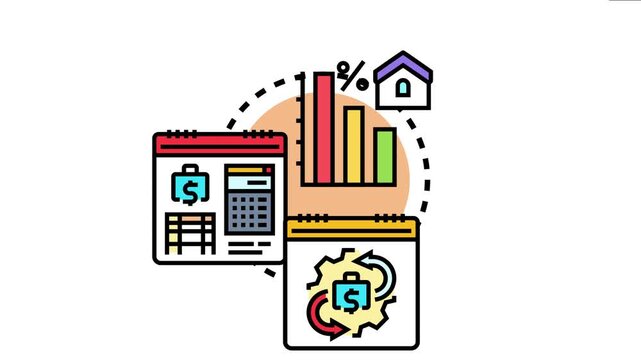
Financial management concept annual expense decrease with calendars, calculator, bar chart showing reduction, and a house, representing smart financial planning and cost optimization
00:17
HD
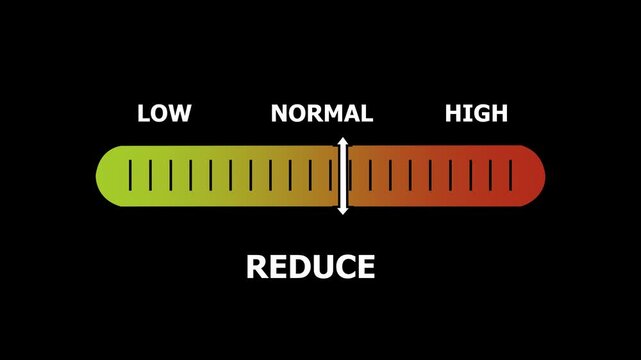
reduce level indicator scale. Low normal & high meter infographic animation. Showing high reduce level color gauge indicator. on a black background 4k animation video
00:10
HD
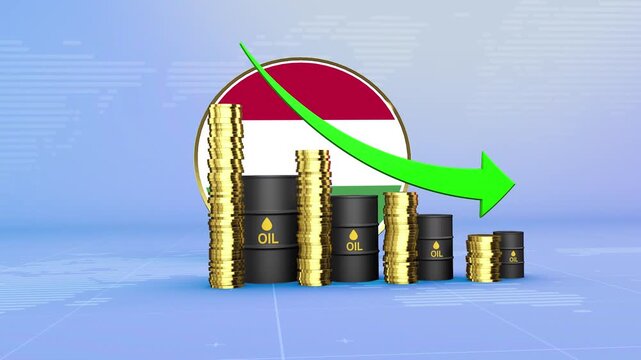
Hungary Oil Prices Decline with Oil Barrels, Gold Coins and Downward Green Arrow, 3D Economic and Financial Market Concept
00:11
HD
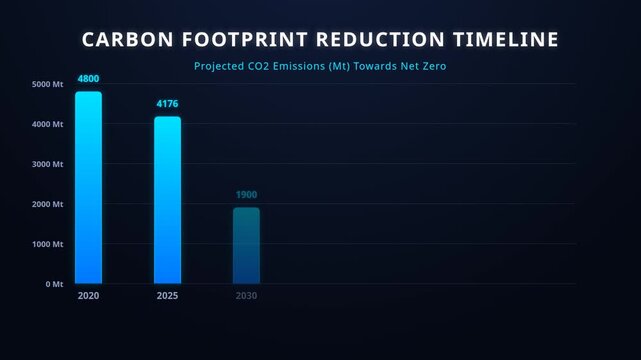
Carbon footprint reduction timeline chart with projected co2 emissions towards net zero target, for climate change strategy, environmental sustainability, global warming mitigation, green
00:20
HD
Down arrow business graph chart animation. Loss business graph icon animation.  on black background. 4k video
00:10
HD
Health Bar
00:06
HD
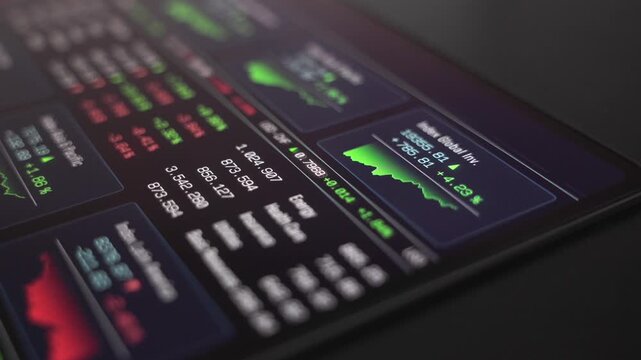
Close-up laptop screen, trading board, stock market data, index chart up and down, price information. Financial market, sector data, trading volume, investment, bull market, chart moving up.
00:09
HD
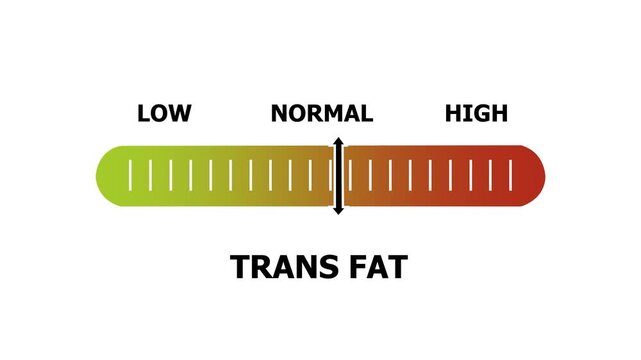
trans fat level indicator scale. Low normal & high meter infographic animation. Showing high trans fat level color gauge indicator. on a white background 4k animation video
00:10
HD
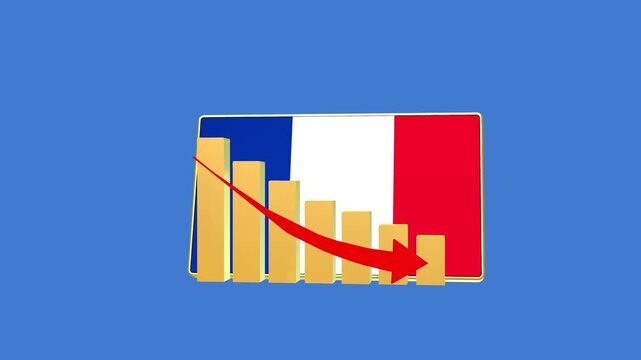
France economic bar chart graph showing decreasing downturn with national Flag 3D animation on black background.
00:16
HD
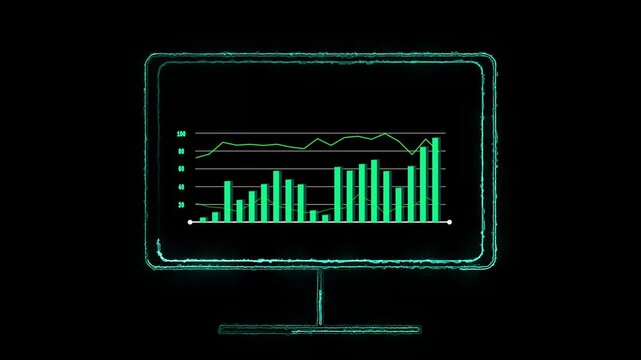
Glowing neon monitor displaying green bar and line graphs. Analytical glowing neon monitor displaying green bar for sales optimization data. Professional glowing neon monitor displaying green bar.
00:10
HD
Animated self drawing of continuous line design of money sacks and diagrams. Money bag with upward arrow representing financial growth. Economic growth decline graph symbol. 4K animation video
00:07
HD
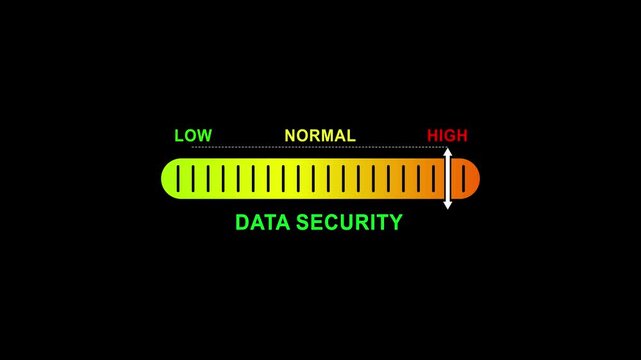
data security level indicator scale. Low normal high meter infographic animation on black background. Showing high pressure level color gauge indicator.4k animation video
00:10
HD
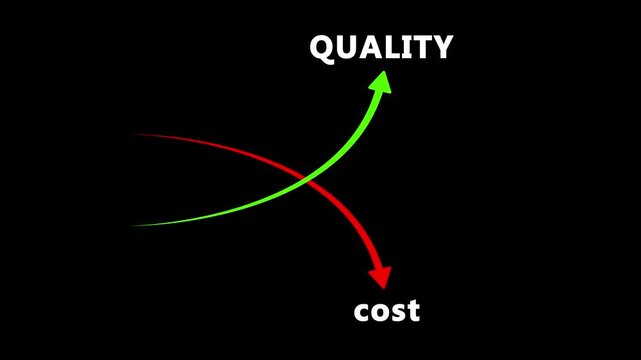
Business optimization concept showing quality increasing and cost decreasing with animated arrows
00:10
HD
Animated white line graph arrow pointing downwards on black background, for financial analysis, and market trend presentation
00:10
HD
Bright white 3D number 2019 text animation floating against a deep black void offering a vibrant and modern visual for the year with a sense of digital energy.
00:10
HD
Business Profit and Loss Chart Animation
00:06
HD
Cost control and quality improvement concept. Red bar chart with line graph showing cost reduction and improving quality. Successful business strategy, efficiency, product optimization and management
00:06
HD
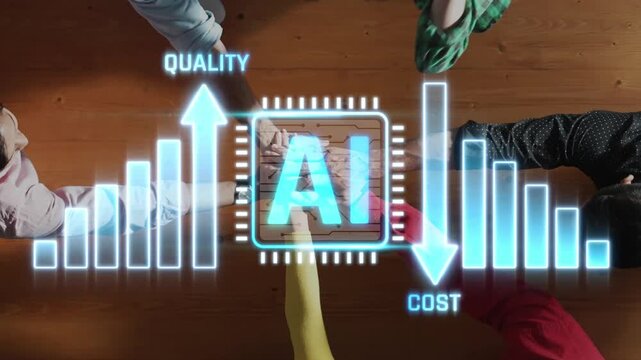
Hands of diverse people reaching toward a digital display of AI metrics illustrating quality and cost fluctuations in technology applications Sigmoid
00:20
HD
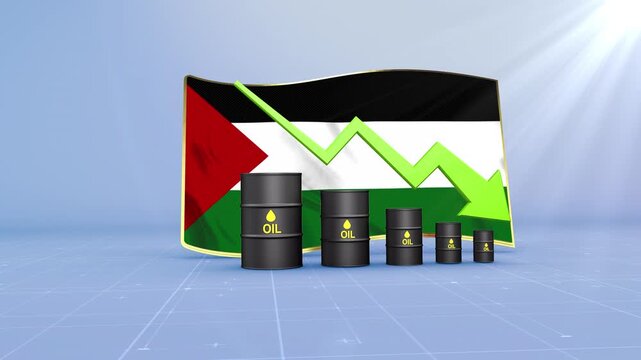
Palestine Oil Price Falling with Oil Barrels Downward Green Arrow and 3D Financial Data Visualization Graphs for Economy and Business Concept
00:11
HD
Reuse level indicator scale. Low Normal High meter infographic animation on black background. Showing high reuse level color gauge indicator for sustainability and eco-friendly practices.
00:10
HD
Business concept showing hand receiving goods, a delivery truck with dollar signs, and a gauge indicating price fluctuations influenced by market supply and economic factors
00:17
HD
Focus level indicator scale. Low normal high meter infographic animation on black background. Showing high focus level color gauge indicator for mental performance and productivity monitoring.
00:10
HD
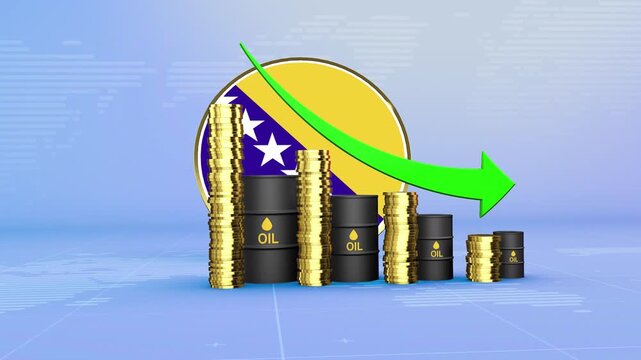
Bosnia and Herzegovina Oil Prices Decline with Oil Barrels, Gold Coins and Downward Green Arrow, 3D Economic and Financial Market Concept
00:11
HD
Financial Growth Graph Animation Featuring Increasing Business Performance Bars
00:07
HD
glowing neon Percentage growth and decline icon with up and down arrows. financial, business, and statistical analysis. Up and down percentage arrows icon.
00:10
HD
Horizontal 4K motion graphic with vertical Portuguese typography appearing word by word using spacing reduction, zoom motion, circular loop rotation, and black and white backgrounds.
00:12
HD
Stock market sector data, trading board, prices and changes, up and down. Financial market, sector data, prices, trading volume, investment information.
00:10
HD
Annual tax reduction planning concept. Person typing on keyboard with calculator, tax form deduction and financial savings icons, smart corporate and personal income tax strategy.
00:10
HD
Futuristic dollar countdown timer animation, glowing dollar symbol integrated with a circular countdown display, numbers decreasing smoothly from 0 to 60,
00:10
HD
Dollar symbol and exchange rate icon for financial concepts. Suitable for finance websites, articles, presentations, and educational materials on economics.
00:06
HD
On opening stock ticker percentages updating, value flashing as yellow line tracing volatility
00:15
HD
SEO Level Text or Word Low and Medium to High Meter Concept Animation on Black Background and Blue Screen
00:58
HD
Animated Multi-Line Financial Growth and Data Comparison Chart
00:10
HD
Solar panels on modern skyscraper rooftops at sunset reflecting city skyline promoting clean energy solutions and environmental pollution awareness
00:05
HD
Multicolored 3d bar chart illustrating a declining financial trend and negative growth on a transparent background
00:05
HD
A semicircular gauge a color spectrum from red to green indicating danger levels from low to with a needle pointing towards the midium range on a black background. danger level text or word low...
00:10
HD
Bright white 3D number 2035 text animation floating against a deep black void offering a vibrant and modern visual for the year with a sense of digital energy.
00:10
HD