A link to set your password has been sent to: To access your purchases in the future you will need a password.
Create without limits — unlimited downloads, plus powerful AI editing
New filters added
Sort by

19,768 results for increase and decrease in videos

Zoom in and out animation the capital letter C symbol. Large black symbol in the center and four small symbols around. Seamless looped 4k animation on white background
00:12
HD
A businessman analyzes key quality and cost indicators using a digital graph displayed on a tablet, emphasizing growth and strategic decision-making in a dark setting. Qubit
00:12
HD
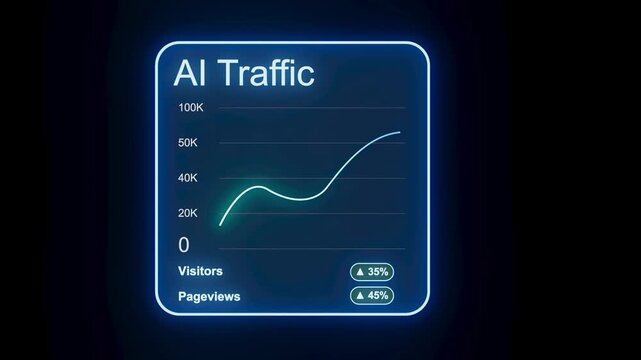
Graph displays AI traffic data with numbers for visitors and pageviews. The design has a blue background with a simple line showing trends.
00:10
HD
Profit high growth percent icon, stocks, financial, Interest rate and dividend concept. Glowing neon line animated graph and chart with percentage icon on a black background. 4k
00:10
HD
Hand Manipulating Graphs Warning Signs Indicating Financial Decline and Caution in Business Statistics Analysis
00:10
HD
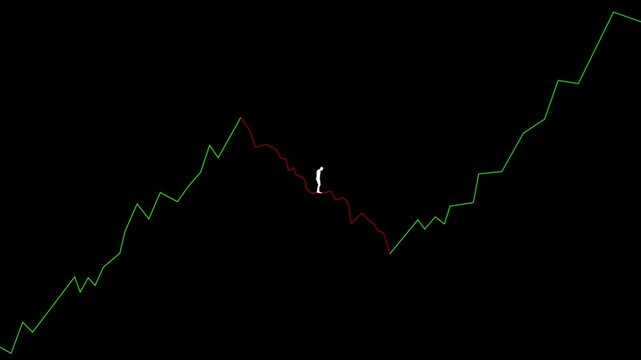
White silhouette of a businessman walking on a fluctuating stock market chart, initially decreasing and then increasing, symbolizing market volatility and uncertainty
00:08
HD
Animation of a dynamic graph with fluctuating data point
00:15
HD
Business grow-ting arrow. Rising bar follow the arrow. Abstract neon arrow growth , success concept. Profit growing icon animation.
00:07
HD
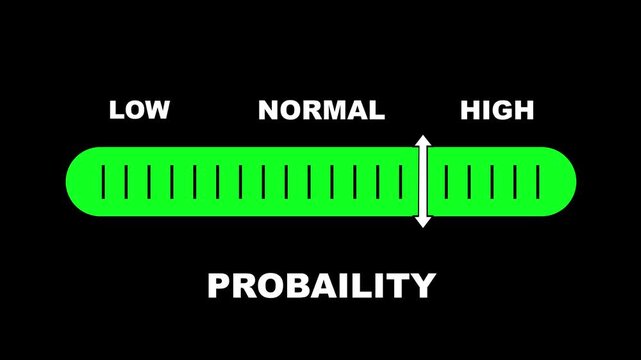
Probability level indicator scale. Low Normal High meter infographic animation on black background. Animation showing high probability level color gauge indicator for statistical analysis and outcome.
00:10
HD
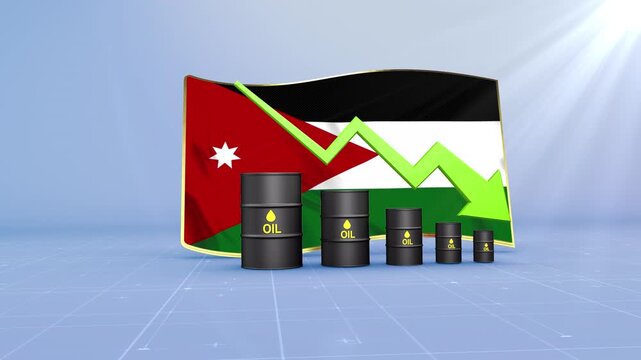
Jordan Oil Price Falling with Oil Barrels Downward Green Arrow and 3D Financial Data Visualization Graphs for Economy and Business Concept
00:11
HD
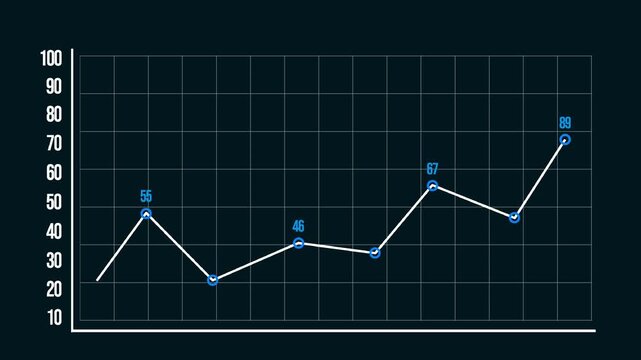
Glowing Graphic Chart Animation for Cryptocurrencies or Financial Parameters Indicator Background Stock Video with overlay alpha channel -  4K Blue Background.
00:16
HD
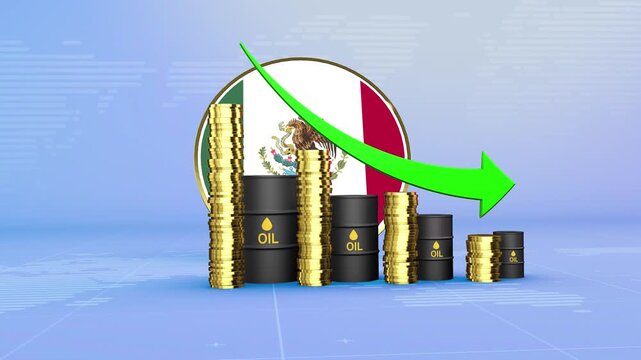
Mexico Oil Prices Decline with Oil Barrels, Gold Coins and Downward Green Arrow, 3D Economic and Financial Market Concept
00:11
HD
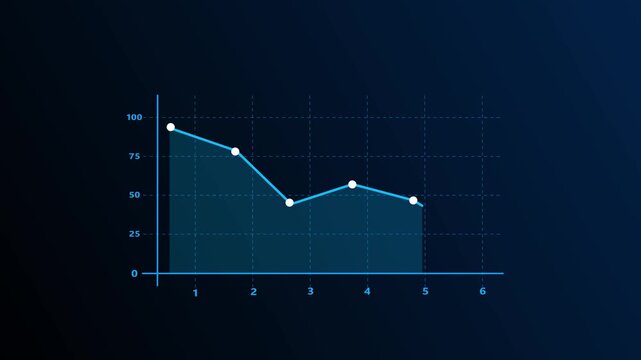
Modern line graph displays falling investment market trends. Technical line graph monitors negative corporate revenue data. Financial crisis concept with digital line graph.
00:10
HD
Down indicator arrow downward showing loss or negative growth. Suitable for financial concepts, presentations, infographics, and businessrelated designs.
00:10
HD
Three word kinetic typography sequence displaying The Unique Experience with sequential letter spacing reduction and sharp zoom transition
00:12
HD
Sustainable growth concept with green graph, wind turbines, solar panels, and wooden blocks.
00:07
HD
Cost 2026business finance concept. Businessman cost reduction icon with down arrow for budget management and 4k Animation video
00:10
HD
graph chart up down business statistics
00:07
HD
Blue neon Up and down arrow icon representing bidirectional movement, data transfer, upload and download, exchange, navigation, switching, workflow, financial transactions, and directional change.
00:10
HD
cyber threat level indicator scale. Low normal high meter infographic animation on black background. Showing high pressure level color gauge indicator.4k animation video
00:10
HD
Red chart background glows with financial data. White and orange candlesticks show market movements. Green and yellow lines track rising and falling trends
00:10
HD
A pair of hands holding a glowing digital interface featuring graphs and icons representing cost reduction and business efficiency strategies in a modern setting. Qubit
00:14
HD
Appetite changes impacting a person, showing an upward arrow for increased hunger and a downward arrow with a stop sign for decreased desire to eat, depicting health conditions
00:17
HD
White arrows rise upward, flanked by percentage symbols
00:10
HD
calcium level indicator scale. Low normal & high meter infographic animation. Showing high calcium level color gauge indicator. on a white background 4k animation video
00:10
HD
Illicit trade of Opioids tramadol and oxycodone or oxy is significant public health danger. Supplies contaminated with potent synthetic fentanyl. Counterfeit pills increases risk of fatal overdose.
00:20
HD
Animation of a dynamic graph with fluctuating data point
00:15
HD
Business optimization, Cost reduction and Quality control, Animation of data processing and media icons over digital human spinning Future crypto. banking Detection. Augmented Reality.
00:10
HD
Animated down graph icon designed business or finance concept icon. business loss graph show chart.
00:06
HD
Kazakhstan Oil Price Falling with Oil Barrels Downward Green Arrow and 3D Financial Data Visualization Graphs for Economy and Business Concept
00:11
HD
Discount Percentage Badge Motion Icon for Promo Offer Sale Pricing Deal Marketing Campaign Fintech Transparent Alpha Channel
00:06
HD
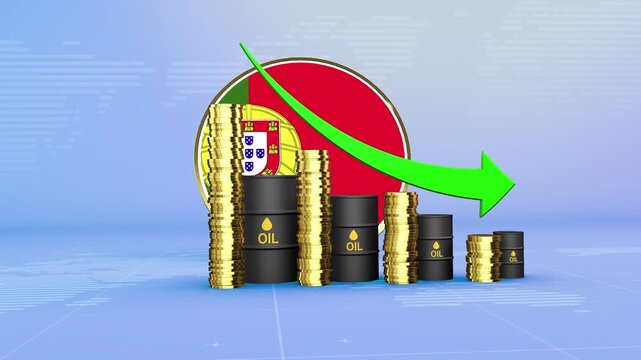
Portugal Oil Prices Decline with Oil Barrels, Gold Coins and Downward Green Arrow, 3D Economic and Financial Market Concept
00:11
HD

A grand stock market chart background with blue and red glowing candlestick graph lines for a financial business concept,
00:10
HD
Abstract 3D number 1981 text animation floating against a deep black void offering a vibrant and modern visual for the year with a sense of digital energy. 4k motion video.
00:10
HD
Three word kinetic typography sequence displaying Educate and Sell with sequential letter spacing reduction and sharp zoom transition
00:12
HD
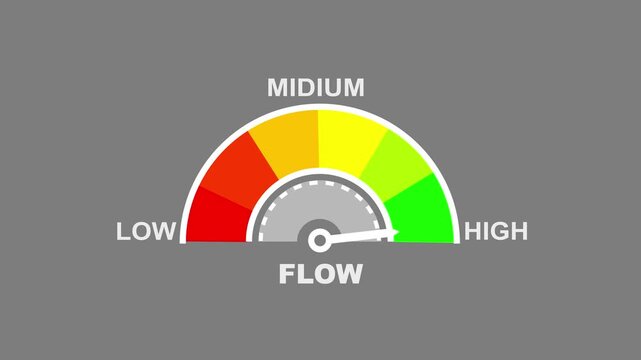
FLOW Level Text or Word Low and Medium to High Meter Concept Animation on Black Background and black Screen. a medium level of flow with labels low and on either side against a stark.
00:10
HD
Line graph
00:15
HD
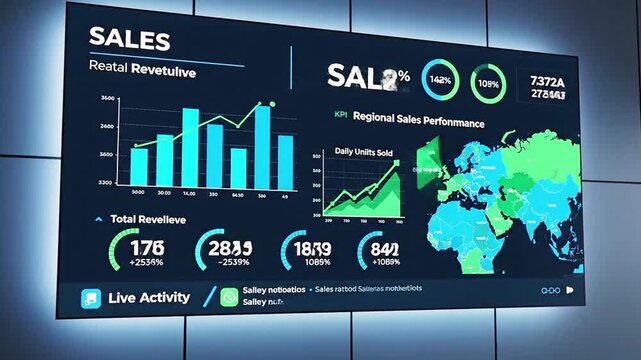
A screen displaying sales data, including charts, graphs, figures, and a world map
00:09
HD
Zoom in and out animation the top symbol. Large black symbol in the center and four small symbols around. Seamless looped 4k animation on white background
00:12
HD
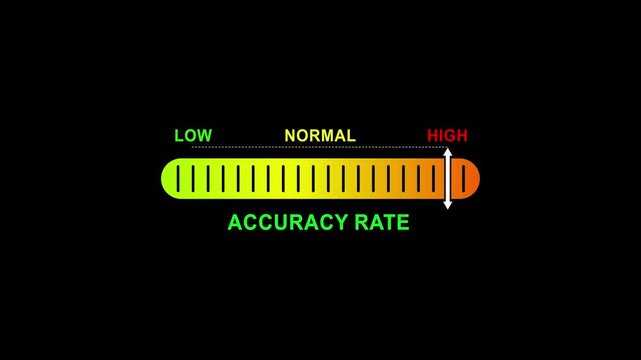
accuracy rate level indicator scale.Low normal high meter infographic animation on black background. Showing high pressure level color gauge indicator for health monitoring and safety analysis.4k
00:10
HD
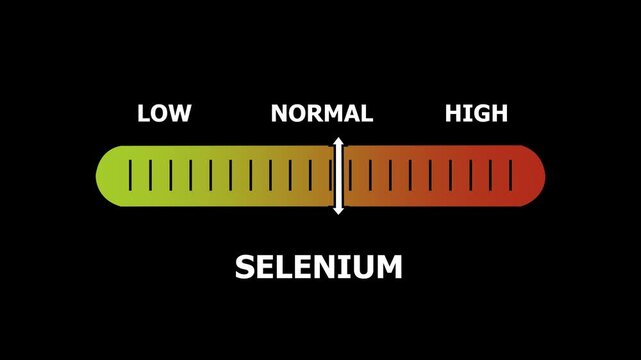
Selenium level indicator scale. Low normal & high meter infographic animation. Showing high selenium level color gauge indicator. on a black background 4k animation video
00:10
HD
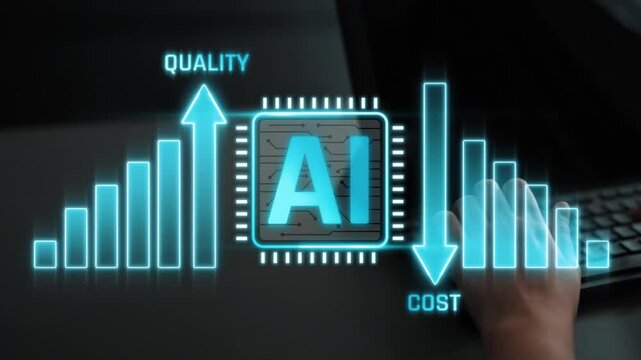
Charting Growth and Cost Efficiency with AI Technology in Business Graphs and Visualizations Sigmoid
00:10
HD
Hand change wood cube block with GOLD text to UP and Down arrow symbol icon.price, down and up, decrease and increase, cut loss, stocks, financial and economic concept
00:07
HD
Green trend line appearing at left axis moving upward and oscillating to highlight grid data trends
00:15
HD
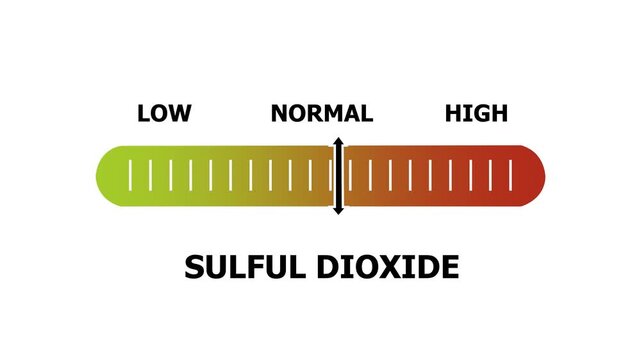
sulful dioxide level indicator scale. Low normal & high meter infographic animation. Showing high sulful dioxide level color gauge indicator. on a white background 4k animation video
00:10
HD
Green Line Graph with Dot on Dark Grid Background point. Highlighted dot on green line graph over dark grid, modern digital chart animation scene.
00:10
HD
Financial Market Decline and Economic Downturn Falling Dollar Value, Decreasing Wealth, Shrinking Investment Returns, Lower Asset Prices, and Increasing Financial Risk
00:10
HD
Dollar sign down arrow with circle animation on white background.4k Video
00:10
HD
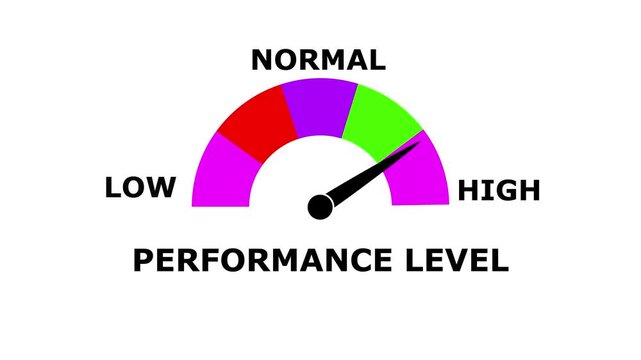
Performance Level Meter Animation: Track and Compare Performance from Low to High Levels with Dynamic Increasing/Decreasing Gauge for Data Visualization, Productivity, and Motion Graphics
00:10
HD
Barbados country flag and bar chart graph showing decreasing values a red arrow economic crisis concept. Flag of Barbados
00:11
HD
Purple bar chart showing downward trend with arrow graph. Financial loss chart for corporate performance failure metrics. Digital bar chart animation for network alert.
00:12
HD
Liberia Oil Prices Decline with Oil Barrels, Gold Coins and Downward Green Arrow, 3D Economic and Financial Market Concept
00:11
HD
Vitality level indicator scale. Low normal & high meter infographic animation on black background. Showing high vitality level color gauge indicator for energy, health, and wellness monitoring
00:10
HD
Abstract 3D number 1958 text animation floating against a deep black void offering a vibrant and modern visual for the year with a sense of digital energy. 4k motion video.
00:10
HD
Three word kinetic typography sequence displaying Innovation Powered AI with sequential letter spacing reduction and sharp zoom transition
00:12
HD
Young woman do yoga sitting green lawn, man meditating sunset, relaxing outdoors, girl relaxing sunset, yoga meditation, positive mental health, emotional balance practice, introspective quiet moment
00:10
HD
GDP economic slowdown stagflation inflation recession deflation crisis finance stock market trends showing financial downturn risks and economic growth uncertainty with declining charts and market
00:05
HD
Visual Breakdown of U.S. Total Debt Data Over Time
00:15
HD
Digital Graph Animation Abstract Motion Data Visualization
00:10
HD
demand level indicator scale. Low normal high meter infographic animation on black background. Showing high pressure level color gauge indicator.4k animation video
00:10
HD
Abstract neon arrow growth , success concept. Profit growing icon animation. Growing business graph symbol animation.
00:10
HD
Net zero goals and CO2 reduction strategy driving sustainability, green energy integration, net zero emissions policies, and climate-friendly sustainability solutions for business and society. Muxer
00:17
HD
Neon percentage icon animation with glowing blue up and down arrows for financial market, interest rate and business analytics.
00:10
HD
Global business line animation. Abstract glowing neon line business graph growth arrow to down arrow.  loss, and negative trends on a dark, abstract background
00:10
HD
fat level indicator scale. Low normal & high meter infographic animation. Showing high fat level color gauge indicator. on a white background 4k animation video
00:10
HD
Stock Market's Fluctuations: Abstract financial data visuals, indicating market trends, with color-coded patterns that reflect business analysis in high definition.
00:05
HD
Cost reduce and high quality control concept. Businessman holding cost with down arrow and quality with up arrow for business with keywords isolated on white board background.
00:10
HD
rising inflation graph with growing stacks of coins representing increasingly expensive prices, global economy struggling after the covid-19 pandemic
00:10
HD
budget planning icon and Business structure of network, financial forecasting tools, expense optimization strategies, cost reduction methods, investment management solutions
00:11
HD
Italy Oil Price Falling with Oil Barrels Downward Green Arrow and 3D Financial Data Visualization Graphs for Economy and Business Concept
00:11
HD
A vibrant display of green LED lights forming the word 'SALE' in a financial setting, highlighting significant price reductions and enticing customers within the trading environment.
00:05
HD
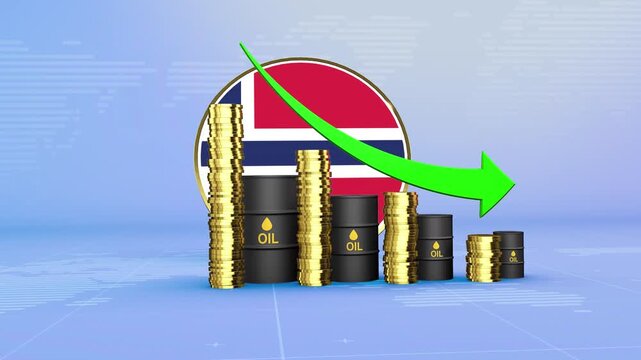
Norway Oil Prices Decline with Oil Barrels, Gold Coins and Downward Green Arrow, 3D Economic and Financial Market Concept
00:11
HD
Performance level indicator scale. Low normal & high meter infographic animation on bblackbackground. Showing high performance level color gauge indicator for business productivity efficiency and work
00:10
HD
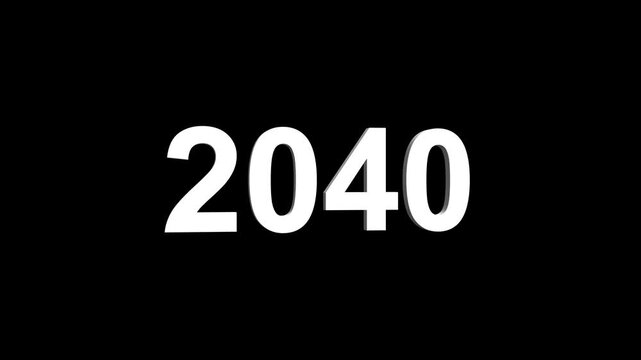
Bright white 3D number 2040 text animation floating against a deep black void offering a vibrant and modern visual for the year with a sense of digital energy.
00:10
HD
Three word kinetic typography sequence displaying Growth With AI with sequential letter spacing reduction and sharp zoom transition
00:12
HD
Business dashboard, financial report, revenue growth, production line and equity information. Geographical data, industry, presentation, slide show, white board, planning, market research.
00:16
HD
A yellow and blue sign with a percent sign on it. The sign is on a table with a blue and gray background
00:05
HD
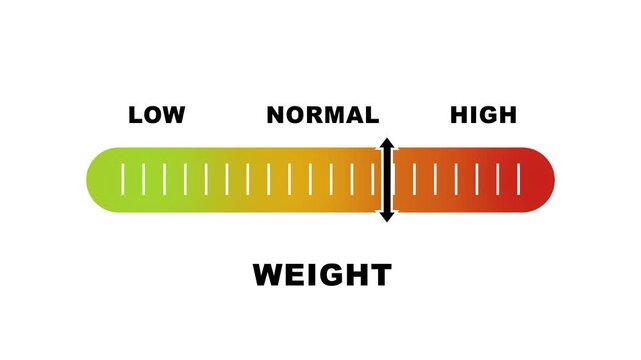
Weight level indicator scale. Low normal & high meter infographic animation on white background. Showing high weight level color gauge indicator for body weight and health monitoring.
00:10
HD
The birth of a new life, green shoots are making their way out of the ground
00:09
HD
Animation of speaker volume with alpha channel, Speaker volume down and up animation with Transparent Background
00:06
HD
neon right two direction arrow icon animated video
00:07
HD
Cost reduction and cost saving through digital transformation, business cost optimization, operational cost reduction, financial savings, and resource efficiency strategies for business success. Muxer
00:15
HD
Animated business infographic chart showing decrease in profits and financial decline. 4k financial diagram with appearing animated descending arrow, bar stats, lines and digital effects. Business
00:05
HD
Stock market chart plummets in red
00:10
HD
Animation of Percent icon and arrow moving downwards, Indicating a price decrease or decrease in revenue target. For finance
00:07
HD
Business graph growth concept in allusive graph chart showing marketing sales profit decreasing to future target. Downfall financial status of corporate business going down.
00:20
HD
Neon business graph chart icon animation background. Neon business growth concept animated. Neon line business graph.
00:10
HD
investment opportunities and building wealth, house icon next to stock market stats with text underneath
00:26
HD
Business Decline Arrow Animation with Downward Graph
00:10
HD
Liechtenstein Oil Price Falling with Oil Barrels Downward Green Arrow and 3D Financial Data Visualization Graphs for Economy and Business Concept
00:11
HD
Cyan Bar Graph with Reflection Showing Downward Trend on Black Background chart rising
00:10
HD
Lithuania Oil Prices Decline with Oil Barrels, Gold Coins and Downward Green Arrow, 3D Economic and Financial Market Concept
00:11
HD
Cockchafer larvae in soil. May beetle larva underground stage of development that feeds on plant roots, leading to stunted growth and crop failure
00:10
HD
Bright white 3D number 2030 text animation floating against a deep black void offering a vibrant and modern visual for the year with a sense of digital energy.
00:10
HD
Three word kinetic typography sequence displaying Activate Your Business with sequential letter spacing reduction and sharp zoom transition
00:12
HD
Arrow animation pointing downward on black.
00:09
HD
Neon style graph illustration with glowing outline and black background for business and data visualization
00:08
HD
Glowing lines and arrows representing financial market data move across a dark background with changing colors, percentages, and dollar signs in a slow motion montage
00:09
HD
Zoom in and out animation the angle brackets symbol. Large black symbol in the center and four small symbols around. Seamless looped 4k animation on white background
00:12
HD
Businessman with Performance Improvement hologram concept
00:35
HD