A link to set your password has been sent to: To access your purchases in the future you will need a password.
Create without limits — unlimited downloads, plus powerful AI editing
New filters added
Sort by

19,768 results for increase and decrease in videos

Downward Trending Bar Chart with Red Arrow on Black Background graph data
00:07
HD
Pixelated bar chart shows downward trend, illustrating financial loss, recession, data analytics, market crash
00:06
HD
business graph icon. Business Loss Graph Symbol Minimal Design. Declining Bar Chart Icon with Downward Arrow
00:06
HD
Neon white color GDP Growth Animation with Rising Arrow Graph  4k video
00:10
HD
arrow down business graph icon animation. business chart concept. A neon down business graph icon graphic concept. animation
00:10
HD
Bar chart glowing in vibrant blue light depicts a decreasing numerical trend with a prominent downward arrow signaling reduced fiscal output or negative profit margins for your professional report.
00:10
HD
Discount percent signs moving on abstract background with dynamic curved lines
00:08
HD
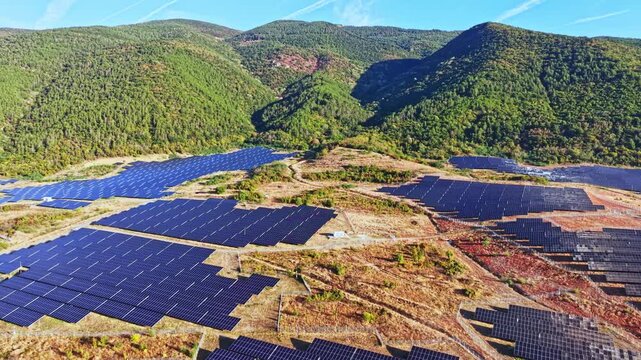
Solar panels are arranged in neat rows on open land next to green hills and trees. The clear sky shows signs of early morning or late afternoon light.
00:15
HD
3D Business Statistics Bar Chart with Downward Arrow Showing Financial Decline, Falling Revenue, Market Loss and Negative Growth Data Visualization on Green Screen
00:05
HD
Four grey circles animating and scaling on white background with copy space
00:08
HD
Orange Circular Progress Bar 46% Animation with Percentage Indicators on White Background
00:10
HD
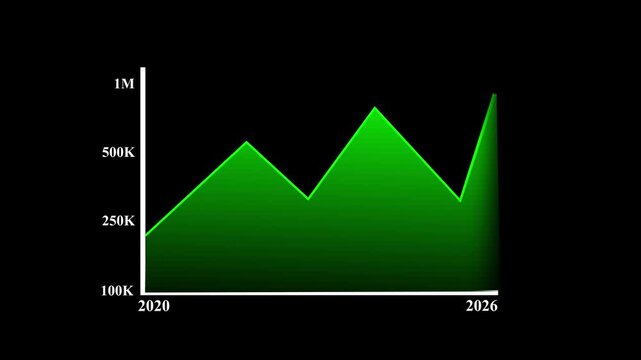
Green chart rises and falls over a four year period
00:08
HD
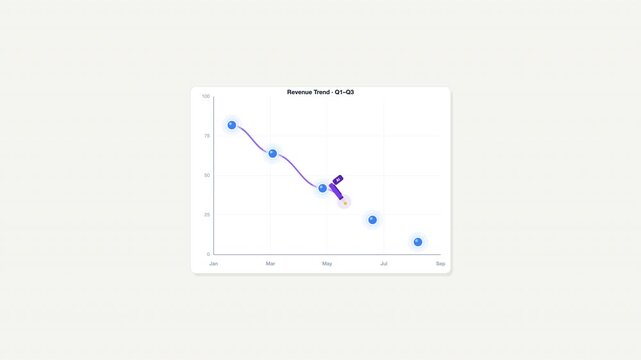
Revenue trend 6m line chart with blue circles and purple wavy line. Suitable for financial presentations, reports, and data analysis projects.

00:10
HD
Cost control and quality improvement concept. Red bar chart with line graph showing cost reduction and improving quality. Successful business strategy, efficiency, product optimization and management
00:06
HD
Pink 3D Descending Bar Chart Showing Decrease on Magenta Studio Background
00:05
HD
Israel Oil Price Falling with Oil Barrels Downward Green Arrow and 3D Financial Data Visualization Graphs for Economy and Business Concept
00:11
HD
Twenty Percent Word Cloud
00:11
HD
Hands typing on laptop with digital financial graphics overlay, representing modern technology, data analysis, and investment strategies in a business environment. Qubit.
00:12
HD
Business growth concept in graph chart showing marketing sales profit increasing and decreasing to future target . growing business concept. Clean Hi-tech style technology chart with a grid Mockup.
00:12
HD
Personal wellbeing coaching concept assisting individuals in achieving improved health. Emotional balance. Stress reduction
00:17
HD
Cost reduction business finance concept. Businessman cost reduction icon with down arrow for budget management and 4k Animation video on Black Background
00:10
HD
Red Bar Chart Declining Trend Data Analysis Business Growth.
00:10
HD
Focal length decreases as autumn leaves fill the right side against soft green bokeh.
00:15
HD
Animated Red Bar Chart Showing a Declining Negative Business Trend
00:09
HD
Declining bar chart with downward trend, Blue bar chart with falling line graph decline in business data, finance performance and analytics animation
00:07
HD
Down arrow business graph chart animation. Loss business graph icon animation.  on black background. 4k video
00:10
HD
Man hand adjusting smart thermostat temperature on wall from 23 to 26 and 25 degree. Digital climate control and energy saving concept for modern home automation
00:08
HD
Success level indicator scale. Low normal & high meter infographic animation on black background. Showing high success level color gauge indicator for goal achievement and performance monitoring.
00:10
HD
Business crisis line chart animation with downward arrow loop on black background...
00:13
HD
Radiation level indicator scale. Low normal & high meter infographic animation on black background. Showing high radiation level color gauge indicator for environmental and safety monitoring.
00:10
HD
LGBTQ economic bar chart graph showing decreasing downturn with national Flag 3D animation on black background.
00:16
HD
Nicaragua Oil Prices Decline with Oil Barrels, Gold Coins and Downward Green Arrow, 3D Economic and Financial Market Concept
00:11
HD
Bright white 3D number 2020 text animation floating against a deep black void offering a vibrant and modern visual for the year with a sense of digital energy.
00:10
HD
line graph showing cost reduction and improving quality. Successful business strategy, efficiency, product optimization and management. Business steady growth concept with rising progress bar chart
00:10
HD
Pan right along a wire mesh fence covered with lush green foliage (unidentified species) in a subtropical garden on a sunny day. Motifs of reduced visibility, mazelike abundance, looking for an exit.
00:26
HD
Red 3D forty percent symbol on black background
00:08
HD
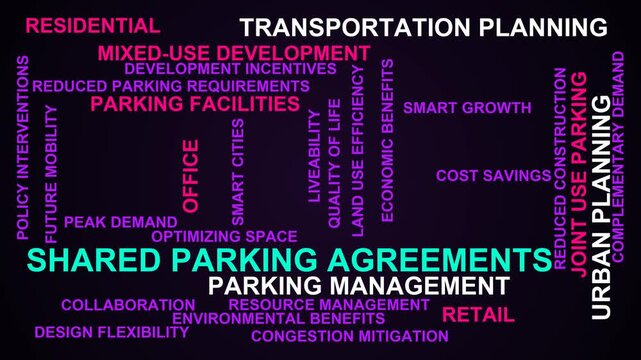
Shared Parking Agreements Word Cloud
00:11
HD
Green Innovation in Carbon Reduction Technology for Sustainable Future with Digital Interface Representations of Eco-Friendly Solutions Sigmoid
00:10
HD
glowing neon line business graph growth arrow to down arrow. Financial business Loss down graph chart with red neon line, glowing red neon downward graph with arrow indicating decline, 4k video
00:10
HD
Business hand holding a financial risk meter while monitoring asset value fluctuations and checking investment portfolio data and analytics for timely market decisions
00:17
HD
Minimalist animated bar chart showing negative financial trend with declining revenue growth and economic downturn concept for corporate business presentations and data analysis reports in media
00:10
HD
Financial Decline Graph with Percentage Symbol and Falling Data Blocks
00:10
HD
Red Downward Trend Graph on Green Screen Background
00:15
HD
Djibouti Oil Price Falling with Oil Barrels Downward Green Arrow and 3D Financial Data Visualization Graphs for Economy and Business Concept
00:11
HD
High Performance Gauge Indicator Animation. Speedometer Icon with arrow Indicate high level
00:10
HD
Animated dollar sign filling with green liquid representing 80 percent progress financial growth concept dark background with subtle green lines
00:06
HD
Large black key symbol zooms in and out at the center, surrounded by four small copies. Seamless looped 4k animation on white background
00:12
HD
Cereal field uneven growth with damaged rows and dry areas across farmland. Agricultural land showing drought stress and low yield potential. Farming crisis with stressed crops and reduced
00:25
HD
Professional Business Growth Chart Animation with KPI Analytics
00:09
HD
Businessman analyzing profit and quality management concepts long term cost planning, product quality, budgeting, financial forecasting, and company revenue and expense projections.4k video
00:10
HD
3D green Declining Bar Chart with Up Arrow for Representing Falling Sales, in 4K loop animation on White Background
00:09
HD
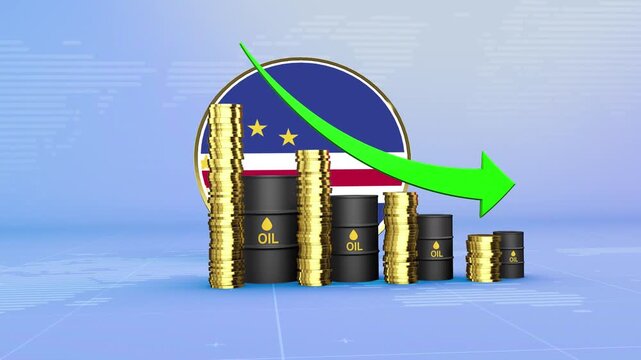
Cape Verde Oil Prices Decline with Oil Barrels, Gold Coins and Downward Green Arrow, 3D Economic and Financial Market Concept
00:11
HD
Blue Neon Dollar Sign with Downward Arrows in Circle
00:10
HD
Danger level indicator scale. Low Normal High meter infographic animation on black background. Animation showing high danger level color gauge indicator for safety and risk monitoring
00:10
HD
Digital Slide Deck Presentation Animation Showing Revenue Growth User Increase and Cost Reduction Metrics
00:10
HD
Bar chart animation shows a downward falling trend arrow on dark. Financial revenue loss reflects on this bar chart. Negative economic performance marks the chart.
00:12
HD
Dynamic Checkout Word Cloud
00:11
HD
Modern digital representation of artificial intelligence with quality and cost indicators over a keyboard, showcasing technology and innovation in business analytics Sigmoid
00:10
HD
Icon representing a dollar coin with a downward arrow indicating a decrease in value
00:07
HD
Business concept a promotional pricing policy with a handshake, price lists, and scissors cutting a red price tag for discounts and cost reduction strategies
00:17
HD
Solar panels cover a vast area in a mountainous region. The panels gather sunlight to generate energy. The scene shows clear skies and green hills in the background.
00:15
HD
Percentage Progress Bar Loading Concept, Digital Data Flow, Financial Growth, UI Element
00:10
HD
Abstract dollar sign icon and up arrow animation on a white background. Upward arrow and dollar icon. High pricing icon. profit, investment, growth business, economy, finance and success concept
00:10
HD
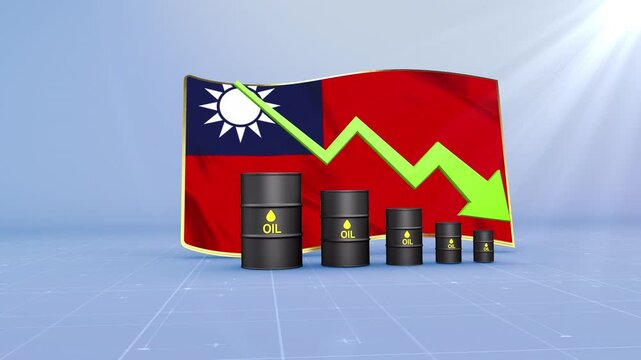
Taiwan Oil Price Falling with Oil Barrels Downward Green Arrow and 3D Financial Data Visualization Graphs for Economy and Business Concept
00:11
HD
Down curve arrow animation, Falling prices concept arrow animation.Motion graphic 4k animation video.
00:06
HD
Bar chart and line graph animation tracks zero percent data indicators. Financial business analytics reflect on the bar chart and line graph. Economic market metrics display on this line graph.
00:08
HD
Modern electronic screen displaying successful slump metrics with decreasing charts for investment trading and risk presentations
00:15
HD
Two curved arrows pointing in opposite directions minimal animation
00:06
HD
Corporate Revenue Growth Dashboard Animation with Positive Trend Visualization
00:13
HD
Mobile Network Signal Strength Animation
00:15
HD
Informational graphic presents Boost vs Drain on a split screen. Text colors subtly change over a light gray background, focusing on a critical concept
00:06
HD
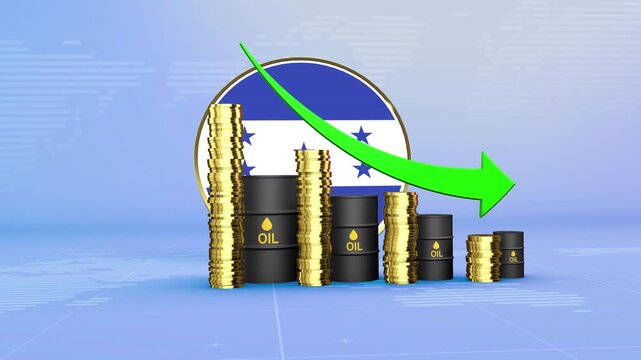
Honduras Oil Prices Decline with Oil Barrels, Gold Coins and Downward Green Arrow, 3D Economic and Financial Market Concept
00:11
HD
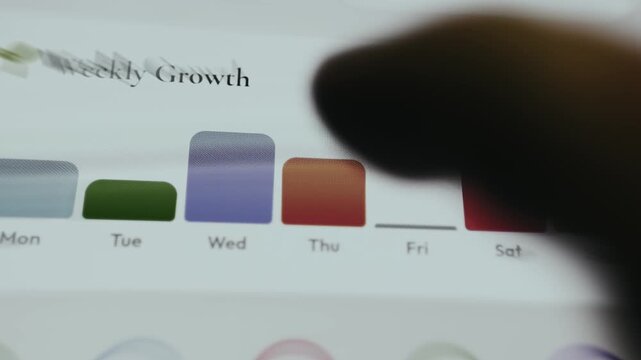
Bar chart titled Weekly Growth, tracking data from Monday through Sunday
00:14
HD
Refund rate KPI dashboard card with return percentage, decrease indicator and trend chart. Animated motion graphics interface for ecommerce reports, customer service, retail analytics and payment
00:10
HD
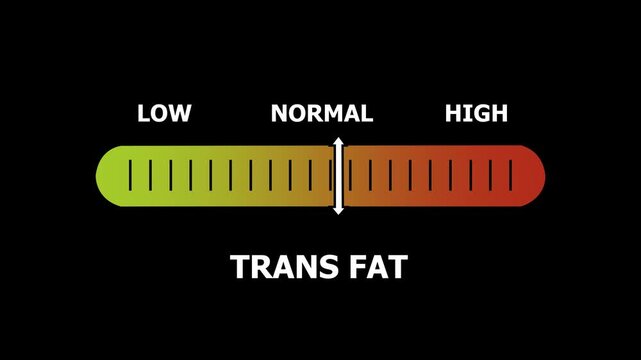
trans fat level indicator scale. Low normal & high meter infographic animation. Showing high trans fat level color gauge indicator. on a black background 4k animation video
00:10
HD
Progressive numbers counting down in circles on black background with cinematic motion for business analytics
00:46
HD
Mobile-Optimized Forms Word Cloud
00:11
HD
Futuristic Visualization of Artificial Intelligence Impact on Quality and Cost in Urban Environment with Skyscrapers and Data Analytics Elements Sigmoid
00:10
HD
Animated Bar Chart Data Growth Report Growth Statistics Analysis
00:06
HD
Reducing unemployment rates leading to job growth, increasing financial stability, and improving social welfare for individuals and families in the economic landscape
00:17
HD
Weather condition level indicator scale. Low normal & high meter infographic animation on black background. Showing high weather condition level color gauge indicator for climate and atmospheric.
00:10
HD
Animated price tag with downward arrows indicating cost reduction
00:08
HD
Business optimization concept: decreasing cost and increasing graph animation on black background chart
00:10
HD
Moldova Oil Price Falling with Oil Barrels Downward Green Arrow and 3D Financial Data Visualization Graphs for Economy and Business Concept
00:11
HD
Speedometer and tachometer showing increasing and decreasing engine speed and vehicle velocity motion
00:10
HD
White line graph showing a peak and decline on grid. White line graph for business data and trend. Digital white line graph animation for report.
00:06
HD
Business growth concept in graph chart showing marketing sales profit increasing to future target . growing business concept. animation
00:10
HD
Cost Reduction Business Growth Motion Graphics Line Chart Arrow Down Concept, Financial Loss Analysis, Budget Cut Optimization, Downward Arrow Graphic with Text Animation on Black Background.
00:10
HD
glowing neon line business graph growth arrow to down arrow. Financial business Loss down graph chart with red neon line, glowing red neon downward graph with arrow indicating decline, 4k video
00:10
HD
Simple Line Graph and Bar Chart Icon.
00:07
HD
Money reduction icon. Dollar currency price drop concept. circle with down arrow moving animation.4k video
00:06
HD
Mauritius Oil Prices Decline with Oil Barrels, Gold Coins and Downward Green Arrow, 3D Economic and Financial Market Concept
00:11
HD
Low battery reading initiating Eco charging showing battery filling then draining on rotating Earth
00:10
HD
Abstract 3D number 1944 text animation floating against a deep black void offering a vibrant and modern visual for the year with a sense of digital energy. 4k motion video.
00:10
HD
Animated Goal Achievement Gauge: Visualize Goal Completion from Low to High Levels with Dynamic Meter, Comparison Metrics, Performance Insights, and Motion Animation
00:10
HD
Glowing Corporate Performance Growth Animation with Modern Business Statistics
00:09
HD
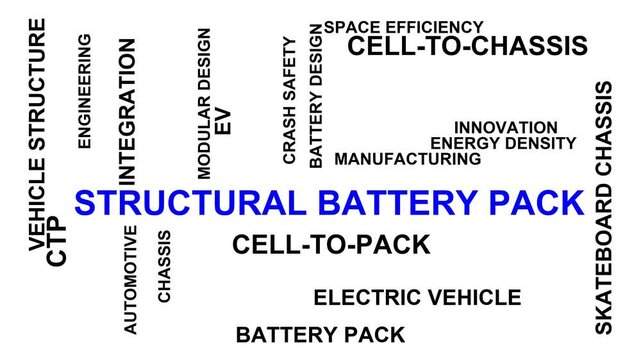
Structural Battery Pack Word Cloud
00:11
HD
Visual Representation of Artificial Intelligence Impact on Business Metrics Including Cost and Quality with Hands in Collaboration on Wooden Table Surface Gluon.
00:20
HD
Quality control and cost reduction concept, Cost and quality control concept, Successful organization strategy and management, Cost and quality comparisons are indicate arrow on dark background.
00:10
HD
Business process having financial risks, showing an operational challenge impacting profit, and the potential for a monetary decrease due to internal or external factors
00:17
HD