A link to set your password has been sent to: To access your purchases in the future you will need a password.
Create without limits — unlimited downloads, plus powerful AI editing
New filters added
Sort by

19,768 results for increase and decrease in videos

The colorful five point two percent sign of shiny 3D marbles isolated on white background
00:10
HD
coronabond coronavirus cells covid-19 influenza with color of europe euro, concept of corona bond crisis for economy finance business europe for pandemic health risk recession
00:35
HD
Stacks of gold coins with magnifying glass on graph background
00:10
HD
Schoolchildren planting trees and learning about recycling
00:05
HD
Cost reduction and cost saving through digital transformation, business cost optimization, operational cost reduction, financial savings, and resource efficiency strategy for business success. Funnel
00:15
HD
Malawi Oil Prices Decline with Oil Barrels, Gold Coins and Downward Green Arrow, 3D Economic and Financial Market Concept
00:11
HD
Drone aerial view of dense green forest canopy, highlighting the role of forests in maintaining atmospheric moisture and regulating local temperature for ecological balance. Thailand.

00:11
HD
Abstract 3D number 1994 text animation floating against a deep black void offering a vibrant and modern visual for the year with a sense of digital energy. 4k motion video.
00:10
HD
Stock Market Data Analysis with Candlestick and Bar Charts in Motion Graphic 4K.
00:10
HD
flyby of the camera through the red-blue rings with glowing lines on a black background. looped abstract animated screensaver background. endless tunnel. 3d render
00:10
HD
Performance Improvement with hologram businessman concept
00:15
HD
Closeup of hand draws on a wooden board. The fall of the bitcoin.
00:16
HD
Blue Gas Flame coming out from the Cooker. Energy Saving Concept.
00:19
HD
two direction arrow icon animated video
00:07
HD
Leaf appearing with candlesticks growing, dipping and line graph spiking to show market data
00:10
HD
Business efficiency concept, how much a company or organization can produce as it relates to time, cost and quality. Abstract Digital Technology. Business growth transformation Successful financial.
00:12
HD
Abstract business growth and graph chart icon animation. business graph showing growth on blue  grid background.
00:10
HD
Dynamic 3d animation showing pie charts with dollar signs and percentage symbols indicating financial decrease
00:08
HD
abstract business graph chart icon animation .Animated arrow growth up and down icon on background.
00:10
HD
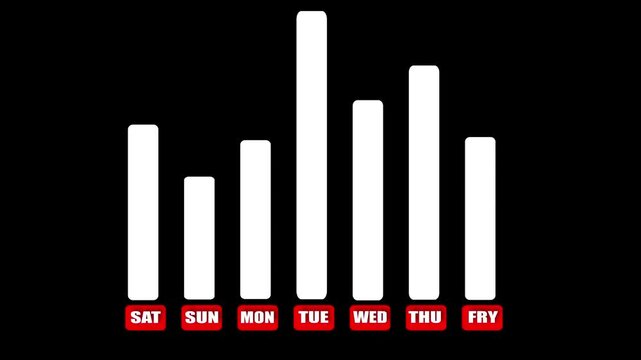
Data visualization sequence on black background, animated bar charts declining over time, highlighting downward trends with arrows, financial analysis insights, Copy space.
00:16
HD
Headache. Upset tired man at workplace, he closes his eyes and touches temporal part and eye area with his hands. Slow motion
00:47
HD
Stock Market Growth Concept of a week, Economic crisis, recession, decrease graph. Infographic financial business diagram. Stock Market Growth Concept. cool animation on black background
00:10
HD
Business graph chart with down trend  arrow red color animation on black background.
00:05
HD
Profit high growth percent icon, stocks, financial, Interest rate and dividend concept. Futuristic raise arrow chart digital transformation abstract technology background.
00:10
HD
Cost reduction and cost saving through digital transformation, business cost optimization, operational cost reduction, financial savings, and resource efficiency strategies for business success. Spire
00:20
HD
Kazakhstan Oil Prices Decline with Oil Barrels, Gold Coins and Downward Green Arrow, 3D Economic and Financial Market Concept
00:11
HD
Financial market analysis with dollar sign and trading charts. Stock exchange data and forex investment movement.
00:05
HD
Abstract 3D number 1982 text animation floating against a deep black void offering a vibrant and modern visual for the year with a sense of digital energy. 4k motion video.
00:10
HD
Cost icon. Striking design ideal for web, print files, online design, commercial use, economics,Money reduction icon. Dollar currency price drop concept.
00:10
HD
The financial team is meeting to analyze and discuss the performance data report.
00:54
HD
Financial market data candlestick chart
00:05
HD

A stock market chart with the Russian and American flags on either side, indicating crossroads in global economic trends between Russian and America.
00:10
HD
Circular economy concept for future business growth and environmental sustainability and reduce pollution for future business and environmental growth.Globe Glass with Net zero icons In Green Forest.4
00:15
HD
Colorful Candlestick Chart Representing Financial Stock Market Trends and Analysis
00:05
HD
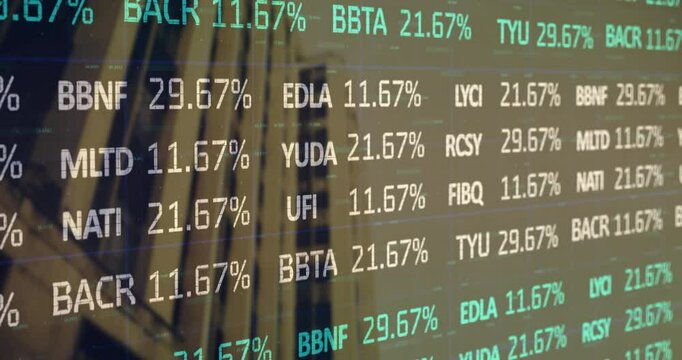
Loading financial overlay causing fluctuating percentages shifting rows updating live market feed
00:15
HD
Abstract digital graph with neon green bars decreasing across grid forming dynamic data visualization. Neon Green Bar Chart Displaying a Decreasing Trend on a Grid Background graph data.
00:09
HD
Quality rating level indicator scale. Low normal & high meter infographic animation on white background. Showing high market quality rating level color gauge indicator for product & service monitoring
00:10
HD
Close shot to us money on the table with rotation 4K
00:14
HD
Abstract stock market and exchange with charts, graphs and business data. Investment, trading, financial figures, stocks and commodities concept. 3D animation
00:20
HD
Animated searvice Sector Performance Meter – Increasing and Decreasing Gauge from Good to Best Levels, Comparison Indicator for  Data Visualization,  perfomance, and Motion Graphic Reports
00:10
HD
ECO performance gauge cycling, green metric indicator increasing to optimal high level then decreasing to low, environmental sustainability and positive impact dashboard reading, Copy space.
00:40
HD
Animated bar graph chart increasing decreasing stock market business finance data
00:07
HD
Stock market trends represented by glowing line graph on dark background
00:05
HD
67% Pie Chart Modern Animation
00:16
HD
A businessman showcases a digital visualization of cost reduction strategies, featuring graphs and icons that symbolize analytics, finance, and efficiency improvement ideas. Qubit
00:14
HD
Bahrain Crude Oil Price Decline with Oil Barrels and Downward Green Arrow
00:11
HD
Set of Minimal Bar Charts, Financial Business Analytics, Performance, growth, loss, profit, decrease, increase, random data, motion graphic on a transparent background, alpha channel
00:31
HD
Candles of the stock market, price falls. Falling prices of securities. Loss of assets in equities stock. Decreasing trend showing unsuccessful performance and losses failure due to economic crisis
00:17
HD
White and red border arrows clicking downwards.
00:09
HD
A semi-circular gauge with a color gradient and a needle indicating a moderate level of infection against a black background. infection text or word low and medium to high meter concept.
00:10
HD
Chart Alpha Channel Loop
00:10
HD
Visualizing Tax Cuts for Corporations: Modern Business Imagery Highlighting Reduced Fiscal Burdens and Enhanced Market Conditions for Corporate Growth - Stock Photo Concept with Left Space
00:10
HD
Abstract 3D number 1917 text animation floating against a deep black void offering a vibrant and modern visual for the year with a sense of digital energy. 4k motion video.
00:10
HD
Candlestick chart with indicator lines on a dark background
00:10
HD
EEG waveform appearing at baseline climbing over grid visualizing neural activity in 3D brain model
00:12
HD
Antarctica country flag and bar chart graph showing decreasing values a red arrow economic crisis concept. Flag of Antarctica
00:11
HD
Placement level indicator scale. Low Normal High meter infographic animation on white background. Animation showing high placement level color gauge indicator for job, task, or performance monitoring.
00:10
HD
The six point eight percent sign made of colored 3D marbles isolated on white background
00:10
HD
Bid and ask prices, stock exchange, filled orders, market data, trading volume. Stock market information, moving up and down, trading board, financial markets, equity, analyzing.
00:12
HD
Arrow continuous line 4K animation video showing downward direction on a minimal background
00:10
HD
Closeup view of a digital stock market display showing financial data numbers and indicators
00:08
HD
Waning moon in the night sky of Naples
00:11
HD
4k video Neon business graph Profit and cost future concept up business graph icon animated Success , profit, growth concept.......
00:10
HD
Expense Compare to Income Graph Animation
00:12
HD
A striking digital illustration showcasing a business concept of quality and cost metrics, depicted with glowing arrows. Ideal for finance, strategy, and analysis themes. Qubit
00:14
HD
Estonia Oil Prices Decline with Oil Barrels, Gold Coins and Downward Green Arrow, 3D Economic and Financial Market Concept
00:11
HD
Stock Market Data Visualization: A captivating representation of stock market trends, rendered with intricate lines, vibrant colors, and a sense of depth.
00:05
HD
Neon style rotating bar graph animation on black background representing data analysis and market trends
00:08
HD
Cost icon. Striking design ideal for web, print files, online design, commercial use, economics,Money reduction icon. Dollar currency price drop concept.
00:10
HD
The chocolate chip cookie tower grows and decreases. Stop motion
00:06
HD
White Financial growth decrease icon isolated on grey background. Increasing revenue. 4K Video motion graphic animation
00:10
HD
money stack on table, Wealth Increasing and Decreasing - Global Financing
00:05
HD
Abstract glowing neon swipe arrow. 4k animation. Down to up neon line arrow direction animation. Neon line raising business arrow on black background for growth visuals
00:10
HD
Blur color gradient. Wavy shade. Texture scratch. Variable abstract background art damage glare. Flow color change slow motion. Growth reduction spot flare.
00:24
HD
On startup, stock chart animating over dusk skyline, moving line and markers tracking market data
00:15
HD
Circular diagram filling and emptying process visualization
00:07
HD
A corporate report highlighting ESG (Environmental, Social, Governance) metrics within the green energy sector, showcasing sustainable business practices in the renewable energy industry
00:15
HD
The sign four point four percent of joyful bright coloured marbles isolated on white background
00:10
HD
Green leaves against the background of blurred industrial structures and factory pipes under a blue sky. Ecology, green technologies, and reduced emissions.
00:07
HD
moving gold defocused blurred glitter lights background. abstract yellow holiday concept mood. bloating and decreasing motion increasing dots bokeh in seamless loop.
00:14
HD
Above drone aerial view scene sugar cane field arid summer dry soil farm net zero waste rural plant nature crop. Go green carbon credit ESG future growth reduce power bio fuel energy truck tractor.
00:12
HD
Conceptual graphic showing cost decreasing with rising quality represented by arrows on a dark background with blue light effect
00:12
HD
 blue line graph illustrating a downward trend with percentage and dollar symbols representing price analysis and market decrease on a dark grid background. 4k
00:10
HD
Risk level indicator scale. Low normal high stress meter infographic animation on white background. Showing high risk level color gauge indicator for business, finance and safety analysis animation.
00:10
HD
Cost reduction and cost saving through digital transformation, business cost optimization, operational cost reduction, financial savings, and resource efficiency strategies for business success. Elide
00:14
HD
Qatar Oil Prices Decline with Oil Barrels, Gold Coins and Downward Green Arrow, 3D Economic and Financial Market Concept
00:11
HD
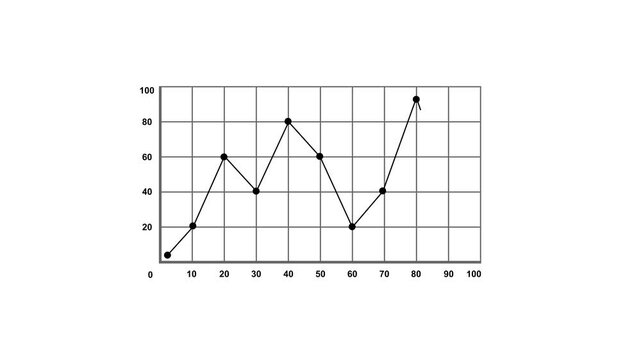
Black Line Graph with Data Points on White Grid Background chart statistics
00:10
HD
Neon business icons over coin stacks briefcase charts dollar sign globe
00:07
HD
arrow down business graph icon animation. business chart concept. A neon down business graph icon displays a glowing, downward-sloping line or bar chart, symbolizing decline, loss
00:10
HD
Hand holding a neon dollar sign with stock market data in the blurred background
00:08
HD
A woman's eyes intently focused on a transparent stock market graph showing financial trading data and trends.
00:10
HD
Zoom in and out animation the leaf symbol. Large black symbol in the center and four small symbols around. Seamless looped 4k animation on white background
00:12
HD
4K Business Graph Chart Icon Animation – Dynamic Financial Data Visualization for Corporate Use.
00:08
HD
Counselor and client engaged in a supportive conversation about emotional wellness highlighting strategies for stress reduction and happiness improvement.
00:05
HD
Opening transparent finance ticker overlay cycling percentages and highlighting gains on glass wall
00:15
HD
Green color up and down business graph chart with growing business concept. Bar chart animation with decreasing trend perfect for financial downturn.
00:06
HD
Promoting Sustainable Practices: A Hand Holding a Glowing Recycling Symbol in Nature
00:08
HD
phrase Take Your Brand in Spanish, animated word by word with spacing reduction and sharp zoom transitions, available in four background and outline versions.
00:12
HD
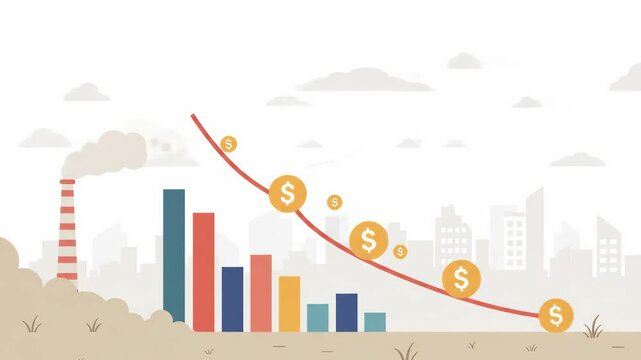
Economic decline illustrated by graph showing decreasing profits amid pollution
00:07
HD
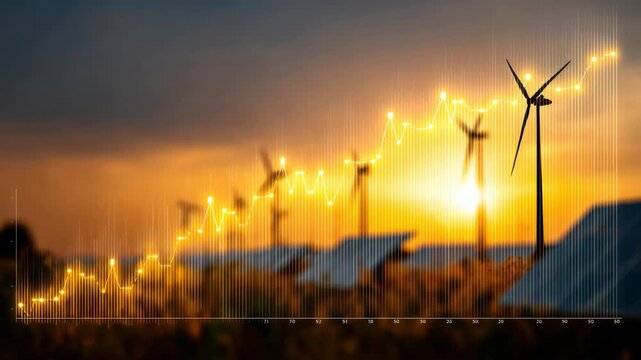
Stunning sunrise over wind turbines and solar panels showcasing renewable energy growth
00:05
HD