A link to set your password has been sent to: To access your purchases in the future you will need a password.
Create without limits — unlimited downloads, plus powerful AI editing
New filters added
Sort by

19,768 results for increase and decrease in videos

Professionals engage in a business meeting, analyzing a graphical representation of cost reduction strategies. The environment promotes collaboration and success. Raster
00:14
HD
Person evaluating item affordability, considering market value, and managing budget, showcasing the financial challenge of increasing product or service expenditure
00:17
HD
A futuristic black arrow graph line moving downwards on a white background, symbolizing the concept of financial loss, market decline, economic recession, business collapse and failure.
00:10
HD
Blue up and down arrows on white background.
00:10
HD
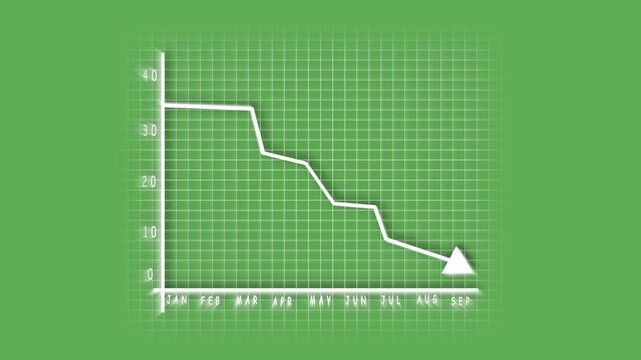
Decreasing graph animation minimalist green background business finance stock market economic downturn. Animated decreasing graph chart business finance stock market decline recession trend.
00:06
HD
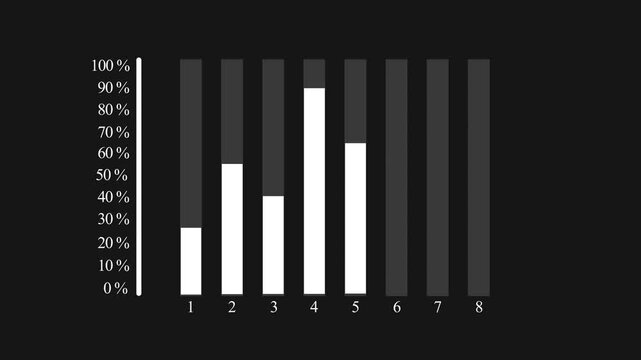
Animated histogram with data showing growth over 8 steps percent on black background motion graphic
00:10
HD
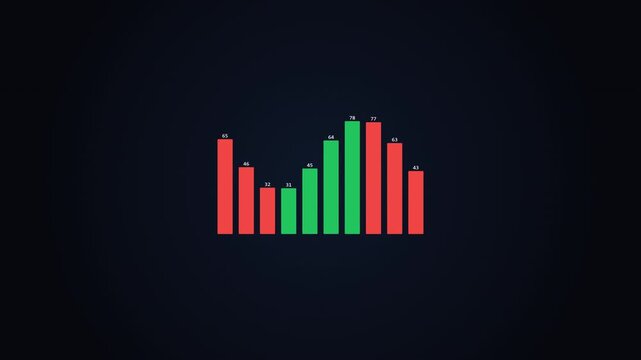
Colorful Bar Graph Animation Representing Financial Data Trends.
00:07
HD
Glowing Blue Line Chart Descends Rapidly Portraying Financial Market Crash In Dark Digital Space Used To Depict Economic Recession Financial Loss
00:10
HD
Stock market statistics on screen, economic growth, prices going up and down
00:15
HD
Moving digital Business Growth Financial Trading Chart and Stock Market Data Animation looping Seamless Motion Background. Business stock data concept
00:27
HD
Bright white 3D number 2003 text animation floating against a deep black void offering a vibrant and modern visual for the year with a sense of digital energy.
00:10
HD
Down curve arrow animation, Falling prices concept arrow animation.
00:15
HD
simple green random shape graph rising up down value sliced shape background blue background screen animation stock video footage
00:20
HD
Lean management methodology concept with digital icons and hexagon grid for business process optimization, manufacturing efficiency, waste reduction and strategic growth solutions.
00:10
HD
Business Strategy Showing Fluctuating Quality Improvement and Declining Costs, Highlighting Process Optimization, Operational Efficiency, Cost Reduction, Productivity Growth, and Better Performance
00:10
HD
Business growth concept in colorful graph chart showing marketing sales profit increasing and decreasing to future target . growing business concept. Clean Hi-tech style technology chart with a grid.
00:12
HD
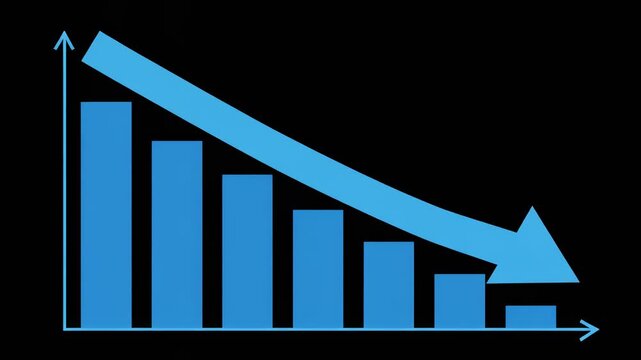
Falling Bar Chart Animation with Downward Arrow Symbolizing Financial Decline and Business Loss
00:05
HD
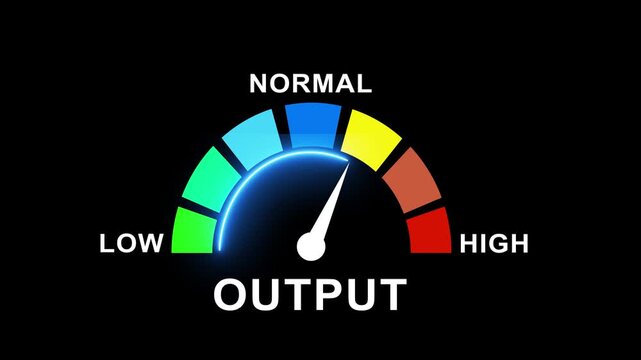
Dynamic output level meter gauge animation with glowing blue indicator light moving across color-coded sections from low and normal to performance on a clean isolated black background
00:10
HD
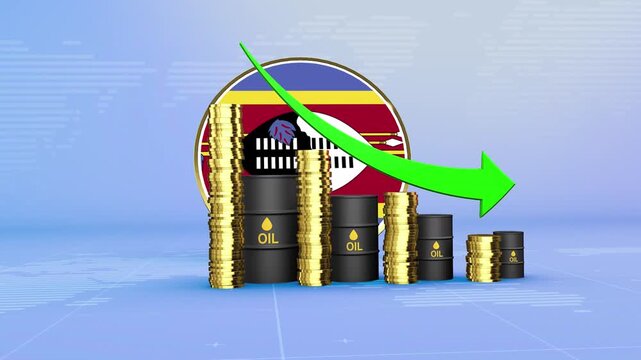
Swaziland Oil Prices Decline with Oil Barrels, Gold Coins and Downward Green Arrow, 3D Economic and Financial Market Concept
00:11
HD
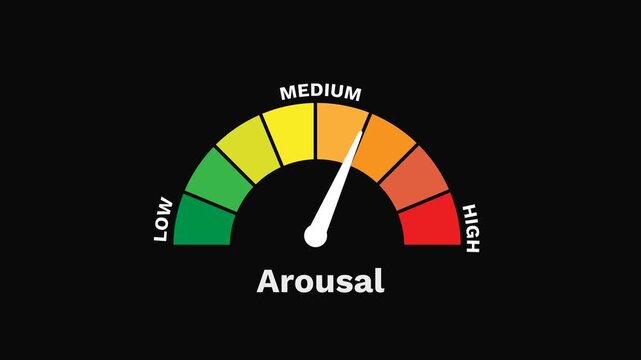
Arousal Level Gauge Increasing and Decreasing Indicating Excitement and Activation Animation
00:19
HD
Cost reduction and cost saving through digital transformation, business cost optimization, operational cost reduction, financial savings, and resource efficiency strategies for business success. Spire
00:20
HD
Business icons visualizing plant overhead spending calculation, cost control, and financial management processes for effective budget allocation and expense reduction strategies
00:17
HD
Financial Growth Graph Animation Featuring Increasing Business Performance Bars
00:07
HD
3D Animated Colorful Bar Chart Declining Downwards
00:06
HD
Animated CO2 icon with a leaf representing a carbon-neutral, eco-friendly initiative, 4k video. Black and white icon with transparent background
00:10
HD
Animated 3d bar chart showing a downward trend, financial decline, economic recession concept
00:06
HD
Close-up screen financial markets dashboard, global stock index data, trading board. Investment, stock exchange data, price, risk, strategy, analyzing, business.
00:10
HD
Bar chart for declining business performance by month. the curve shows a downward move .chart graph animation, 4k arrow is making downfall on a grid ...
00:10
HD
Futuristic Data Analytics Milestone Performance Target Graph
00:15
HD
Animated Green Up and Down Arrows Direction Icons on Black Background
00:10
HD
Abstract 3D number 1974 text animation floating against a deep black void offering a vibrant and modern visual for the year with a sense of digital energy. 4k motion video.
00:10
HD
Trans fat level indicator scale. Low normal & high meter infographic animation on black background. Showing high trans fat level color gauge indicator for nutrition and heart health monitoring.

00:10
HD
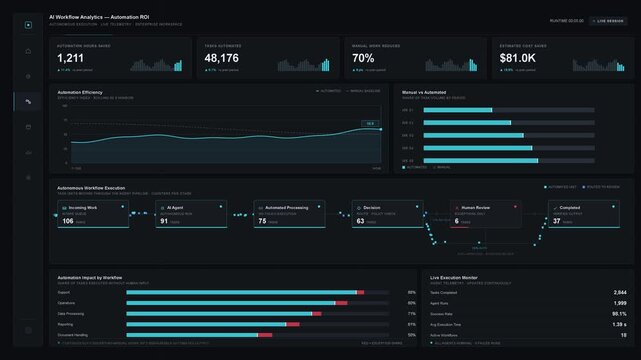
A dark-mode business dashboard illustrating the measurable impact of AI workflows with automation metrics and efficiency charts for business professionals.
00:15
HD
Line graph showing monthly data spikes. Business line graph for corporate performance analysis. Digital line graph animation for financial reporting.
00:08
HD
Stock market chart with trend line
00:05
HD
Vivid stacked minus and plus chips press alternately on a dark column with a contacting notch indicator on transparent background.
00:08
HD
inflation Increased product sales growth basket market or consumer price index concept shopping cart with food increase with arrow graph on the coin inflation.4k motion graphics video animation
00:06
HD
Neon sign Declining bar chart with downward trend. Business graph. loss graph direction. damage business graph. down business graph icon. arrow is going down. 4k motion video.
00:10
HD
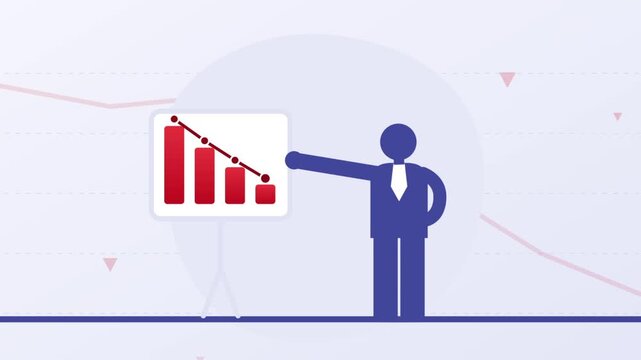
Businessman presenting a declining bar chart and a blank board with a red cross icon
00:19
HD
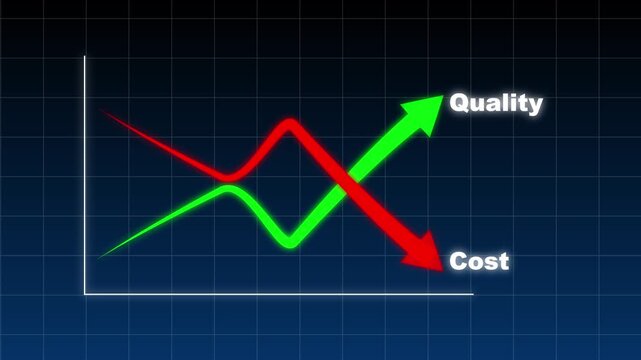
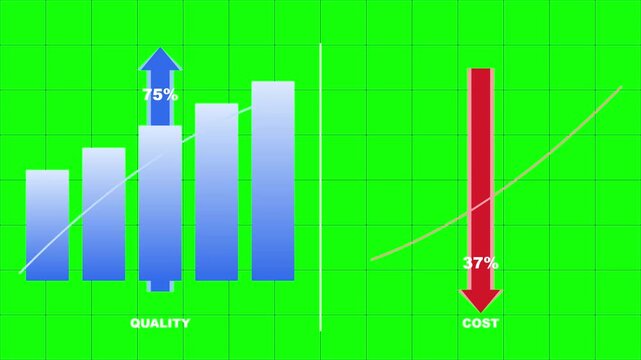
Animated Comparison Graph Showing Increasing Quality and Decreasing Cost on Green Screen Background
00:10
HD
Business professional analyzing quality and cost metrics with artificial intelligence technology on a laptop in a modern office setting Gluon.
00:10
HD
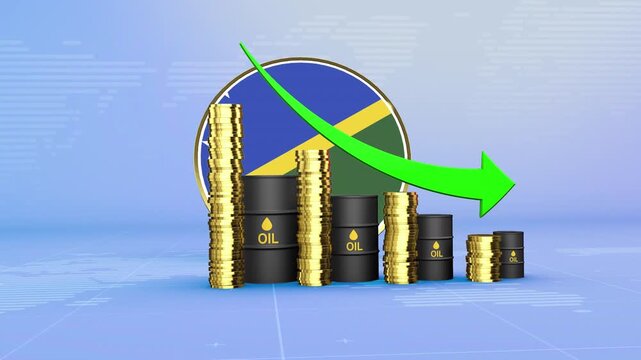
Solomon Islands Oil Prices Decline with Oil Barrels, Gold Coins and Downward Green Arrow, 3D Economic and Financial Market Concept
00:11
HD
Businessman presenting bar graph on whiteboard business presentation
00:12
HD
Money increases icon, dollar rate increase stretching arrow up icon .Glowing up arrow with dollar sign. Glowing neon line of dollar sign icon and up arrow isolated on transparent.Business growth
00:10
HD
Modern Dashboard with Financial Charts Graphs and Data Analytics Business Growth Overview
00:10
HD
Dollar Coin with Up and Down Arrows on Green Screen
00:05
HD
Hand holding an “Inflation” sign with a coin, illustrating rising prices, reduced purchasing power, economic pressure and cost of living.
00:17
HD
Declining business bar chart with downward arrow representing falling sales, reduced revenue, financial losses, market decline, decreasing performance.financial loss icon.
00:10
HD
Corporate pyramid audience growth and decline conceptual animation with podium speaker and signal lights transparent background video
00:12
HD
Analysis of Real-Time Stock Market Data: Fluctuating Prices and Performance Metrics Displayed on a Digital Trading Platform
00:20
HD
cholesterol level indicator scale. Low normal high meter infographic animation on black background. Showing high pressure level color gauge indicator.4k quality animation video
00:10
HD
Bright white 3D number 2004 text animation floating against a deep black void offering a vibrant and modern visual for the year with a sense of digital energy.
00:10
HD
Business visualizing cost reduction impacting overhead expenses through strategic planning. Financial management
00:17
HD
Bar graph animation indicates downward global economic trends. International financial market analytics route across bar graph animation. Economic policy teams use graph.
00:10
HD
As focal length decreases, autumn branches frame soft green woodland bokeh and layered leaves.
00:15
HD
Animated Volume Slider Control on Green Screen | 4K UHD
00:05
HD
Cyan Bar Chart with Downward Arrow and Monthly Labels on animation Black Grid Background Indicating Decline. Financial Loss or Negative Growth Graph, Business Decline and Decreasing Statistics Concept
00:06
HD
Corporate Sustainability and ESG Performance Dashboard Metrics
00:10
HD
Response level indicator scale. Low normal & high meter infographic animation on black background. Showing high response level color gauge indicator for customer service and communication analysis.
00:10
HD
black business graph chart growth up down or signal on white background with alpha channel. Business up and down signal concept.
00:07
HD
Person using smartphone with digital interface showing upward and downward arrows representing artificial intelligence quality and cost metrics in global context Gluon.
00:10
HD
Slovenia Oil Prices Decline with Oil Barrels, Gold Coins and Downward Green Arrow, 3D Economic and Financial Market Concept
00:11
HD
White dollar sign with green fill and grey 40 percent number on dark background with green abstract lines representing financial growth and economic data analysis
00:06
HD
Revenue and Profit Growth Animation for Corporate Business Reports
00:08
HD
?Adjusting the thermostat: a hand setting room temperature from 72°f to 68°f
00:06
HD
Guaranteed Delivery Windows Word Cloud
00:11
HD
KPI card with number counting and red decline arrow, flat white infographic element on green screen chroma key background, 4K
00:06
HD
A conceptual illustrating the benefits of AI with a central glowing turquoise neon AI chip symbol, flanked by boxes showing a downward arrow next to COST and an upward arrow next to QUALI
00:10
HD
Adoption Rate Uptrend Chart Business Analytics Graphic Concept
00:07
HD
Business growing bar chart with dashed trend line showing market peak and decline. Ideal for financial risk analysis, sales decrease, and stock market volatilit
00:07
HD
Cost reduction concept: scissors cutting dollar sign symbol animation for business finance and budgeting strategy
00:10
HD
Bright white 3D number 2049 text animation floating against a deep black void offering a vibrant and modern visual for the year with a sense of digital energy.
00:10
HD
Business concept visualizing human resource management, assessing employee potential, analyzing productivity metrics, and optimizing labor allocation for efficient organizational development
00:17
HD
Directional neon arrows visualize strategic corporate market trend fluctuations. Dynamic neon arrows guide digital presentation navigation pathways. Motion design utilizing neon arrows.
00:12
HD
Bar chart animation displays a declining trend line on dark. Negative financial revenue performance marks this bar chart. Business economic downturn reflects on the chart.
00:07
HD
Glass thermometer with rising red temperature level on transparent background
00:10
HD
Curved arrow pointing down and to the right with a flowing shape animation
00:06
HD
Gray line graph with jagged mountain peaks and blue circular data point markers. Suitable for financial presentations and analytical reports
00:10
HD
Animated digital blue bar chart showcasing business decrease Bar chart growth analysis with upward trend projection sand market trends.
00:15
HD
Black and white line graph with arrow pointing down, ideal for financial presentations, business reports, educational materials on decrease trends.
00:06
HD
Net zero goals and CO2 reduction strategy driving sustainability, green energy integration, net zero emissions policies, and climate-friendly sustainability solutions for business and society. Muxer
00:18
HD
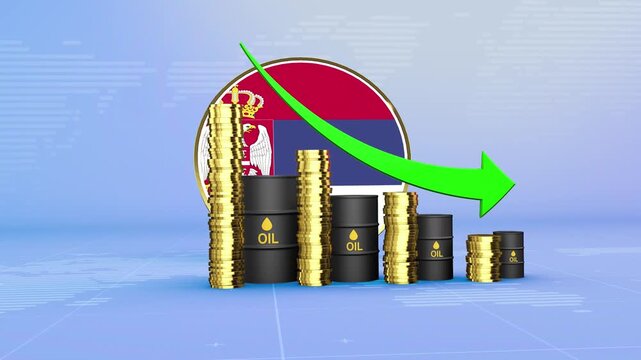
Serbia Oil Prices Decline with Oil Barrels, Gold Coins and Downward Green Arrow, 3D Economic and Financial Market Concept
00:11
HD
Risk Management and Financial Protection cartoon animation
00:10
HD
Colorful bar chart candlestick data finance business analysis and statistics for financial growth and investment
00:08
HD
Macro Finger Adjusting Black Rotary Volume Knob
00:10
HD
Meaning And Purpose Word Cloud
00:11
HD
Financial Loss and Declining Monetary Performance Shown by a Red Downward Trend Line, Representing Revenue Decline, Capital Loss, Risk and Negative Growth
00:10
HD
blood sugar level indicator scale. Low normal high meter infographic animation on black background. Showing high pressure level color gauge indicator.4k quality animation video
00:10
HD
White 3D Percent Symbol on Black Background for Finance, Discount and Business Concept
00:10
HD
US dollar coin inflation rise and fall value financial animation HD 4K
00:12
HD
Animated Red Bar Chart with Falling Arrow and Downward Trend Line on Global World Map, Business Decline and Financial Loss Concept
00:08
HD
Bright white 3D number 2025 text animation floating against a deep black void offering a vibrant and modern visual for the year with a sense of digital energy.
00:10
HD
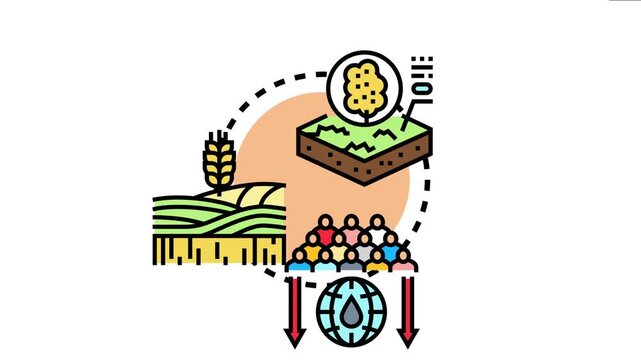
Global population consumption increasing while natural resources and agricultural output decreasing, depicting an urgent need for sustainable practices and environmental balance
00:17
HD
Abstract decreasing business graph chart animation background. Bad Economy Recession Chalkboard ..4k
00:10
HD
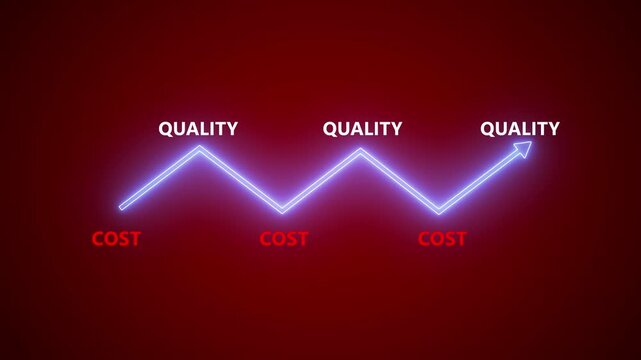
Glowing Neon Quality vs Cost Arrow Graph Motion Graphic Loop Dark Red Background Video
00:10
HD
Earth Global Ecological Green Energy Icons Hexagon Concept Mos on Tree stump Nature Background
00:15
HD
Doodle arrow pointing downward.
00:09
HD
Animated financial dashboard showing rising inflation rates and CPI data with alert indicators. The video presents increasing cost of living metrics, including categories such as energy, food, and hou
00:14
HD
Zoom in and out animation the oval symbol. Large black symbol in the center and four small symbols around. Seamless looped 4k animation on white background
00:12
HD
wood block of percentage change to UP and Down arrow. Interest rate, GDP, stocks market, financial, deflation and Inflation, ranking, mortgage, debt, Loan and Economic Recession concept
00:08
HD