A link to set your password has been sent to: To access your purchases in the future you will need a password.
Create without limits — unlimited downloads, plus powerful AI editing
New filters added
Sort by

19,768 results for increase and decrease in videos

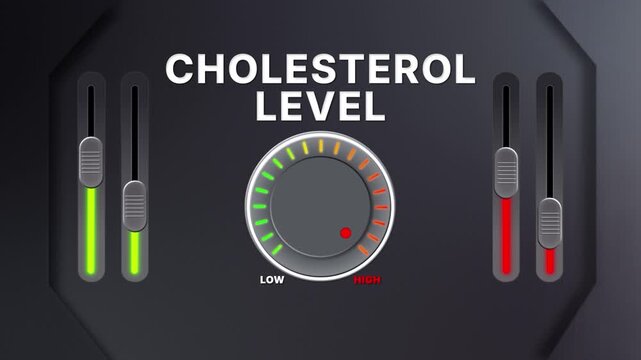
Animation of Cholesterol level on a circular gauge moving from low to high and back. Can be used to show increase or decrease. Perfect for health, fitness, or data content.
00:26
HD
Cost reduction and cost saving through digital transformation, business cost optimization, operational cost reduction, financial savings, and resource efficiency strategies for business success. Spire
00:20
HD
doctor and patient, exam, consultation in clinic office, holding breast enlargement implant in hands, plastic surgery, beauty enhancement, medical Mammoplasty and plastic surgery, mastopexy
00:15
HD
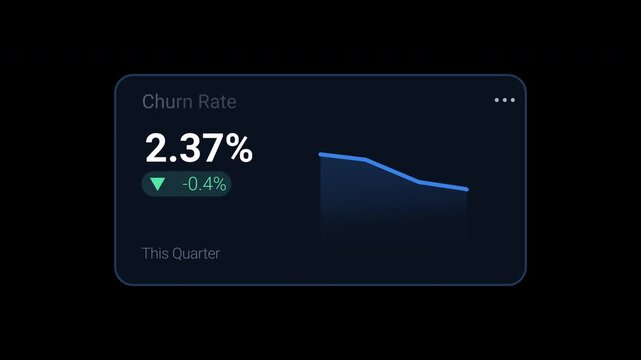
Churn rate Blue fintec KPI dashboard card showing customer loss percentage, decrease indicator and trend chart. Animated motion graphics component for subscription analytics, SaaS reports, retention
00:10
HD
Mechanic working on chassis in automotive workshop, displaying green eco technology icons
00:15
HD
Pulsating neon pink line graph animation on black background, representing fluctuating financial market trends and data visualization
00:05
HD
Businessman drawing a check mark from increased tariffs to decreased industrial production, symbolizing tariffs negative impact on industry
00:11
HD
graph chart up down business statistics
00:06
HD
Animation footage of Red Graph showing a fluctuating downward trend. downward bar graph and arrow chart. Animation for advertising. Downtrend.
00:15
HD
Businessman stopping increasing interest rate percentage sign
00:07
HD
Glowing Corporate Performance Growth Animation with Modern Business Statistics
00:09
HD
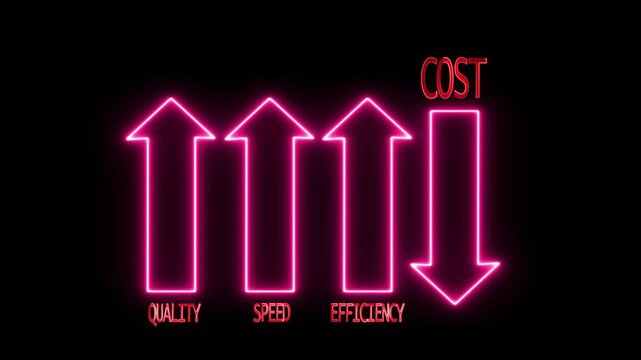
businessman drawing quality speed efficiency and cost concept, Analysing business performance methods ,Cost reduction concept. Increase quality, speed, efficiency,
00:10
HD
Business Growth and Recession Graph Concept.Business graph chart with growing business concept. Abstract decreasing business graph chart animation background.
00:06
HD
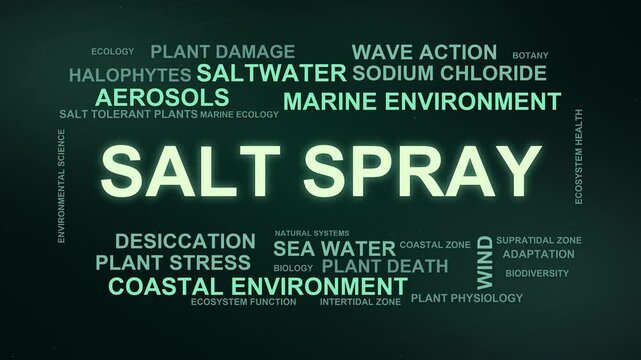
Salt Spray Word Cloud
00:09
HD
Palms hold orange raspberry, decreasing gradually. It represents offering, generosity, decrease, nutrition, harvest, abundance, natural product, and summer fruit
00:07
HD
Abstract decrease icon on white background. Dollar rate down looped icon. Reduce costs sign and symbol.
00:06
HD
Hand change wood cube block with GOLD text to UP and Down arrow symbol icon.price, down and up, decrease and increase, cut loss, stocks, financial and economic concept
00:08
HD
Abstract neon line dollar business graph animation. Money loss. Cash with down arrow stocks graph, concept of financial crisis, market fall. Declining profits financial graph animation with down arrow
00:10
HD
Cost reduction business finance concept on black background . Businessman cost reduction icon with up arrow for budget management and cost management.
00:10
HD
Wooden block with CO2 reduction symbol in lush forest setting, showcasing environmental awareness
00:10
HD
Business growth concept in graph chart showing marketing sales profit increasing to future target . growing business concept. Clean Hi-tech style white business graph animation. 4k
00:10
HD
A modern laptop displaying a digital cost analysis graph against a global backdrop, representing economic trends and data visualization, ideal for business and finance projects. Salient
00:12
HD
houseing growth Meter  Animated  – Increasing and Decreasing Gauge from Good to Best Levels, Comparison Indicator for  Data Visualization,  perfomance, and Motion Graphic Reports
00:10
HD
Examining cost reduction strategies and financial efficiency for business growth animation.
00:06
HD
Bar graph chart animation business finance statistics infographic seamless loop 4k hd. Animated bar graph chart business finance data decline decrease trend 4k ultra hd.
00:09
HD
Abstract decrease icon on black background. Dollar rate up looped icon. Reduce costs sign and symbol.
00:08
HD
Animated glowing financial bar chart and arrow displaying market drop and stock recovery for video overlay
00:06
HD
graph chart up down business statistics report
00:09
HD
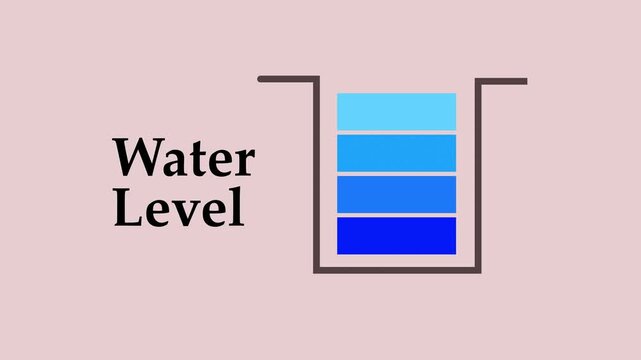
Water level increase and Decrease. Flood Level, Rain Level White
00:12
HD
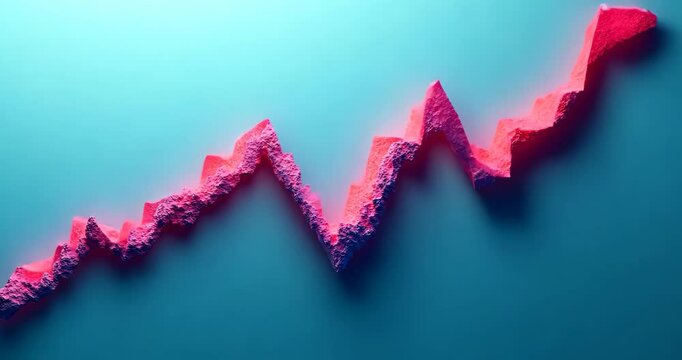
A dynamic pink chart fluctuates against a vibrant teal backdrop, symbolizing market volatility.
00:10
HD
Modern Volume Slider Animation isolated on black background with 4k resolution
00:12
HD
Medium shot of an Integrated FixedFilm Activated Sludge reactor highlighting biofilm growth optimizing nitrogen and phosphorus nutrient reduction.
00:06
HD
The text "GDP" and a chart showing increase or decrease. Gross domestic product concept. An index indicating inflation and economic growth.
00:09
HD
Detailed close-up shows a human eye reflecting a vivid, golden stock market graph. Implying concepts of vision, finance insights, and futuristic technology. Captures financial analytics seen through
00:10
HD
Rising arrow glow transparent channel. arrow rising glow   business growth arrow and graph chart, Business line arrow.
00:10
HD
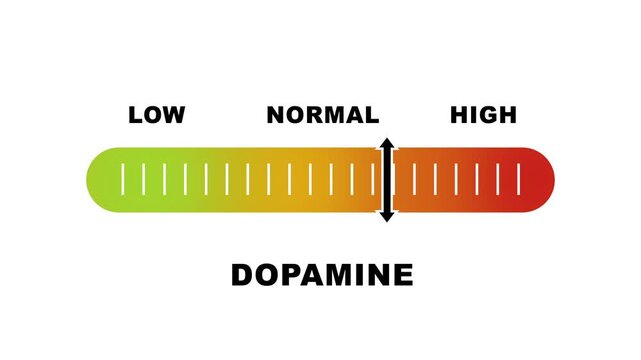
Dopamine level indicator scale. Low normal & high meter infographic animation on white background. Showing high dopamine level color gauge indicator for brain neurotransmitter mental health.
00:10
HD
Hand change wooden block with SET text or The Stock Exchange of Thailand to UP and Down arrow symbol icon. decrease and increase, price, stocks, financial, trade, value and Cut loss concept
00:08
HD
Neon medical thermometer icon animation indicating 11 degree temperature increase or decline, representing hot or cold weather measurement with a clean modern design on a dark background.
00:10
HD
Animated line and bar graphs with a percentage sign illustrate data trends
00:06
HD
Animated dollar sign with 55 percent indicator and green gradient fill on dark background with abstract green lines representing financial growth and data analysis
00:06
HD
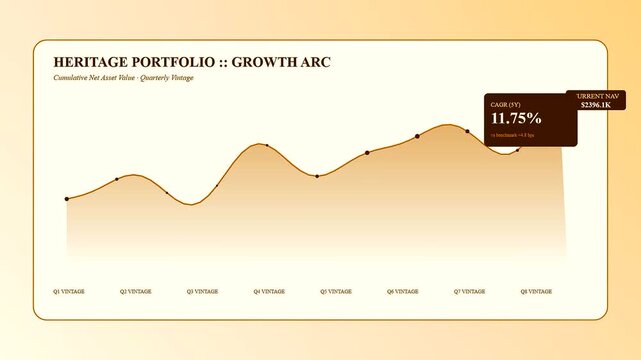
A sophisticated wealth management dashboard visually illustrating the growth arc of a heritage portfolio, detailing cumulative net asset value with quarterly vintage analysis for financial tracking.
00:06
HD
A robotic hand points at a graphic indicating cost reduction alongside financial data visualization, symbolizing advanced technology in modern business and analytics. Synapse
00:13
HD
Exam Preparation Meter Animation: Track and Compare Study Levels from Low to High with Dynamic Increasing/Decreasing Gauge for Data Visualization, Performance, and Motion Graphics
00:10
HD
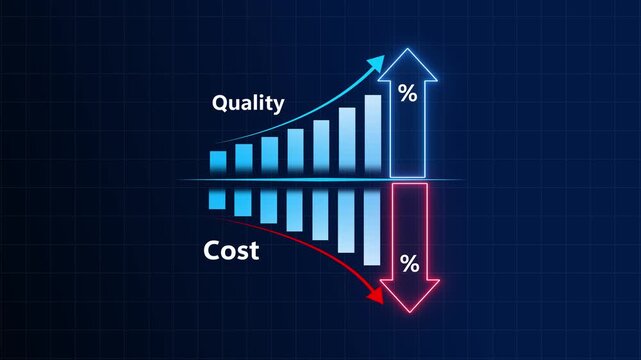
Neon Line Drawing Arrow Animation Showing Quality One Hundred Percent Increase And Cost Decrease With Transparent Alpha Channel For Business Infographics Presentation Loop VFX
00:12
HD
Animated business chart with upward and downward arrows. Perfect for sales tracking, financial reports, analytics, performance monitoring, and business presentations.
00:06
HD
Declining business growth concept with glowing green downward arrow and bar chart on dark background
00:05
HD
A rectangular frame with glowing blue edges or borders against a black background, designed for corner increase/decrease animation effects in motion graphics.
00:30
HD
graph chart up down business statistics report
00:12
HD
Animated Black Arrow Showing Upward and Downward Trends on Green Screen.
00:08
HD
Animated Speaker Icon Showing Volume Levels Increasing and Decreasing.
00:05
HD
Typography text overlay featuring market trend detection slogan against simple minimal black background suitable for corporate presentations.
00:10
HD
Zoom in and out animation the close symbol. Large black symbol in the center and four small symbols around. Seamless looped 4k animation on white background
00:12
HD
Finance and business concept. Net zero emission concept.Investment graph and rows growth of coins on table. Concept of investing and financial management. 4K
00:12
HD
Bar chart animation shows declining columns with an arrow. Business financial losses reflect on bar chart animation. Negative economic performance data marks the bar chart.
00:07
HD
Abstract decrease icon on black background. Ruble rate down looped icon. Cyan reduce costs sign and symbol.
00:06
HD
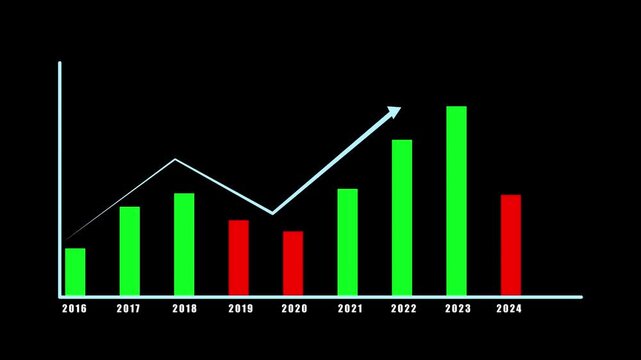
Bar chart animation with up and down. Bar chart financial growth and decline trends. Bar chart business statistics graphic on black background for market analysis.
00:09
HD
Declining Financial Market Performance Illustrated by Red Falling Bar Chart, Downward Arrow, and Negative Business Growth Trend
00:10
HD
Close up of moving digital Business Growth Financial Trading Chart and Stock Market Data Animation looping Seamless Background. Business data concept
00:27
HD
Financial growth animation finance money investment
00:08
HD
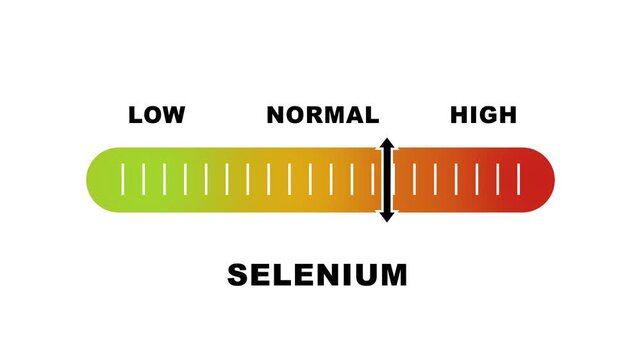
Selenium level indicator scale. Low normal & high meter infographic animation on white background. Showing high selenium level color gauge indicator for nutrition and antioxidant health monitoring.
00:10
HD
Colorful bar graph sculpture in front of modern skyscraper, sunny day
00:11
HD
A businessman holds a digital tablet showcasing glowing arrows indicating increased quality and reduced cost, representing effective strategies for business improvement. Qubit
00:12
HD
Animated Health Sector Performance Meter – Increasing and Decreasing Gauge from Good to Best Levels, Comparison Indicator for  Data Visualization,  perfomance, and Motion Graphic Reports
00:10
HD
41% Pie Chart Modern Animation
00:16
HD
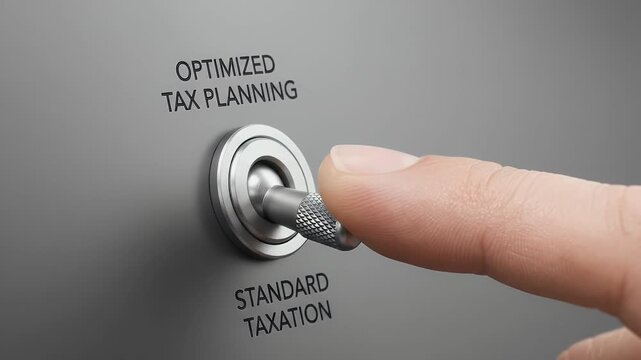
Optimized tax planning strategy, financial management and taxation reduction concept with control knob and selected target, supporting business finance optimization, strategic decision making
00:06
HD
Financial Growth Graph Animation Featuring Increasing Business Performance Bars
00:07
HD
Stock market candle stick chart, line graph and financial figures, data. Business, stock exchange, trading, investment growth, wealth, risk, volatile, shareholder concept.
00:16
HD
3D Silver Declining Bar Graph Animation Depicting Financial Loss and Business Downturn for Market Recession, Economic Decline, and Negative Growth
00:05
HD
Stock market trends and data analysis animation over fluctuating graph lines
00:16
HD
Neon business graph chart icon animation background. Neon business growth concept animated. Neon line business graph.
00:10
HD
Understanding consumer psychology and market dynamics, managing financial risk, and implementing strategic solutions to effectively decrease stress and worry for improved client confidence
00:17
HD
Curved arrow pointing down and to the right with a flowing shape animation
00:06
HD
Abstract background with rising and falling arrows showing growth decline data flow and business trend concepts animation
00:18
HD
Down curve arrow animation, Falling prices concept arrow animation.
00:06
HD
Speaker volume down and up animation Isolated on Black Background
00:07
HD
Glowing yellow and orange fractal star pattern, in full loop
00:15
HD
A semicircular gauge with a needle indicating a moderate level the word SAFETY below the dial on a black background representing a safety assessment. sefety level text or word low and medium to high..
00:10
HD
Concept illustration of quality versus cost with an upward green arrow and a downward red arrow held in hand on a geometric globe against blue.
00:08
HD
White interface featuring orange bar chart with dollar signs representing financial data trends digitally. Orange Bar Chart with Dollar Signs on White Background graph data.
00:07
HD
Red Line Chart on Black Backdrop: A sleek and modern line chart in vibrant red pulses against a stark black backdrop, symbolizing fluctuations, trends, and dynamic data.
00:10
HD
Declining bar graph with a downward-sloping arrow, representing a decrease or recession in business or financial metrics. Falling Chart with Arrow Animation, Animated Financial Crisis Chart
00:10
HD
Cost reduction and cost saving through digital transformation, business cost optimization, operational cost reduction, financial savings, and resource efficiency strategies for business success. Muxer
00:15
HD
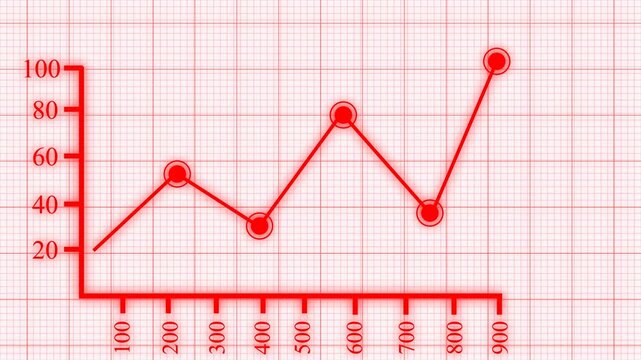
Graph with a red line that is going down and the numbers are decreasing. The background is also red
00:10
HD
Animated down graph icon designed in flat icon style. Finance, Business Info graphic animation, Bar down graph Animated down graph icon designed in flat icon style, business or finance, down graph bar
00:12
HD
Business growth concept in graph chart showing marketing sales profit increasing to future target. growing business concept. Clean Hi-tech style technology chart with a grid.4k video black background
00:10
HD
Zoom in and out animation the Three of hearts playing symbol. Large black symbol in the center and four small symbols around. Seamless looped 4k animation on white background
00:12
HD
Rising arrow transparent channel. arrow rising transparent channel, business growth arrow and graph chart, Business line arrow.
00:10
HD
Female researcher engineer touched screen, various animated Stock Market charts and graphs. normal line. Artificial Intelligence
00:21
HD
Financial business Loss down graph chart. business loss concept. Hi tech style glowing graph animation.Business growth concept in graph chart showing marketing sales profit increasing to future .
00:10
HD
Quality control and company cost reduction. Cost and quality control concept. Successful organization strategy and management.
00:10
HD
Stock Market Chart with stop motion piles of gold money coins decreasing fading disappear on black background, financial trading concept, Seamless Looping- 4K Ultra HD.
00:05
HD
Colorful financial diagrams showing profit and loss. 2 in 1. Green.
00:30
HD
Animation of wind turbines moving in countryside and stock exchange graph increasing and decreasing
00:14
HD
Circular economy concept for future business growth and environmental sustainability and reduce pollution.Net zero and carbon neutral concept.Concept day earth Save the world save environment.
00:12
HD
Red and Blue Graph on White Surface Generative AI
00:08
HD
Growth meter showing falling values of growth. Diminishing to minimum, reaching zero, below the norm. Lack of growth. No AI, made by humans for humans.
00:06
HD
Glowing neon style financial report and dollar coin on black background business growth
00:08
HD
Close-up candle stick chart. Stock market and exchange screen with graph and trend line, moving averages. Business, trading, growth, investment, profit, concept.
00:11
HD
Smooth motion graphics of economic loss and decrease for data visualization and business use. Animated bar graph chart decline recession financial market stock business economy loop.
00:06
HD
Decrease in stats and economy concept showing financial decline, business recession, market loss, investment downturn, and economic crisis data visualization
00:16
HD