A link to set your password has been sent to: To access your purchases in the future you will need a password.
Create without limits — unlimited downloads, plus powerful AI editing
New filters added
Sort by

19,768 results for increase and decrease in videos

digital, economy, finance, management  graphic Arrow growth down animation.
00:10
HD
Small multi window charts stock and market report, trading Infographic Index Indicator, close up shot dark blue screen display, price numbers volatility fluctuation
00:20
HD
A futuristic robot finger touches a digital cost chart, showcasing the interaction between technology and data analysis in a modern office environment. Synapse
00:15
HD
Impact of Light Pollution on Health: Close-up of Dilated Human Eye. Concept Light Pollution, Human Health, Dilated Eye, Close-up Photography
00:04
HD
Animation of Charging level on a circular gauge moving from low to high and back. Can be used to show increase or decrease. Perfect for battery, devices, and energy visuals.

00:26
HD
Business Bar Chart Growth Report Data Visualization On White Background
00:10
HD
Red Downward Stock Market Chart with -$1,000 Loss on Black Background, Falling Financial Graph and Negative Business Trend Concept for Investment, Finance and Trading
00:06
HD
Neon Up and Down arrow animation. Glowing Business up and down growth indicator arrow motion. business growth concept 4k video.
00:12
HD
Carbon neutrality concept. increasing loading with carbon reduction for decrease CO2 or carbon neutral 2025 to 2050. Net zero greenhouse gas emissions target Climate neutrality long term strategy 2050
00:10
HD
Red arrow showing stock market crash across black cubic blocks. Business financial data decrease with falling trend line.
00:08
HD
Business growth concept in graph chart showing marketing sales profit increasing to future target. Graph chart showing marketing sales profit target growth in future. Growing business ideas.
00:10
HD
Green Bar Chart Showing Growth and Decline Over Time.
00:11
HD
Blue financial line graph animation representing business data fluctuation on white background
00:05
HD
Animated Weekly Data Chart: Visualizing Business Trends with Dynamic Bar Graph
00:05
HD
Abstract cost reduction concept animated on black screen. Animation of low budget, effective business graph, expense reduce, quality increase and cost optimization 4k video.
00:08
HD
Abstract decrease icon on black background. Dollar rate down looped icon. Reduce costs sign and symbol. Motion graphics of concept. animation
00:06
HD
Learn effective budgeting techniques that can help improve financial health. Discover how to manage expenses and increase savings in easy steps
00:05
HD
Business growth concept in graph chart showing marketing sales profit increasing to future target . growing business concept. Clean Hi-tech style technology chart
00:10
HD
Animated Bar Graph with Sparkling Stars.
00:10
HD
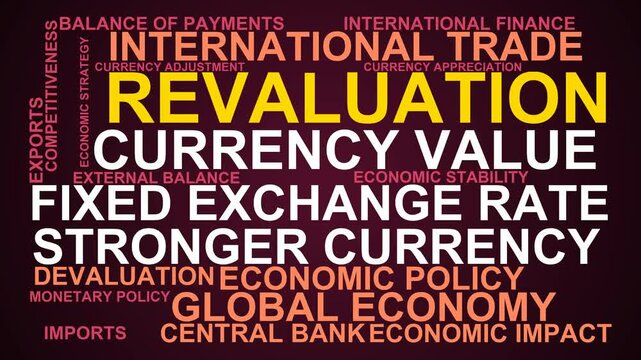
Revaluation Word Cloud
00:11
HD
Bar chart glowing in blue neon light indicates a downward trend icon signifying a reduction in growth or revenue metrics for analytical corporate data visualization on a dark professional interface.
00:10
HD
Colorful bar graph representing data visualization, showcasing growth and trends in a business context.
00:05
HD
Cost reduction and cost saving through digital transformation, business cost optimization, operational cost reduction, financial savings, and resource efficiency strategies for business success. Elide
00:14
HD
Animated Metabolism level scale with arrow, Metabolism indicator gauze for weight management and health awareness.
00:10
HD
Neon glowing medical thermometer icon animation. That's indicates weather temperature 51 degree increase or decline. Thermometer equipment showing hot or cold weather.
00:10
HD
Advanced digital infographic display featuring cost reduction strategy with animated business financial growth charts, security locks, and efficiency gears in a modern corporate technology interface
00:17
HD
Professional business growth graph chart with rising monthly revenue, glowing arrow animation, and increasing sales performance on black background illustrating financial goals
00:17
HD
Zoom in and out animation the verified badge symbol. Large black symbol in the center and four small symbols around. Seamless looped 4k animation on white background
00:12
HD
Digital Business Stock Market Data and Growth Financial Trading Chart  Animation looping Seamless Motion Background. Business stock data concept
00:19
HD
Abstract increase icon on green background. Dollar rate up looped icon. Reduce costs sign and symbol. 4k video animation
00:10
HD
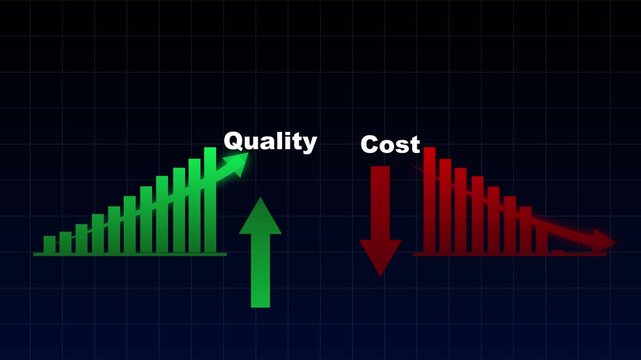
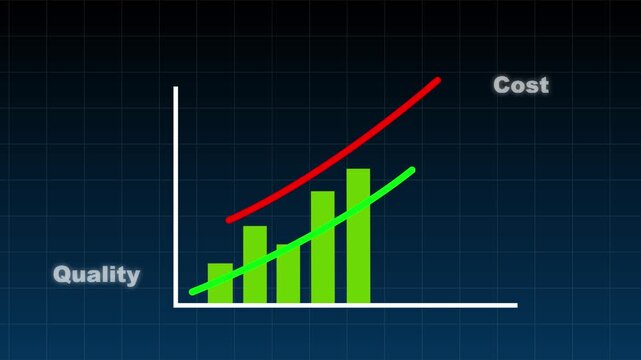
Business Performance Graph Showing Increasing Quality and Decreasing Costs, Representing Process Improvement, Operational Efficiency, Cost Optimization, Productivity, and Strategic Growth
00:10
HD
Business growth concept in graph chart showing marketing sales profit increasing to future target . growing business concept.
00:10
HD
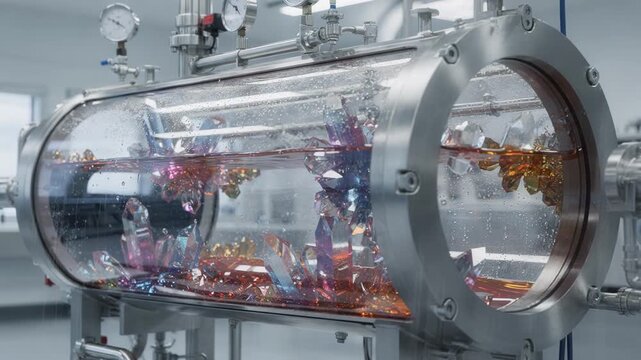
Medium shot capturing a vacuum crystallizer in action showing reduced pressure environment facilitating dye crystallization with clear crystal growth inside the chamber.
00:05
HD
Bar chart animation with cyan text grid. Bar chart market analysis data. Bar chart business statistics graphic on black.
00:12
HD
Business growth chart with icons representing home, people, gears, globe, book, email, and phone graph
00:10
HD
Animated hand drawn arrows indicating growth and downward trends. 4K
00:52
HD
Simple Yellow Line Graph with Axes on Black Background chart data. Minimalist yellow line chart showing trends along axes, sleek abstract representation of data visuals.
00:06
HD
Ticker display. table grid Stock exchange screen number with financial trade index rates, finance fund stocks price increase and decrease charts arrow up and down
00:20
HD
Business efficiency concept, business shows how much a company or organization can produce as it relates to time, cost and quality with on background
00:20
HD
Bicycle Parking Mandates Word Cloud
00:09
HD
pixel art bar chart showing financial decline, decreasing graph with red line, stock market crash, economic recession, data analytics
00:06
HD
Abstract Financial Data Graph with Teal and Orange Bar Charts, Floating White Pink Line Overlay, and Glowing Data Points on Dark Grid Background for Business Motion Graphic, Corporate Tech VJ Loop.
00:12
HD
Cost reduction and cost saving through digital transformation, business cost optimization, operational cost reduction, financial savings, and resource efficiency strategies for business success. Muxer
00:15
HD
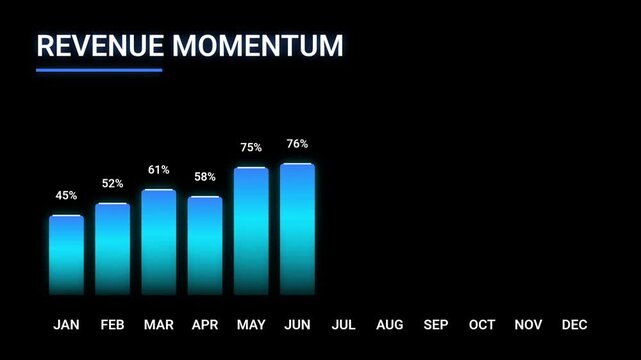
Blue Revenue Momentum Bar Chart Animation
00:10
HD
45 statistic glowing digital number on black background for business growth and data analysis
00:06
HD
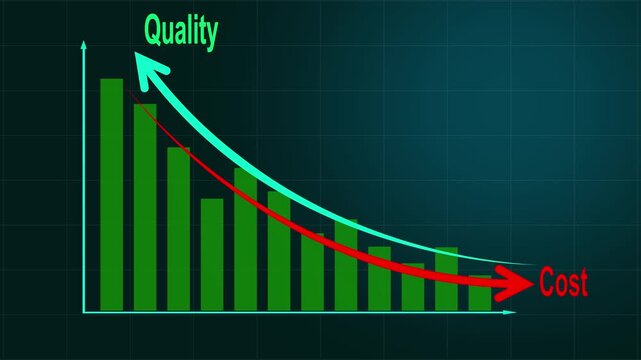
Cost reduction and quality improvement concept. Green bar chart with line arrow falling cost and quality increase. Successful business strategy, efficiency, product optimization and management
00:10
HD
Business graph  growing  concept. Abstract decreasing business graph chart animation. down business graph icon. animation arrow on black background.
00:10
HD
Glowing Neon Up and Down Arrows Symbolizing Exchange, Growth, and Data Flow on a Black Background.
00:10
HD
Corporate Success Animation Rising Arrow on Business Graph
00:10
HD
Declining Graph Line Illustration Showing Downward Trend.
00:10
HD
Rising Business Costs and Declining Quality Concept Showing Increasing Expenses, Falling Product Quality, Operational Challenges, Reduced Efficiency, Poor Performance and Negative Business Growth
00:10
HD
Business graph chart arrow line down blue color animation on white background. growth concept blue moving.
00:15
HD
Abstract geometric progression of circles in shades of gray.
00:05
HD
Front view of moving digital Business Growth Financial Trading Chart and Stock Market Data Animation looping Seamless Background. Business data concept
00:27
HD
Hand holding borrower with dollar coin, showing decreasing interest rates and increasing financial savings while managing home loans and debt
00:17
HD
Minimalist Animated Graph Showing Business Growth and Decline
00:08
HD
Financial business Loss down graph chart animation on black background. Business Info graphic animation, Bar graph. business loss graph show chart
00:06
HD
Business growth concept in graph chart showing marketing sales profit increasing to future target . growing business concept. Clean Hi-tech style technology chart
00:10
HD
Ticker display. table grid Stock exchange screen number with financial trade index rates, finance fund stocks price increase and decrease charts arrow up and down
00:20
HD
Animation of business graph on black background. 4k video
00:10
HD
Fuel gas gauge meter decreasing and increasing with alpha channel. Full gas fuel gauge dial 2d animation black screen
00:10
HD
Graph and numbers in stock market. Business Success and growth concept. Monochrome. Abstract financial chart on screen display. Loop animation.
00:15
HD
Cost reduction and cost saving through digital transformation, business cost optimization, operational cost reduction, financial savings, and resource efficiency strategy for business success. Funnel
00:12
HD
Vibrant yellow bar chart on black grid background showcasing statistics, trends, and visual data insights. Fluorescent Yellow Bar Chart with Grid on Black Background graph data.
00:08
HD
Animation of speaker volume with alpha channel, Speaker volume animation with transparent background
00:08
HD
Abstract decreasing business graph chart animation. Animated down graph icon designed in flat icon style. Growing financial statistics graph animation, motion graphic about business infographic .
00:10
HD
50289194
00:12
HD
Timelapse 4k of a chimney of the condominium heating system. The low rays of the winter sun enhance the puffs of smoke that increase and decrease depending on the engagement of the boiler.
00:11
HD
Animated bar graph icon appearing on green screen background, symbolizing statistics and growth
00:05
HD
Stack of cubes with growth and decline graph icons on light background
00:10
HD
Dynamic animated graph showing rising and falling stock market trends over time, financial data visualization, business growth charted, economic analysis
00:08
HD
Business graph chart arrow line down red color animation on white background. growth concept red moving.
00:15
HD
abstract purple background increasing and decreasing rectangular tiles 3d render looped animation
00:09
HD
An image of a tree with carbon molecule-shaped roots showcasing the link between nature's carbon sequestration and corporate environmental responsibility. Corporate carbon reduction
00:10
HD
Cartoon animation of a simple business financial graph from profit growth until bankrupt with text in funny concept  in 4k ultra HD
00:11
HD
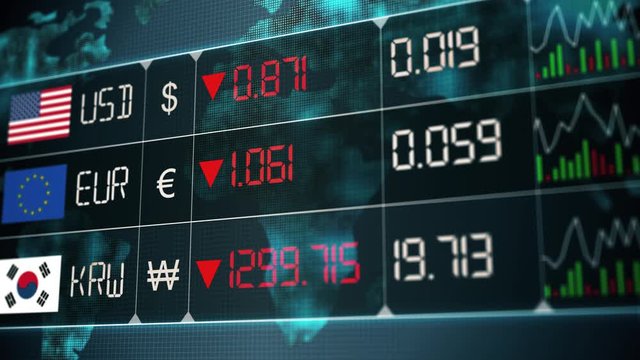
Evolution of Korean Won, Euro, US dollar currencies with up and downs. Currency market with green and red digital animation of prices in the world, with financial and ecomonic crisis
00:20
HD
Zoom in and out animation the octagon symbol. Large black symbol in the center and four small symbols around. Seamless looped 4k animation on white background
00:12
HD
Neon glowing medical thermometer icon animation. That's indicates weather temperature 90 degree increase or decline. Thermometer equipment showing hot or cold weather.
00:10
HD
Line graph
00:15
HD
3D Data Visualization: Charts and Graphs for Business Analysis
00:08
HD
Cost Reduction Profit Growth Businessman Analyzing Financial Data on Tablet with Animated Graph
00:08
HD
Cost reduction concept on black background. Increase quality, speed, efficiency, and Optimization for products or services to improve company performance
00:10
HD
Cost reduction and cost saving through digital transformation, business cost optimization, operational cost reduction, financial savings, and resource efficiency strategies for business success. Muxer
00:20
HD
Green up arrow and red down arrow motion animation comparing growth and decline, success and failure concepts on clean minimalist background
00:16
HD
Business graph chart with growing business concept. Abstract decreasing business graph chart animation  arrow on black background.
00:10
HD

Bar chart animation showing changing data values, representing business analytics, statistics, performance comparison, financial reporting, growth and market trends.
00:06
HD
Red colorful downward trend arrow graph on black background symbolizing representing financial and market loss, market decline, business decrease, economic crisis, and negative growth concept.
00:06
HD
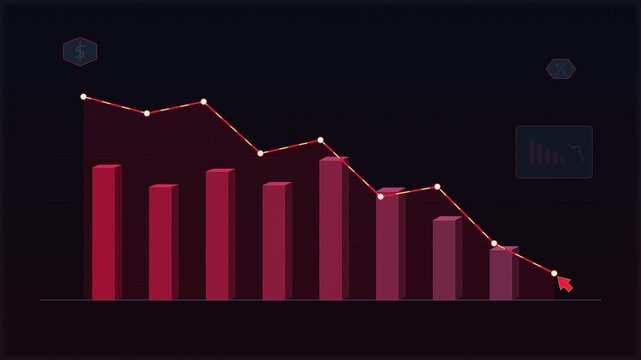
downward trending bar chart and line graph motion graphic, showing financial loss and economic recession
00:06
HD
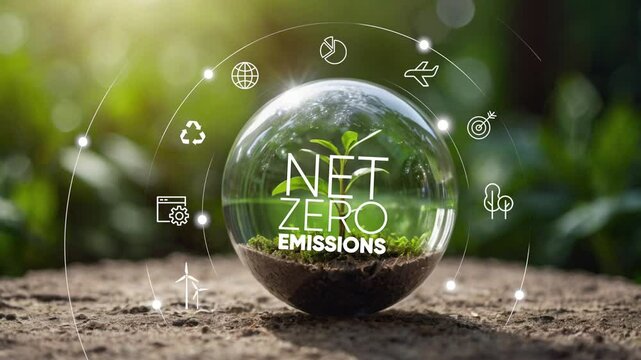
Circular economy concept for future business growth and environmental sustainability and reduce pollution for future business and environmental growth.Globe Glass with Net zero icons In Green Forest.4
00:15
HD
Animated Metabolism level scale with arrow, Metabolism indicator gauze for weight management and health awareness.
00:10
HD
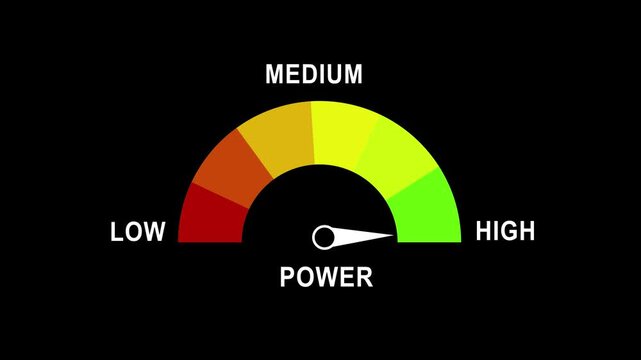
Power gauge meter animation with moving needle indicating low to levels on black background indicator
00:10
HD
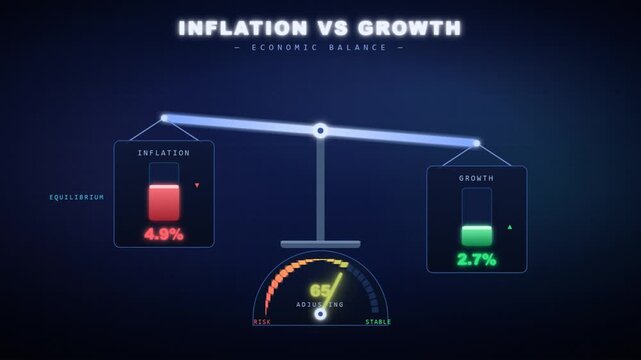
Economic balance scale animation weighing high inflation risk against low GDP growth
00:12
HD
Dollar prices rise in financial statistics graph in stock market and inflation rate animation, US Dollar price chart going Up. 4k green screen animation, money increase
00:13
HD
Business graph crash down with cyan arrow. Motion graphics of down business arrow with transparent background .
00:10
HD
Business Loss Graph .Loss concept business graph with white background
00:07
HD
Abstract Motion Graphics of red glowing bar chart data on a dark brick wall background loop.
00:10
HD
Red arrow with percentage symbol
00:06
HD
Red Line Graph Showing Gains 2D Animation
00:10
HD
Net zero carbon neutrality concept infographic with animated hud interface featuring business financial growth charts, and sustainable corporate strategy for modern environmental presentations
00:10
HD
Abstract directional arrow. moving arrow pointing to the right direction.
00:06
HD