A link to set your password has been sent to: To access your purchases in the future you will need a password.
Create without limits — unlimited downloads, plus powerful AI editing
New filters added
Sort by

241,798 results for graph statistic in videos

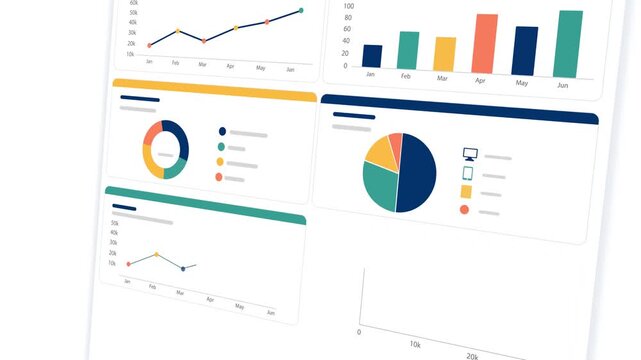
Modern Business Analytics Dashboard Animation with Multiple Data Visualization Panels like Charts, Graphs,  KPI Widgets, And Financial Statistics In A Clean Flat Design. Professional Website Metrics
00:49
HD
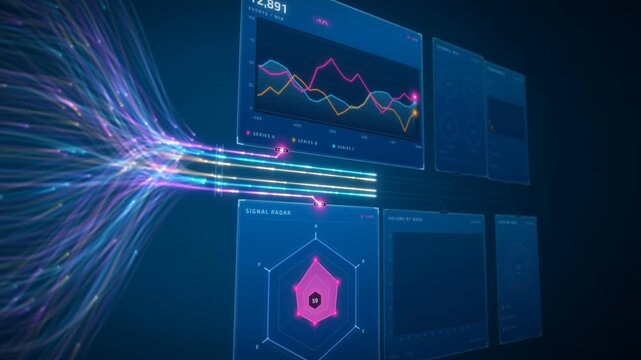
Data flow streams converging into a live analytics dashboard with radar chart, bar graphs and system load
00:16
HD
arrow rising transparent channel. Abstract arrow growth chart of economy icon black color animated down. business line animation. Abstract glowing neon line business graph growth arrow
00:10
HD
A vibrant red bar graph with a sharp upward trending curved arrow against a solid black background representing financial success and economic advancement
00:10
HD
financial statistics graph rising prices in stock market and inflation rate
00:15
HD
Finance growth chart graph stock market upward data analysis business abstract background with rising green line over bar graph showing market trend investment statistic concept digital chart
00:10
HD
Abstract neon arrow business graph chart icon animation background. Market Recovery Concept. animation
00:10
HD
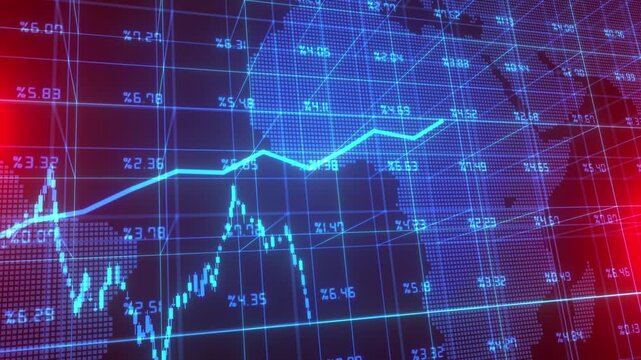
Financial chart with uptrend line graph and world map and graph chart of stock market investment trading concept
00:20
HD
Business growth data graph showing financial success and rising statistics over blue digital grid background.
00:30
HD
Business graph with percentage, shopping discount and tax adjustment concept, interest rate changes to fight inflation, investment return, Bar Chart Animation 2040 with Rising Arrow, 4k quality graph
00:09
HD
Businessman suffering financial crisis with red stock market crash graph in background motion video for professional corporate investment projects
00:05
HD
4K motion graphic of decreasing graph or stock market with transparent alpha channel. 2D transparency cartoon animation of red arrow falling down video isolated on white background.
00:05
HD
Oil Industry Growth Visualization with Graphs and Icons
00:10
HD
Business stock market trading graph growth chart concept Infographics animation rising up arrow. Futuristic Data Analytics Dashboard statistics finance visuals business reports, marketing sale profit
00:15
HD
AI SEO assistant data, Futuristic digital finance growth chart data analysis technology background neon green glowing line graph stock market business success trend
00:06
HD
Smart city skyline of Chicago showing futuristic financial data, stock market infographics, business analytics, big data visualization over urban landscape
00:06
HD
A looped 3D animation of glowing blue and pink financial line charts moving across a dark digital grid, depicting dynamic market fluctuations, stock analytics, and modern data visualization.
00:10
HD
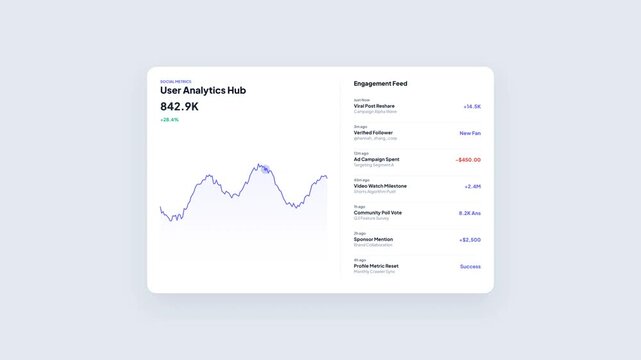
User Analytics Hub Marketing Social Performance Dashboard with Moving Line Graph Trend and Engagement Feed Activity Stream Notification Animation
00:08
HD
Motion animated footage. Statistics bars columns growth, arrow up. Finance, Bar graph going up, Profit concept, positive increase chart. business graph animation
00:10
HD
Top down aerial view of professional businessman analyze stock market chart with tablet with investment graph placed at table while investor group pointing at tablet. Creative business. Directorate.
00:16
HD
Motion animated footage. Statistics bars columns growth, arrow up. Finance, Bar graph going up, Profit concept, positive increase chart. business graph animation
00:10
HD
Analytics dashboard interface showing revenue charts user metrics and traffic data visualization
00:10
HD
Business growth concept in graph chart showing marketing sales profit increasing to future target on black background.4k video
00:12
HD
Neon business graph chart icon animation background. Neon business growth concept. Glowing neon business graph chart icon animation background
00:10
HD
rad bar chart graph rising up animation for video overlay, financial success and statistics motion graphic
00:12
HD
Arrow up business graph icon animation. Increasing business growth chart animation. Going up business graph concept. By Motion expert.4k video
00:10
HD
Downward trend graph animation video on a white background
00:06
HD
Light green candle chart stock market, graph diagram and statistic information business financial investment wealth display index
00:20
HD
Glowing neon Success stairs sign with flag icon animation  Neon glowing Person Climbing Stairs Towards Success flag, Glowing neon business graph chart concept. on black background ,4k video
00:10
HD
Business growth concept in allusive graph chart showing marketing sales profit increasing to target . Excellent financial status of corporate business rise up.4k animation video graph
00:10
HD
Accountant analyst in office reviewing computer data. Screen shows charts graphs and a financial report as coworkers talk nearby in a bright workspace. Simple concept of finance analysis.
00:09
HD
Businessman touching on hologram digital dashboard overlay showing graph charts, map and growth data animation, Holographic modern business analytics, finance planning and market performance
00:10
HD
A glowing red line graph showing a downward trend on a dark grid background
00:07
HD
business graph with arrow animation, Business Infographic bar animation, trading bar chart graph going up line. stock market business Profit concept, Business Success growth trending graph animation.
00:11
HD
Growth, arrow up. Finance, Bar graph going up, Profit concept, positive increase chart. graph with rising 4k Animation video on white Background
00:10
HD
Declining bar chart with downward trend, Blue bar chart with falling line graph decline in business data, finance performance and analytics animation
00:07
HD
Animated bar chart graph rising and falling financial animation
00:12
HD
Red downward arrow symbolizing economic decline, ideal for financial reports, presentations, articles, and social media posts on negative trends.
00:08
HD
3D render: Abstract digital financial data charts background. Futuristic business analytics, market research, global network concept. Big data report, statistic visualization. Ideal for tech
00:20
HD
Top view of businesswoman bring financial statistic graph during meeting. Manager putting tablet with stock market investment on table while business team brainstorming marketing idea. Directorate.
00:16
HD
Business intelligence and financial performance analysis report on white background, animated infographic bar chart loop, investment data analytic graph dashboard, enterprise market statistics trend
00:14
HD
Growing line chart graph - business development competition concept animation. Hi tech style charts with grid. Camera movement with depth of field.
00:15
HD
Growth, arrow up. Finance, Bar graph going up, Profit concept, positive increase chart. graph with rising up arrow and bar stats 4k video animation
00:10
HD
Neon business graph chart icon animation background. Neon business growth concept. Glowing neon business graph chart icon animation background
00:10
HD
Top Down View of Businesswomen and Businessmen Meeting Around Office Desk With Laptops and Reports as Linked Visualization of Glowing Icons Statistics, Cybersecurity, SAAS and AI.
00:07
HD
Hand placing a bar on a chart while displaying various types of graphical representations, concepts of data analysis, financial growth, and business strategy
00:17
HD
graph chart business progress up and down on a dark teal grid background chart line curve Business Success growth graph animation
00:15
HD
Light green candle chart stock market, graph diagram and statistic information business financial investment wealth display index
00:20
HD
Digital graph of a stock market with a rising pink arrow showing financial growth and success on a blue background
00:08
HD
Financial stock market green line graph rising steadily in a digital animation video showing positive growth and high trading volume
00:10
HD
3D bar graph with an upward trending arrow indicating financial growth and success business finance
00:05
HD
 business bar chart graph growth animation with upward arrow on black
00:08
HD
GDP growth economic indicator chart with rising bar graphs and HUD radar
00:15
HD
Gaussian curve area under graph
00:08
HD
Animated horizontal line chart with glowing area fill showing positive business growth trajectory on dark background
00:08
HD
Declining bar chart with downward trend, Blue bar chart with falling line graph decline in business data, finance performance and analytics animation
00:08
HD
Animated bar chart with rising trend arrow showing business growth and financial success
00:05
HD
File #: linguistically neon arrow business graph chart icon animation background. Market Recovery Concept. Successful growth trend Green line graph going Up.
00:10
HD
Analysts teamwork discuss finance data and dashboard. Colleagues review charts on computer screens and printouts, aligning analytics with metrics. Concept image of collaborative office analysis.
00:11
HD
A cheerful woman wearing a virtual reality headset interacts with engaging data visualizations, highlighting the intersection of technology and content marketing. Raster
00:15
HD
Minimal flat animation of a laptop displaying a rising data chart with incoming data lines and a statistics icon, representing analytics, data analysis, and business performance insights.
00:10
HD
Statistics bars columns growth, arrow up icon. Finance, Bar graph going up, Profit concept, positive increase chart. business graph animation. Business growth concept in graph chart showing marketing
00:10
HD
Bar graph animation with dashed line. Bar graph blue upward trend on grid. Bar graph business statistics graphic on black background for performance tracking.

00:11
HD
Financial Stock Chart Market Analysis Data Visualization financial data trends, price movement, analytics indicators. trading visuals, investment strategies, economic reports, fintech presentations.
00:20
HD
Top Down View Corporate Office With Multiethnic Workers at Computer Stations as Linked Visualization Layer Appears, Glowing Blue AI Icons, Cybersecurity, Connectivity and Workflow Automation.
00:10
HD
Glowing bar graph rising showing financial growth and success in a modern digital environment chart business
00:06
HD
Loss business graph icon animation 4k isolated on white background
00:06
HD
Light green candle chart stock market, graph diagram and statistic information business financial investment wealth display index
00:20
HD
Down arrow business graph chart animation. Loss business graph icon animation.  on black background. 4k video
00:10
HD
Stock Market monitor screen while open market for trading sell and buy stock online. Business economic and finance concept.
00:22
HD
Close-up of a stock market graph with red and green candlestick charts on a dark grid background with a cinematic lighting effect conveying a sense of financial analysis and trading
00:05
HD
Growth, arrow up. Finance, Bar graph going up, Profit concept, positive increase chart. graph with rising up arrow and bar stats animation.
00:10
HD
AI SEO assistant data, Financial growth stock market business chart green arrow success investment profit digital graph upward trend economy business growth chart financial
00:08
HD
Business graph chart with growing business concept. Finance, Bar graph going up, Profit concept, positive increase chart. Going up business graph concept on white background.
00:06
HD
neon arrow up business graph icon animation. business chart growth concept.
00:10
HD
Stock market ticker terminal screen showing multiple live trading graphs and financial charts
00:30
HD
Data Analyst analyze Data Financial Dashboard and Touch screen Monitor.
00:13
HD
Digital data graph with glowing blockchain network and modern finance technology background
00:10
HD
Couple budget planning on finance dashboard online. They review savings and monthly expenses on a computer at home using charts analytics for smarter choices. Clear concept of home finance teamwork
00:08
HD
A visually striking abstract digital background featuring graphs and data visualization over a sleek glass building facade, representing modern technology and finance development. Xenic
00:10
HD
Stock market candlestick chart hologram on digital world map,global financial index analysis,business economy investment.Global market analysis world map with stock market graph overlay animation
00:15
HD
Green financial graph showing rapid total growth in percentage and revenue
00:12
HD
Digital line graph tracks upward moving corporate revenue. Interactive line graph demonstrates successful financial forecasting. Economic growth concept with corporate line graph.
00:10
HD
Financial Loss Graph Animation Showing A Dramatic Stock Market Crash With Falling Red Chart Line, Negative Dollar Values, Downward Arrows. Concept Of Economic Recession, Volatility, Investment Failure
00:19
HD
Top Down View Corporate Office With Multiethnic Workers at Computer Stations as Linked Visualization Layer Appears, Glowing Blue AI Icons, Cybersecurity, Connectivity and Workflow Automation.
00:10
HD
Positive trend shows by glowing green arrow graph moving upward, financial growth animation on transparent background, perfect for economic growth, stock market, or business themes
00:06
HD
Close-up of financial charts displaying stock market data on a digital screen. Dynamic red and green graphs represent fluctuating stock prices in a modern trading environment.
00:10
HD
Rising increase index broker progress report, diagram graph management strategy rate chart global target economic, statistic stock financial trade investment analysis finance
00:20
HD
Businesswoman calculating finances and analyzing business data
00:14
HD
Stock Market Chart, Beautiful 3d Animation of Japanese Candlestick Graph in Time Lapse. Seamless Looping Ultra HD 4K 3840x2160
00:30
HD
Blue animated business growth bar chart with rising trend line
00:10
HD
Growth, arrow up. Finance, Bar graph going up, Profit concept, positive increase chart. graph with rising up arrow and bar stats animation.
00:10
HD
  

neon line business graph icon animation Neon business graph chart icon animation on isolated black background. Neon business growth idea animated
00:10
HD
abstract cyan color business graph chart icon animation, business growth concept animation
00:10
HD
3D business infographic line graph with data animation elements on a white background. Futuristic financial chart HUD interface loop.
00:12
HD
Economic inflation rise in interest rates financial graph percentage statistics
00:17
HD
Neon Business chart icon isolated . business chart growth concept black background 4k.Zigzag up right arrow color.Increasing green arrow
00:08
HD
HUD Graph With Rising Arrow
00:10
HD
Dark blue graph charts on a futuristic cyberspace background
00:15
HD
Close-up of hands typing on a keyboard with a digital graph overlay showing upward trends, symbolizing business growth and the influence of technology in data analysis. Copula
00:10
HD