A link to set your password has been sent to: To access your purchases in the future you will need a password.
Create without limits — unlimited downloads, plus powerful AI editing
New filters added
Sort by

7,246 results for etrade in videos

Digital display showing multiple financial charts and data analytics with dynamic graphs and real-time statistics.
00:05
HD
Abstract Digital Financial Candlestick Chart with Glowing Blue and Pink Bars on Dark Background
00:20
HD
Dual Monitor Setup for Stock Trading: Two large curved monitors display complex stock market charts and graphs in red and black, set against a dark desk with a keyboard and mouse.
00:08
HD
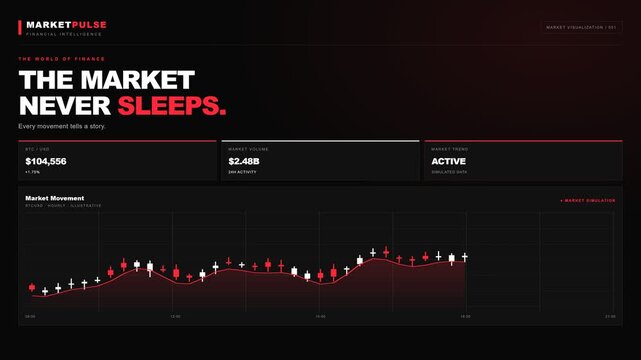
Financial Market Analysis Dashboard with Rising Candlestick Chart on Digital Trading Screen
00:11
HD
Real Time Energy Commodities Stock Market Telemetry Screen Displaying Crude Oil and Gas Prices
00:15
HD
Futuristic spatial glassmorphism analytics dashboard with live data charts
00:15
HD
Cryptocurrency trading chart on a bright white screen, with candlesticks, volume bars, and a coin watchlist, at an angle with depth of field
00:27
HD
Financial Graph and Economic Inflation with Rising Interest Rates and Recession Data
00:15
HD
3D animation of a financial candlestick chart showing market trends, stock prices, and percentage gains. Features a dark blue bokeh background with glowing particles for trading themes.
00:15
HD
A bright blue shopping cart icon on a black background featuring a red circular badge with a white dollar sign, representing a paid item or pricing.
00:10
HD
Financial stock market chart with glowing green candlesticks rising
00:05
HD
Online financial trading and stock market exchange concept
00:15
HD
Close up of a person analyzing financial charts on a computer screen. The image captures the focus on stock market trends and data visualization in a modern trading environment
00:10
HD
Cryptocurrency market price chart and trading data HUD interface in 4K
00:15
HD
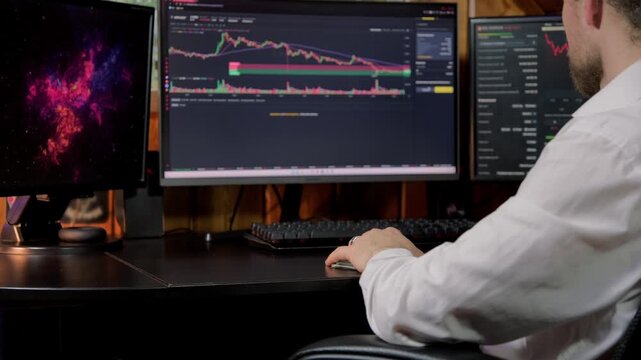
Trader monitors stock market trends on multiple screens during a trading session
00:38
HD
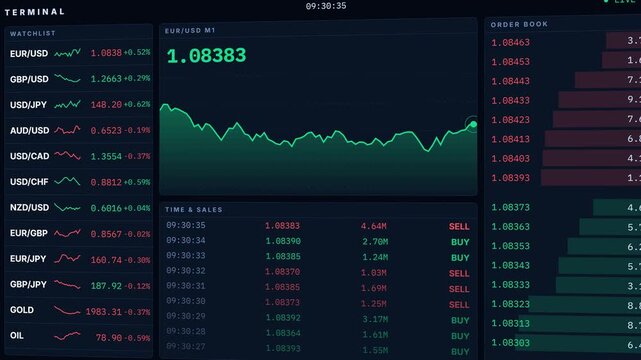
Trading terminal interface with watchlist, live price chart, order book and time and sales tape, forex market data screen animation
00:15
HD
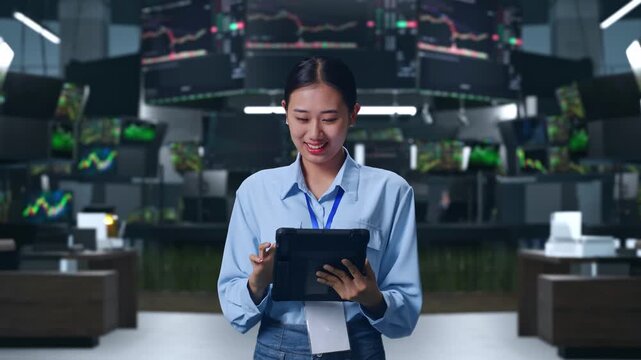
Asian Female With Her Tablet at Financial Trading Control Room, Work Continuously With Her Tablet
00:15
HD
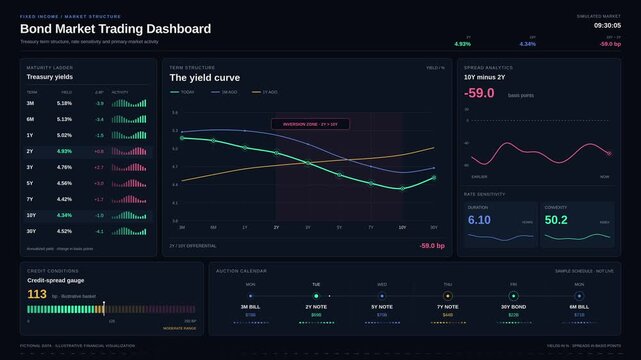
Bond market trading dashboard showing yield curve data and financial treasury statistics
00:15
HD
Dashboard Animation Showing Futuristic Graphs Charts and Digital Globe for Business Analytics
00:15
HD
High Frequency Trading Market Depth Level 2 Order Book 4K Loop
00:12
HD
Neon Financial Chart Graph Trading Telemetry Data
00:05
HD
Digital Screen Displaying Real Time Cryptocurrency Trading Charts and Financial Market Data Analysis
00:12
HD
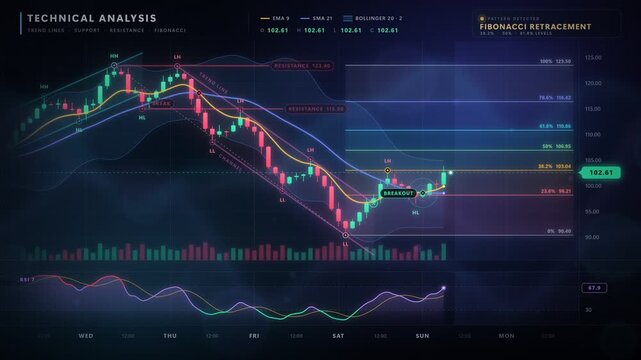
Technical Analysis Candlestick Chart With Trend Lines Support Resistance And Fibonacci Retracement
00:15
HD
Financial Trading Dashboard with Colorful Stock Market Charts and Real Time Price Data
00:05
HD
Rising financial chart across a glowing digital grid for market analysis. Financial presentations, investment analysis, and trading platform promotion.
00:10
HD
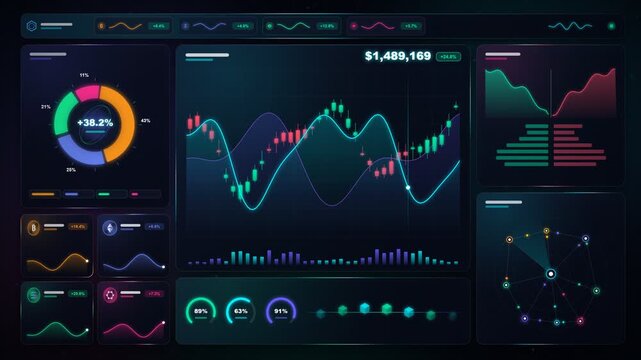
Crypto portfolio dashboard seamless loop animation with live candlestick charts and asset allocation donut
00:15
HD
Futuristic global financial data visualization, world map and digital globe with candlestick chart, stock trading analytics, forex market dashboard, fintech infographic, big data interface
00:20
HD
Stock Market and Global Economic Inflation with Interest Rates and Data Graph
00:15
HD
Financial Candlestick Charts Displaying Market Trends With Subtle Motion In Dark Blue Background
00:20
HD
Dynamic Stock Market Trading Graph with Fluctuating Data Lines
00:05
HD
Algorithmic Trading Signal Generation Chart
00:06
HD
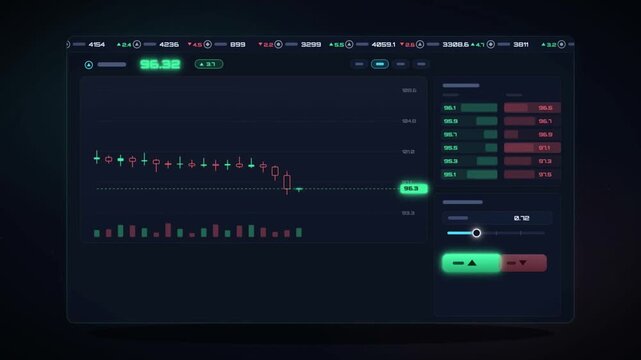
Animated stock trading platform interface with candlestick chart order book and buy sell controls
00:12
HD
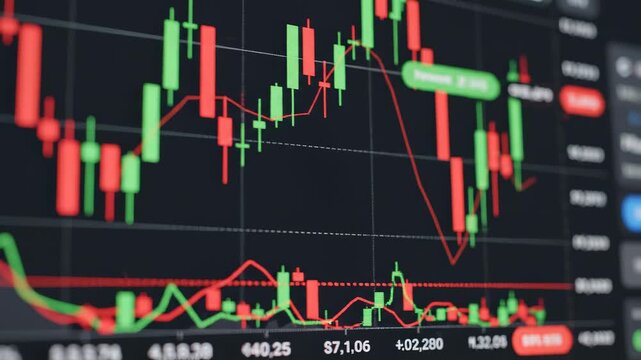
Candlestick chart analysis with moving averages during volatile market conditions
00:06
HD
Futuristic financial stock market trading canyon with digital stock charts and data
00:15
HD
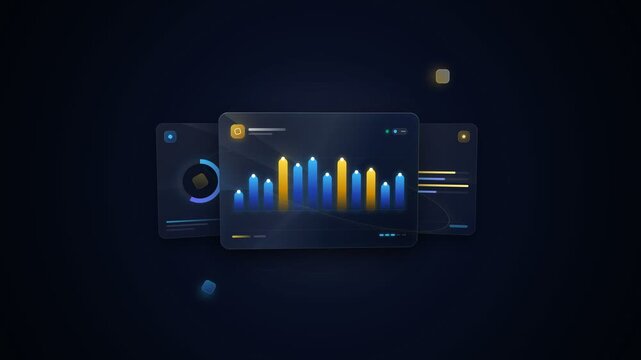
Futuristic dashboard interface displaying financial charts and analytics metrics for trading platforms with glowing blue and yellow indicators helping users track valuable investments
00:10
HD
Elegant stock market data visualization with animated candlestick chart, moving price lines and trading indicators on dark navy digital interface, seamless loop
00:20
HD
Full Body Of Asian Male Engineer With Safety Helmet Thinking And Looking Around Then Raising His Index Finger While Standing at Financial Trading Control Room
00:23
HD
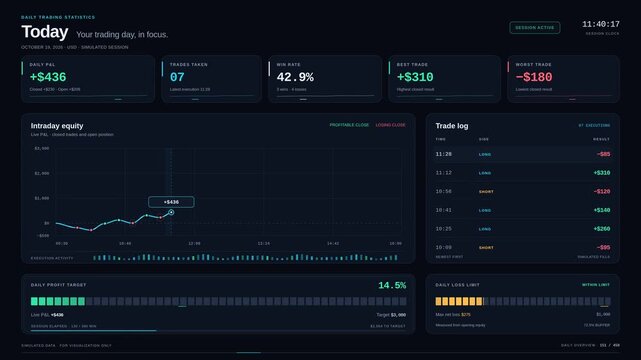
Daily trading statistics dashboard showing financial equity data on dark digital interface
00:15
HD
Professional Analyzing Financial Markets Using a Smartphone and Computer Monitors, Stock Trading Charts and Investment Data
00:11
HD
High security fintech data vault corridor with glowing financial server racks, encrypted blockchain nodes, and holographic security streams, futuristic banking cyberspace infrastructure
00:15
HD
Futuristic Financial Growth Chart with Rising Stock Market Candles and Digital Network Data Flow Representing Success and Investment Profit
00:05
HD
Digital Financial Trading Chart with Candlestick Graphs and Moving Average Line on Dark Blue Background
00:16
HD
A person analyzes a bullish stock chart on a mobile device, focusing on market growth and trading opportunities. Modern technology and finance merge in this dynamic investment scene
00:17
HD
Animated laptop display showing financial growth chart and analytics graph with rising bar metrics business analytics
00:16
HD
Stock Market Growth and Investment Analytics with Rising Financial Charts and Stacked Coins
00:08
HD
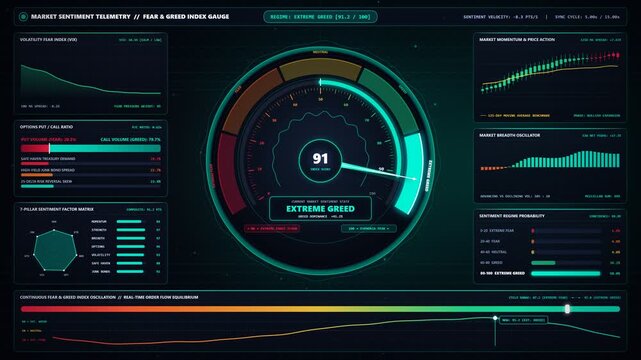
Financial market sentiment fear and greed index gauge meter oscillating from extreme panic to euphoria 4k seamless loop animation
00:15
HD
Stock Market Trading and Financial Data Analytics Visualization with Charts, Graphs and Business Intelligence Interface Background
00:10
HD
Mobile Smart Phone Trading Stocks and Shares on Investment App
00:20
HD
High Frequency Trading Market Liquidity Dark Digital Readout Loop
00:10
HD
Financial stock market dashboard with live index trading data and candlestick charts
00:15
HD
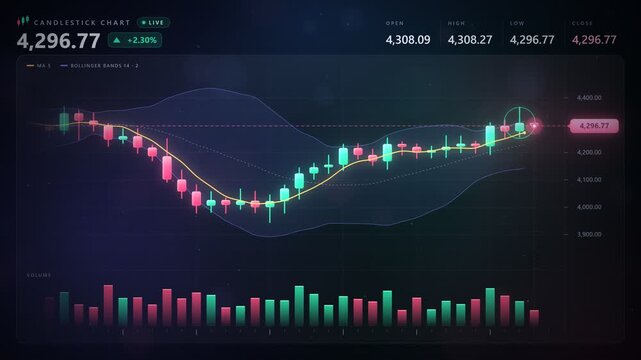
Live Candlestick Chart Stock Market Trading Animation With Bollinger Bands And Volume Bars
00:15
HD
Carbon credit token minting dashboard interface for esg sustainability and blockchain finance carbon credits
00:10
HD
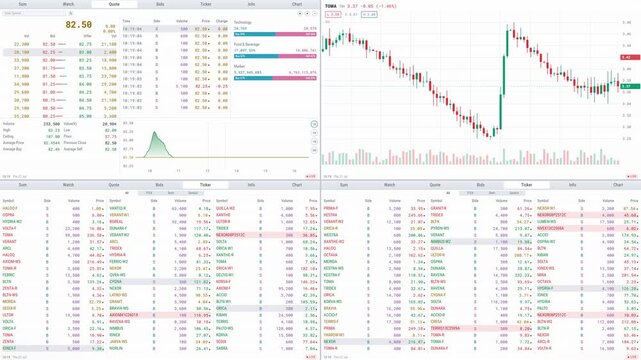
Animation of a light theme stock trading platform on white, candlestick chart, order book depth and red and green ticker tape updating in real time
00:17
HD
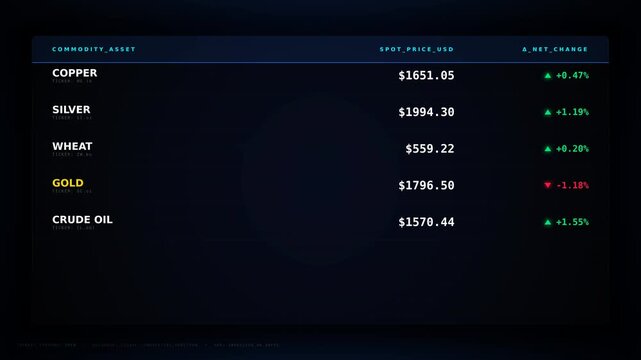
A financial trading screen displays real-time market prices for copper, silver, wheat, gold, and crude oil, with percentage changes
00:12
HD
Financial market stock exchange trading graph and data dashboard loop
00:15
HD
Abstract stock market trading graph with candlesticks and moving average line in red and blue colors on a dark background. ..Created with Generative AI, not depicting real subjects.
00:10
HD
Side View Of Asian Male Engineer With Safety Helmet Working On A Tablet While Standing at Financial Trading Control Room
00:16
HD
Smart FinTech Investment Portfolio Growth and Asset Management Dashboard Loop
00:12
HD
HUD financial market trading platform display interface showing live stock candle charts, digital investment strategy, 4k resolution transparent background alpha channel
00:10
HD
Isometric financial data grid with glowing market chart graphs, rising economic stock indicators, and digital analytics coordinates, modern corporate fintech business intelligence backdrop
00:15
HD
Global financial market data stock exchange hud loop with rotating globe and charts
00:15
HD
Abstract Digital Financial Candlestick Chart with Neon Blue and Purple Glowing Data Lines
00:10
HD
Dual Monitor Desk Setup 4K Loop - Bitcoin Trading Chart & Video Editing Studio Workstation
00:05
HD
Animated Financial Data Visualization with Dynamic Graphs and Fluctuating Stock Market Indicators Featuring Investment Analysis, Trading Platform
00:15
HD
Shopping, e-commerce, application and sales theme. Technology that passes through the phone and products that are on sale.
00:11
HD
Financial market sentiment fear and greed index gauge meter oscillating in 4k seamless loop
00:15
HD
Financial Trading Chart Animation with Market Data and Price Movement Business
00:30
HD
Global Economic Inflation and Interest Rates Financial Statistics Graph Animation
00:15
HD
Abstract Global Currency Exchange Analytics User Interface Animation Featuring Real Time USD EUR and GBP Forex Market Trends Data Visualization and Live Rate Fluctuations
00:10
HD
Financial growth and investment concept animation with rising stock charts and coins
00:15
HD
Dynamic forex trading digital circuit board background, animation with glowing, blue circuit lines, futuristic artificial intelligence, market growth, and, global financial investment concepts
00:10
HD
Stock Market Dashboard Animation with Financial Data and Trading Performance
00:15
HD
Cinematic Volatile Stock Market Candlestick Visualization with Dynamic Price Action for High Frequency Trading Dashboards
00:05
HD
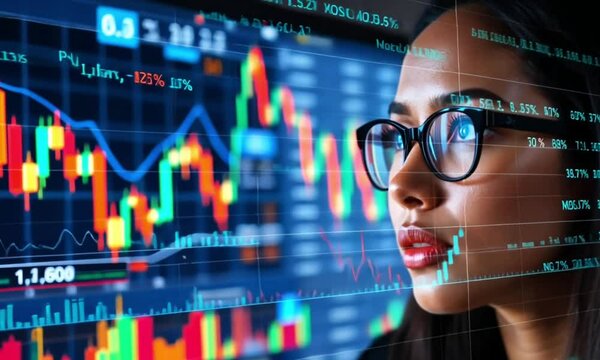
a woman wearing glasses looks at the trading chart screen
00:06
HD
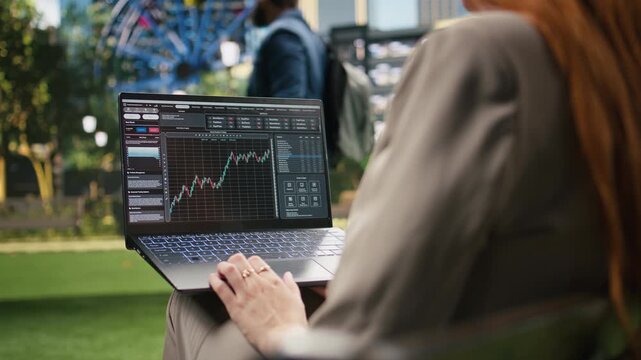
Positive investing result makes a happy woman celebrate while reviewing a financial trading platform and candlestick chart on her laptop from the urban park, after a successful currency trade.
00:20
HD
Futuristic Cyber UI Display featuring Animated Candlesticks and Financial Numbers
00:20
HD
Close Up Of Asian Female Engineer With Safety Helmet Smiling To Camera And Waving Hand Saying Bye While Standing at Financial Trading Control Room
00:24
HD
Cryptocurrency trading chart animation with candlesticks, volume bars, and breakout signal for financial market analysis
00:05
HD
Financial Market Data Interface Displaying Real Time Asset Price Fluctuations and Statistical Trend Analysis for Global Investment Trading Platforms
00:10
HD
Futuristic financial stock chart with glowing blue and red candlestick patterns on dark grid screen, representing market analysis and crypto investment strategies for fintech app designs, trading
00:10
HD
Algorithmic trading stock market charts and financial data analytics in motion
00:15
HD
Abstract Digital Financial Trading Chart with Candlestick Patterns and Data Visualization on Dark Purple Background
00:20
HD
Neon financial dashboard animation with glowing bar charts, growth graphs, and data analytics metrics
00:16
HD
Animated Financial Data Graphs Looping with Dynamic Green and Red Bar Fluctuations. Stock Market Visualization, Investment Analysis, Trading Concept.
00:15
HD
Sales of e-commerce products over the phone
00:10
HD
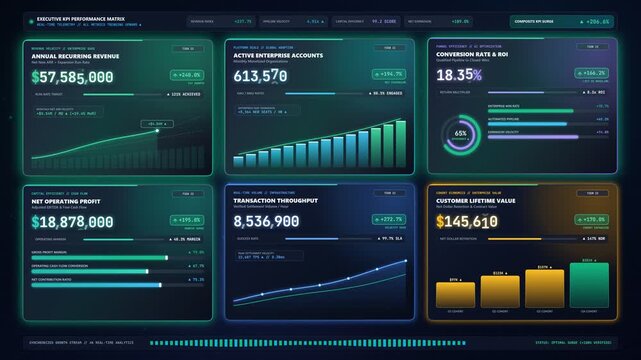
Increasing numbers on kpi cards with rising financial metrics and growth charts animation
00:15
HD
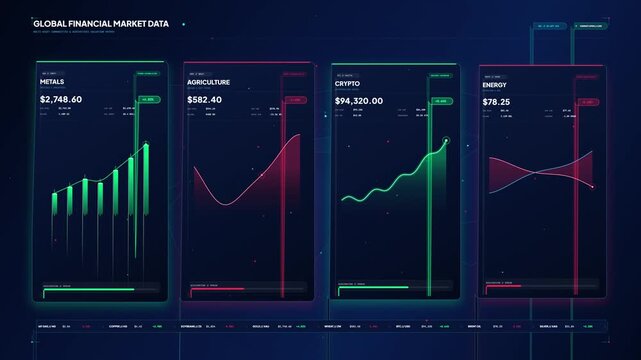
Global financial market data dashboard displaying metals agriculture crypto energy charts on dark blue digital screen.
00:08
HD
Interest Rates and Stock Market with Global Economic Inflation and Deflation Data
00:15
HD
Day Trading Text Animation on Black Background for Stock Market, Financial Trading,
00:06
HD
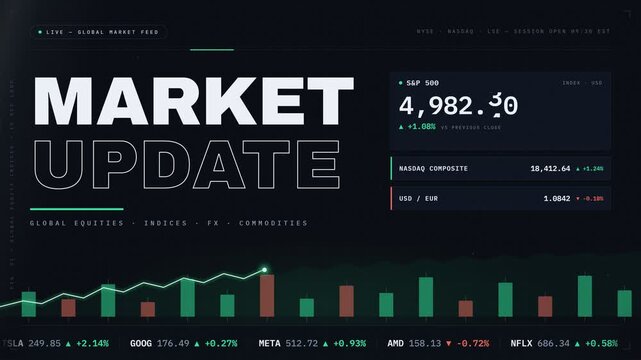
Financial market update dashboard with live stock ticker charts and trading data
00:15
HD
Comprehensive forex investment strategy concept displayed on a glowing blue digital circuit board infographic with animated business financial growth symbols, and advanced technology networks
00:10
HD
Animated motion graphics of a candlestick financial chart showing a bullish upward trend, ideal for trading, stock market, and cryptocurrency investment themes.
00:15
HD
Financial Orderbook Depth Scatter Chart Visualization
00:06
HD
Financial stock market trading candlestick chart and technical analysis indicators motion graphics animation video.
00:10
HD
4K motion graphics background featuring a global financial trading dashboard with dynamic candlestick charts, volume bars, trend analytics, and a world map visualization.
00:10
HD
A glowing stock market graph overlays a futuristic city skyline at night, symbolizing financial growth and global commerce. ..Created with Generative AI, not depicting real subjects.
00:10
HD
Close Up Of Asian Male Engineer With Safety Helmet Working On A Tablet While Standing at Financial Trading Control Room
00:29
HD
Professional 4K financial technology motion graphic illustrating global market data collection, processing engine, security validation, analytics engine, candlestick market chart, risk assessment gaug
00:08
HD
financial analytics, stock market growth, data visualization, business chart, digital dashboard, isometric graph, economic forecast, trading platform, network analysis, technology interface
00:06
HD
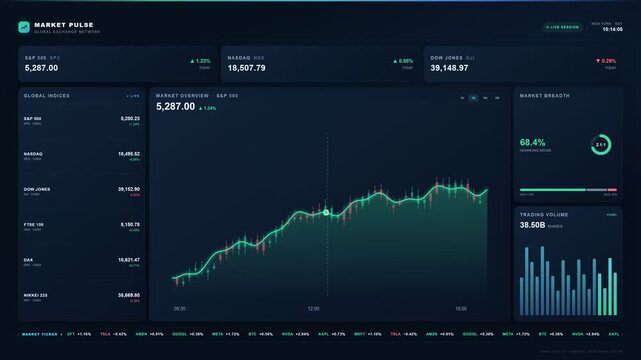
Financial Market Dashboard UI Animation Dark Background
00:20
HD