A link to set your password has been sent to: To access your purchases in the future you will need a password.
Create without limits — unlimited downloads, plus powerful AI editing
New filters added
Sort by

12,938 results for decrease arrow in videos

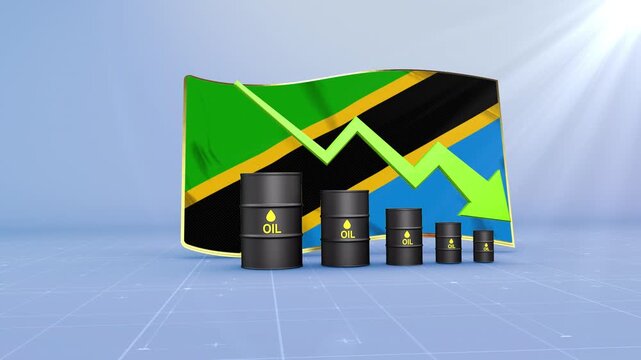
Tanzania Oil Price Falling with Oil Barrels Downward Green Arrow and 3D Financial Data Visualization Graphs for Economy and Business Concept
00:11
HD
Neon green recycling sign zooming in slowly against black background with glowing digital symbol for eco concept.
00:10
HD
4K animation of Falling Dollar Coin With Red Downward Arrows and Alert Icon Representing Financial Loss
00:06
HD
Futuristic Digital Concept Showcasing Real Estate Market Trends and Robotic Influence on Property Transactions and Home Valuation Sigmoid
00:10
HD
Reuse level indicator scale. Low Normal High meter infographic animation on black background. Showing high reuse level color gauge indicator for sustainability and eco-friendly practices.
00:10
HD
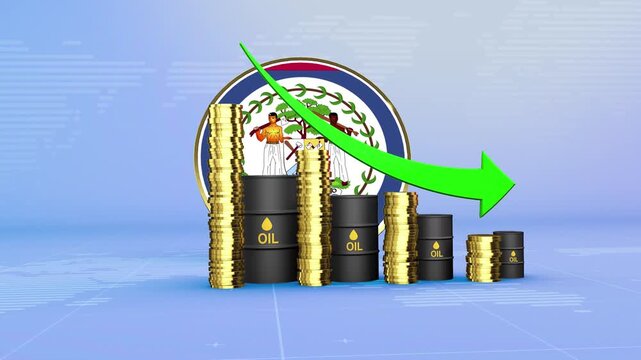
Belize Oil Prices Decline with Oil Barrels, Gold Coins and Downward Green Arrow, 3D Economic and Financial Market Concept
00:11
HD
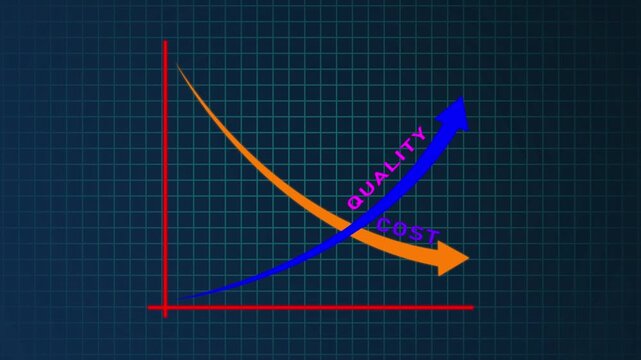
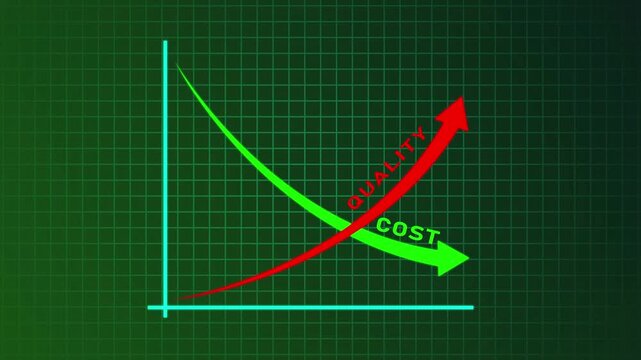
Quality improvement and cost reduction concept with blue quality line rising and red cost line falling. Concept of business strategy, management, efficiency and performance optimization
00:12
HD
metabolism rate level indicator scale. Low normal high meter infographic animation on black background. Showing high pressure level color gauge indicator.4k quality animation video
00:10
HD
Glowing neon Percentage growth and decline icon with up and down arrows. financial, business, and statistical analysis. Up and down percentage arrows icon. Perfect for reports and dashboards. 4k video
00:10
HD
Declining Financial Value Illustrated by Progressively Smaller Coin Stacks, Downward Arrows, and Percentage Symbols, Representing Falling Rates, Reduced Returns, Depreciation, and Economic Decline
00:10
HD
Businessman using calculator with percentage graph symbol and up arrow. Dividends and long term investment to beat inflation. Investment growth and profit. Glowing neon background. 4k
00:10
HD
Pixel Retro Green Screen Down Arrow Pop Animation With Smooth Vertical Pop Motion Prores Alpha Channel 4K 60fps
00:08
HD
Neon Dollar Sign with Downward Arrows in a Circle
00:10
HD
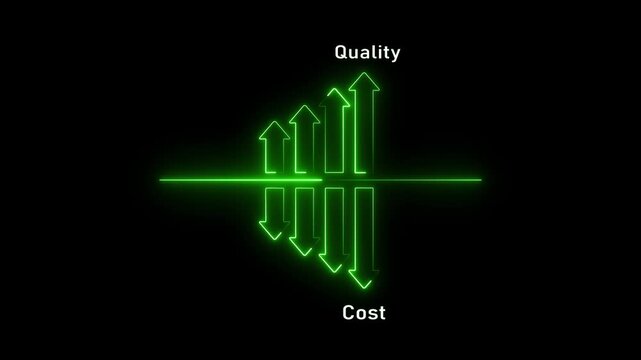
Conceptual illustrating the inverse relationship between and cost with upward green neon arrows representing increasing and downward green neon arrows representing decreasing cost reflected below a
00:10
HD
Downward arrow symbol with a dollar sign in a circle
00:08
HD
A glowing neon pattern of multiple chevron arrows pointing to the right, aligned in a horizontal row. The arrows have a bright orange-gold neon glow on a dark background,
00:10
HD
Black downward trending graph line over green screen grid. Financial loss chart for corporate business economic market crash. Animated graph chart loop.
00:08
HD
Abstract green chevron arrows descending on black background digital animation motion graphic
00:10
HD
Carbon dioxide reduction concept with neon cloud and arrows neon sign
00:08
HD
Operational expense chart visualizing financial analysis, budgeting, and cost management with rising expenses, risks, and careful monitoring for business strategy and success
00:17
HD
Italy Oil Price Falling with Oil Barrels Downward Green Arrow and 3D Financial Data Visualization Graphs for Economy and Business Concept
00:11
HD
Interest Rate Decline With Coins
00:06
HD
A repeating pattern of small red arrows pointing downwards on a bright green background.
00:10
HD
Businessperson Analyzing Real Estate Market Trends with Laptop and House Icon Representing Decrease in Mortgage Rates and Property Values Sigmoid
00:10
HD
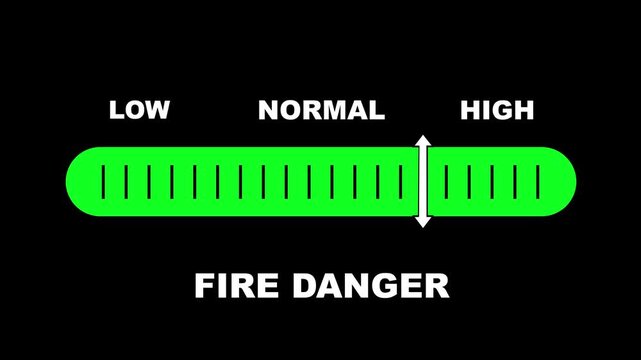
Fire danger level indicator scale. Low normal & high meter infographic animation on black background. Showing high fire danger level color gauge indicator for safety and risk monitoring.
00:10
HD
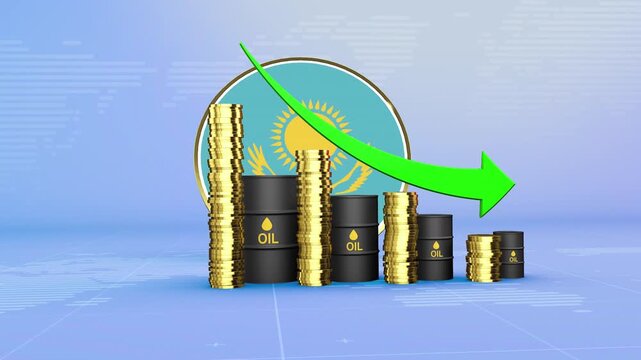
Kazakhstan Oil Prices Decline with Oil Barrels, Gold Coins and Downward Green Arrow, 3D Economic and Financial Market Concept
00:11
HD
Arrow up business graph icon animation. Increasing business growth chart animation. Going up business graph concept.
00:07
HD
Green recycling symbol rotates smoothly through a full circular turn and subtly scales, high quality video footage for sustainability, reuse, waste reduction, and environmental awareness
00:08
HD
threat index level indicator scale.Low normal high meter infographic animation on black background. Showing high pressure level color gauge indicator for health monitoring and safety analysis.4k
00:10
HD
Glowing neon line Global economic crisis news icon isolated on black background. World finance crisis. 4K Video motion graphic animation.
00:10
HD
Animated Dollar Icon with Down Arrow on White
00:10
HD
Water pollution level indicator scale. Low normal & high meter infographic animation on black background. Showing high water pollution level color gauge indicator for environmental analysis.
00:10
HD
Dollar Sign Cutting Corporate Budget Downsizing finance business animation HD 4K
00:10
HD
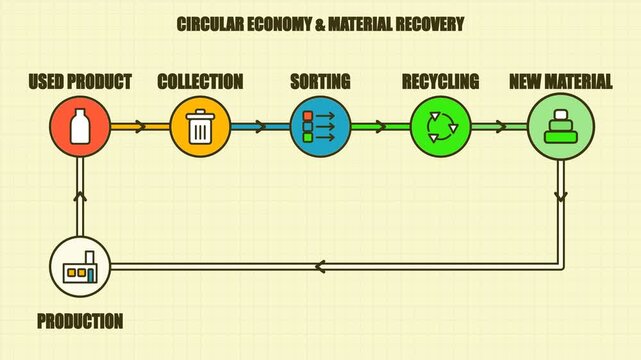
Conceptual Diagram of a Circular Economy Process for Sustainable Material Recovery and Waste Management
00:10
HD
Curved Down Arrow Hand Drawn Animation
00:05
HD
Declining oil prices with falling barrels and downward arrow animated video on transparent background showing market downturn, price drop, reduced demand, and economic decline concept
00:05
HD
Reducing sugar intake improves health, represented by text and arrows.
00:08
HD
Downside financial exposure highlighted on a modern screen for professional risk management and economic tracking presentations
00:15
HD
Battery Discharge and Power Consumption video motion - ideal for tech articles, energy efficiency blogs, power management infographics, and app UI/UX design
00:10
HD
satisfaction rating level indicator scale. Low normal & high meter infographic animation. Showing high satisfaction rating level color gauge indicator. on a black background 4k animation video
00:10
HD
Kenya Oil Price Falling with Oil Barrels Downward Green Arrow and 3D Financial Data Visualization Graphs for Economy and Business Concept
00:11
HD
Business concept risk mitigation through financial planning, loss prevention, and managing negative impacts on customers or market conditions
00:17
HD
Bar graph crash animation showing market decline and failure
00:10
HD
Hands Coming Together Over House Icon with Percentage Symbol Graphically Representing Real Estate Market Decline with Red Arrows Depicting Falling Trends Sigmoid
00:15
HD
Calcium level indicator scale. Low normal & high meter infographic animation on black background. Showing high calcium level color gauge indicator for nutrition and bone health monitoring
00:10
HD
Chile Crude Oil Price Decline with Oil Barrels and Downward Green Arrow
00:11
HD
Hand-Drawn Up Down Arrow Direction 2D Animation on Green Screen
00:06
HD
Business chart illustrating improving quality and cost reduction with blue upward and red downward arrows. Visualize performance optimization for business strategy, management and resource efficiency
00:07
HD
market sentiment level indicator scale. Low normal high meter infographic animation on black background. Showing high pressure level color gauge indicator.4k animation video
00:10
HD
Financial growth animation finance money investment
00:08
HD
3d animation financial loss or economic decline with stacked coins decreasing in size, a red downward arrow, and a warning symbol representing caution or risk with alpha channel
00:10
HD
Urgency level indicator scale. Low normal & high meter infographic animation on black background. Showing high urgency level color gauge indicator for task priority time management and workflow.
00:10
HD
Business growth concept in graph chart showing marketing sales profit increasing to future target . growing business concept. animation
00:10
HD
Stock market candles with falling prices of securities. Loss of assets in equities, showing a decreasing trend, poor performance, and financial losses due to economic crisis.
00:17
HD
Business loss falling down with dollar icon, black background. financial graph chart. Financial crisis and dollar loss diagram with downfall arrow. motion graphic video..
00:10
HD
fat level indicator scale. Low normal & high meter infographic animation. Showing high fat level color gauge indicator. on a black background 4k animation video
00:10
HD
Arrow graphics showing progression and expansion across a blue background with black dividers
00:05
HD
Quality improvement and cost reduction concept with blue quality line rising and red cost line falling. Concept of business strategy, management, efficiency and performance optimization
00:12
HD
Neon CO2 Reduction Animation on Dark Background, Glowing Carbon Dioxide Cloud with Downward Arrows, Environmental Sustainability Concept, Digital Eco-Friendly Motion Graphic for Climate Awareness
00:07
HD
water pollution level indicator scale. Low normal & high meter infographic animation. Showing high water pollution level color gauge indicator. on a white background 4k animation video
00:10
HD
Greece Oil Price Falling with Oil Barrels Downward Green Arrow and 3D Financial Data Visualization Graphs for Economy and Business Concept
00:11
HD
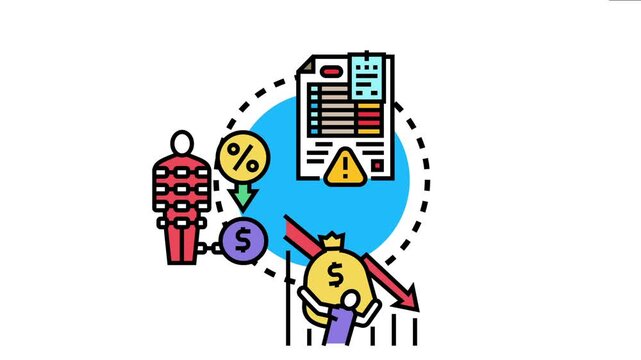
Debt acknowledgements concept individuals facing financial burden with loans, interest rates, and declining economic activity, representing insolvency and crisis issues
00:17
HD
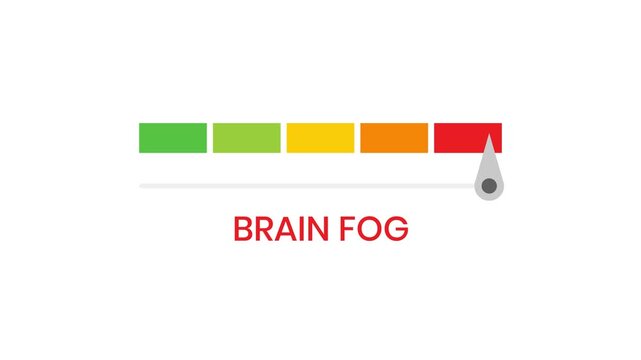
Brain foganimation gauge meter transitioning from green low to red high, visualizing performance and health measurement indicators.
00:10
HD
Hand Holding House Icon With Percentage Sign and Abstract Graphs Representing Real Estate Market Trends and Financial Gain Sigmoid
00:10
HD
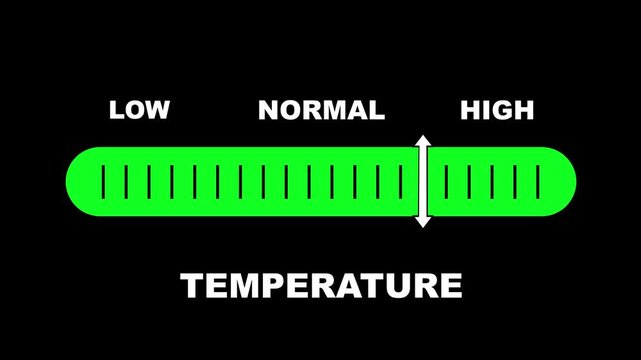
Temperature level indicator scale. Low Normal High meter infographic animation on black background. Animation showing high temperature level color gauge indicator for weather and climate monitoring.
00:10
HD
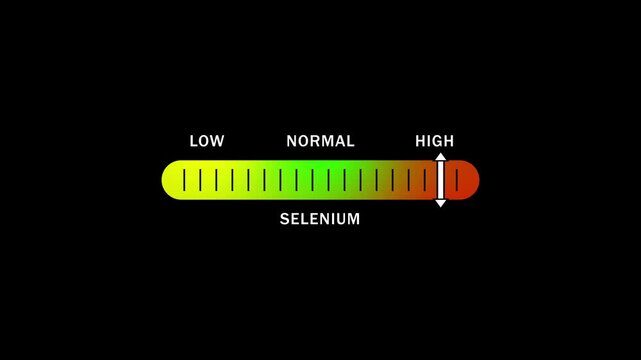
Selenium level indicator scale. Low normal & high meter infographic animation on black background.
00:06
HD
Reuse level indicator scale. Low Normal High meter infographic animation on black background. Showing high reuse level color gauge indicator.
00:10
HD
Transparent Alpha Channel Falling US Dollar Currency Icon with Red Downward Arrow for Financial Crisis
00:12
HD
Abstract increase icon on black background. Dollar rate up looped icon. Reduce costs sign and symbol. motion video 4k quality..
00:06
HD
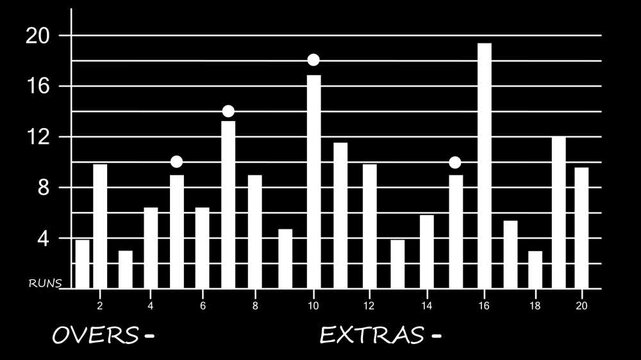
Animated Cricket Match Runs Per Over Bar Chart Showing Scoring Performance
00:10
HD
No Return text symbol animation on black background. not allowed and ban animation concept. 4k video
00:11
HD
Animated dollar coins decreasing from a stack
00:10
HD
Animated arrow hitting a yellow discount banner with copy space
00:06
HD
Bar chart graph data animation displays falling financial sales lines. Chart graph monthly performance grid features a downward trend arrow. Data animation layout loops perfectly for video.
00:12
HD
Abstract decrease icon on transparent background, white background, green screen. Dollar rate up to down looped icon. Reduce costs sign and symbol.
00:09
HD
pressure level indicator scale. Low normal & high meter infographic animation. Showing high pressure level color gauge indicator. on a black background 4k animation video
00:10
HD
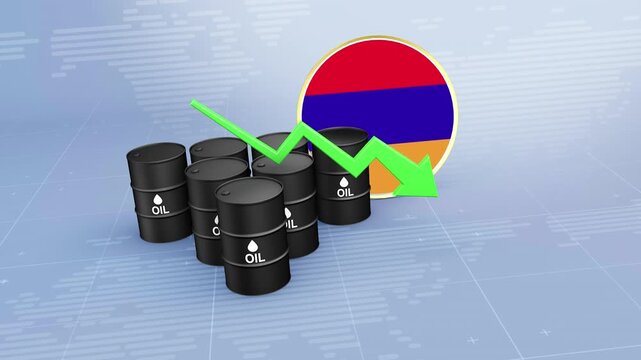
Armenia Crude Oil Price Decline with Oil Barrels and Downward Green Arrow
00:11
HD
Bar chart animation showing a downward financial trend over time
00:10
HD
Cyan blue segmented downward arrow animation on a black background, ideal for download, navigation, scrolling, decrease, interface, and direction concepts.
00:10
HD
probability level indicator scale. Low normal & high meter infographic animation. Showing high probability level color gauge indicator. on a white background 4k animation video
00:10
HD
Slovakia Oil Price Falling with Oil Barrels Downward Green Arrow and 3D Financial Data Visualization Graphs for Economy and Business Concept
00:11
HD
Decreasing financial costs for currency exchange and banking services, opportunities for saving money and improving financial efficiency
00:17
HD
Creativity Meter Animation: Track and Compare Creativity from Low to High Levels with Dynamic Increasing/Decreasing Gauge for Data Visualization, Performance Insights, and Motion Graphics
00:10
HD
Team Collaboration on Real Estate Analysis with Charts, Graphs, and Illustrations for Market Trends and Financial Strategies in a Modern Office Setting Sigmoid
00:12
HD
Risk level indicator scale. Low normal high stress meter infographic animation on white background. Showing high risk level color gauge indicator for business, finance and safety analysis animation.
00:10
HD
Net zero emissions by 2014 to change climate and net zero greenhouse gas emissions target. Aerial of Net zero environment sustainable development concept. Neon net zero goal achieved.4k video
00:10
HD
Creative Level Text or Word Low and Medium to High Meter Concept Animation on Black Background and Blue Screen
00:58
HD
A single, elegant neon light ribbon gracefully flows and twists through space on a pitch-black background. The ribbon glows intensely with shifting neon hues—electric blue, vibrant magenta, neon
00:10
HD
toxicity level indicator scale. Low normal high meter infographic animation on black background. Showing high pressure level color gauge indicator.4k quality animation video
00:10
HD
Red Downward Arrow with Dollar Sign Symbolizing Economic Recession or Financial Loss
00:15
HD
euro increases icon, euro rate increase stretching arrow up icon. glowing concept currency symbol with up arrow moving animation.
00:10
HD
Lush green forest with glowing co2 symbol and downward arrows, representing carbon absorption and climate
00:08
HD
Professional Business Financial Bar Graph Showing Downward Trend, Economic Loss and Market Decline Animation
00:15
HD
Bar chart animation shows a downward market line on dark. Stock market trading analytics track on this bar chart animation. Negative economic data marks the bar chart.
00:07
HD
Fresh lemon with a green recycle symbol imprinted on box, representing eco-friendly and sustainable food choices in line with the zero waste
00:05
HD
White line Financial growth decrease icon isolated on black background. Increasing revenue. 4K Video motion graphic animation
00:10
HD
Mauritius Oil Prices Decline with Oil Barrels, Gold Coins and Downward Green Arrow, 3D Economic and Financial Market Concept
00:11
HD
glowing neon Percentage growth and decline icon with up and down arrows. financial, business, and statistical analysis. Up and down percentage arrows icon. Perfect for reports and dashboards
00:10
HD
pH Level Alkaline meter concept on black background.
00:10
HD
urgency level indicator scale. Low normal & high meter infographic animation. Showing high urgency level color gauge indicator. on a black background 4k animation video
00:10
HD