A link to set your password has been sent to: To access your purchases in the future you will need a password.
Create without limits — unlimited downloads, plus powerful AI editing
New filters added
Sort by

24,230 results for decline chart in videos

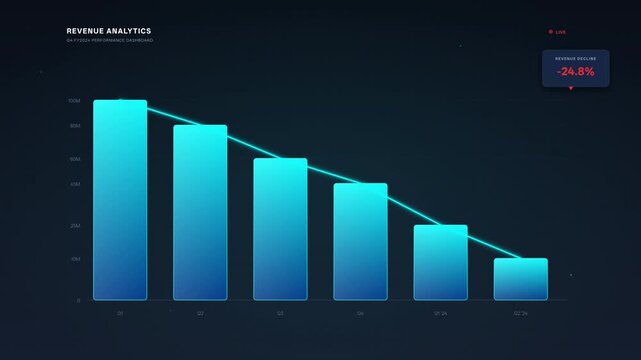
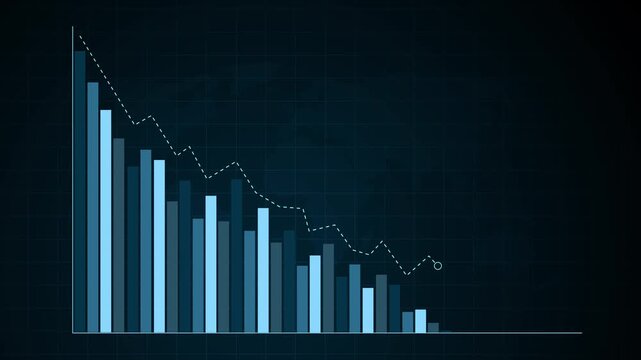
Declining bar chart with downward trend, Blue bar chart with falling line graph decline in business data, finance performance and analytics animation
00:07
HD
Vs cost infographic: rising performance and decreasing expenses business chart animation growth decline
00:10
HD
Stock market decline chart with falling prices cyan
00:15
HD
Business decline bar chart animation with falling arrow line, red bars and falling coins in rain, financial crisis and recession loop, 4K
00:10
HD
Falling red stock chart line graph declining animation seamless loop 4K finance background
00:20
HD
Animated red neon financial chart line showing a sharp economic decline and market crash with glowing light effects against a solid black background, for business presentations, and data analysis
00:10
HD
Animated revenue analytics dashboard showing declining blue bar chart with cyan trend line and -24.8% revenue decline indicator on dark background
00:05
HD
Businessman suffering financial crisis with red stock market crash graph in background motion video for professional corporate investment projects
00:05
HD
Digital stock market dashboard with glowing candlestick charts, financial analytics, and global trading data visualization for investment, fintech, economy, and business technology, 3D animation.
00:25
HD
A red stock market graph with a downward trend displayed on a futuristic grid background with blue lines and dots, conveying a sense of financial decline or crisis.
00:08
HD
Animated black bar chart with downward arrow line on white background, financial business loss decline graph diagram indicator, stock market crash UI UX motion graphic video design element.
00:07
HD
green upward growth arrow and red downward decline arrow chart icon with financial trading trend symbol, market profit sign animation.
00:10
HD
Glowing red neon downward graph with arrow indicating decline, loss, and negative trends on a dark, abstract background, perfect for conveying risk, crisis animation.Right-directional arrow loop.4k
00:10
HD
Digital stock market chart with glowing blue and red bars representing financial growth and decline against a dark blue backdrop.
00:08
HD
Financial stock market dashboard showing bearish decline trends
00:15
HD
Animated candlestick stock market chart showing upward and downward trends over time on a dark blue background.
00:10
HD
Data chart progresses from decline to growth culminating in success silhouette
00:05
HD
financial statistics chart bars arrow down, decreasing graph, drop market, white arrow falling down, downward trend arrow, business analysis and market decline concepts animation, 4k video
00:10
HD
White and red financial growth and decline chart arrows icon for stock market trend, profit and loss indicator, business analytics animation
00:10
HD
V-shaped line turns from red decline into blue growth, gauge fills up. For rebound and economic recovery topics
00:12
HD
Line chart rise and sudden drop suggesting market volatility and financial decline animation
00:06
HD
Four dark descending columns in minimalist graphic style on a blue-black background, conveying business decline and analysis
00:10
HD
Economic decline chart with financial downturn data white
00:15
HD
Animated doodle declining line chart with downward arrow on green screen background, pink magenta draw-on style, chroma key ready for finance, stock market and business videos
00:15
HD
Abstract financial chart with rising and falling bars and line graph animation, Abstract financial market growth decline and data analysis
00:09
HD
Animated chart with red bars representing a decline and green bars showing growth, illustrating a v-shaped recovery in the stock market after a period of economic recession and crisis
00:10
HD
Neon-style bar chart showing descending bars with downward arrow animation
00:10
HD
Home mortgage amortization calculator: animated loan repayment breakdown with principal interest balance charts and monthly payment schedule visualization
00:12
HD
Financial bar chart showing economic decline with downward arrow animation on grid background business
00:10
HD
Neon Business chart icon isolated . business chart growth concept black background. Graph, data and economic growth for population decline
00:10
HD
Candlestick stock market chart animation showing financial data fluctuations and trading activity with green and red bars
00:08
HD
Red stock market index chart showing severe financial crash and declining prices
00:12
HD
Dynamic white financial growth and market decline line graph animation set on a solid chroma key green screen background, for easy compositing, in business presentations, and data analysis projects
00:05
HD
Stressed businessman silhouette facing financial market crash with red downward trend charts in this cinematic motion background video clip
00:05
HD
Business growth financial bar chart and line graph world map background, showing business growth data analysis animation
00:10
HD
Animated bar chart growth and decline concept: dynamic financial data visualization for business presentations and market analysis animation 4k
00:10
HD
Financial market risk index chart showing downward trend and economic decline with real-time data analytics
00:10
HD
Neon business graph chart icon animation on black background. Neon business growth concept. Success concept. Profit growing icon animation. Graph, data and economic growth for population decline
00:10
HD
Isometric financial charts showing growth and decline on black
00:10
HD
Neon red financial market downtrend graph line animation showing economic decline and stock market crash concept with glowing digital chart arrow moving downwards against a dark black background
00:10
HD
Declining bar chart with downward trend, Blue bar chart with falling line graph decline in business data, finance performance and analytics animation
00:08
HD
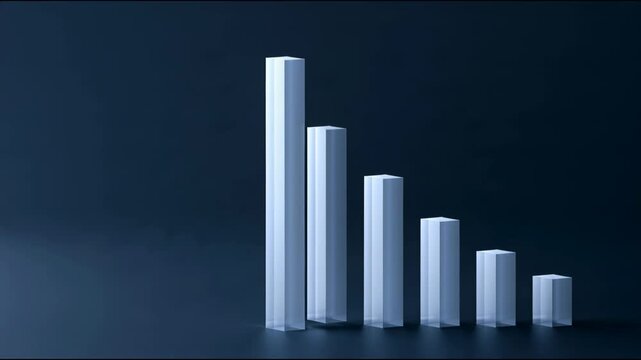
Luminous descending bar chart in minimalist style on a dark blue background, symbolizing business decline and performance
00:10
HD
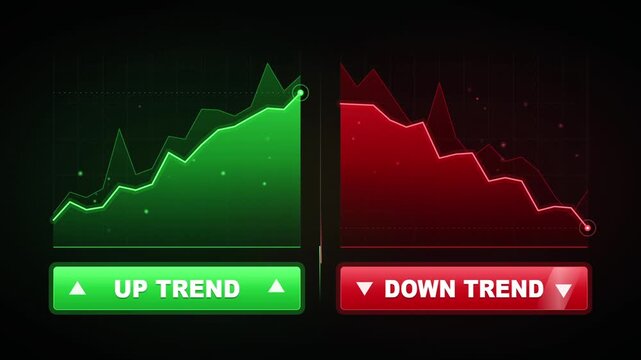
Digital financial growth and decline charts with up trend and down trend text buttons
00:16
HD
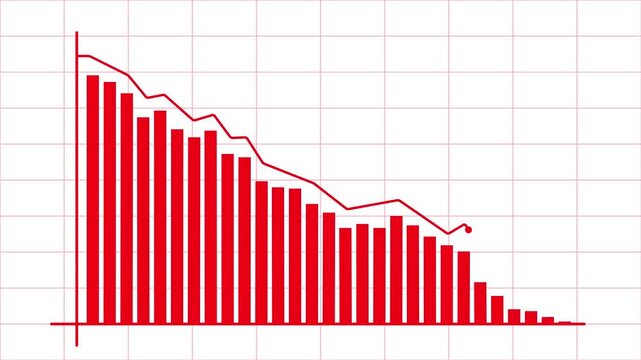
Red financial decline line graph and bar chart element for stock market crash, economic loss, downward business trend, deficit analysis, recession indicator
00:10
HD
Dark abstract financial chart with glowing bar and line graph elements animation
00:09
HD
Business graph animation showing financial market decline with blue glowing arrow on grid background.
00:12
HD
Neon glowing bar chart with rising line overlay stylized retro futuristic data visualization animation
00:13
HD
Bar chart animation displays financial market decline with negative data. Corporate business losses track on this active bar chart. Economic downturn marks the chart.
00:08
HD
Animated financial bar chart growth and decline concept, green business data visualization on black background
00:10
HD
Financial Loss Graph Animation Showing A Dramatic Stock Market Crash With Falling Red Chart Line, Negative Dollar Values, Downward Arrows. Concept Of Economic Recession, Volatility, Investment Failure
00:19
HD
Digital bar chart animation showing declining business performance and negative financial growth trend
00:10
HD
Split screen financial comparison animation with green growth and red decline bar charts
00:15
HD
Neon Business chart icon isolated . business chart growth concept black background. Graph, data and economic growth for population decline
00:10
HD
Red jagged line chart crash decline animation with dashed baseline on transparent background
00:05
HD
Animated blue financial bar chart showing market growth and decline
00:12
HD
Bar chart animation displays declining columns with a falling trend arrow. Downturn loss data routes across bar chart. Evaluation consoles monitor active chart.
00:06
HD
Red financial line graph showing market downtrend and economic decline on dark background, chart
00:10
HD
Bar chart glows with red neon light to illustrate market decline and financial instability on a dark digital grid for corporate reporting and risk management presentations regarding economic loss.
00:10
HD
Digital line graph tracks upward moving corporate revenue. Interactive line graph demonstrates successful financial forecasting. Economic growth concept with corporate line graph.
00:10
HD
Neon Red Falling Line Graph with Downward Arrows and Declining Trend Animation
00:10
HD
Financial market chart with candlesticks and line graph, Abstract financial chart with candlestick bars and line graphs market analysis growth and data trends animation
00:10
HD
Dynamic red and green financial growth chart with intersecting lines showing growth and decline on black background, 4k animation.
00:07
HD
Animated declining line graph arrow showing financial loss or market downturn chart decline
00:10
HD
Financial decline chart animation displays falling business market trends on dark. Revenue downturn analytics track on chart. Consoles monitor financial decline chart.
00:12
HD
Neon green arrow pointing down on black grid background, concept of stock market crash and economic decline.
00:05
HD
Businessman standing before a glowing digital stock market graph showing financial decline and recovery in this intense animation video clip
00:05
HD
blue up business arrow graph and red down business loss financial decline economic fall recession black background animation.
00:12
HD
Neon glowing bar chart with rising line overlay stylized retro futuristic data visualization animation
00:13
HD
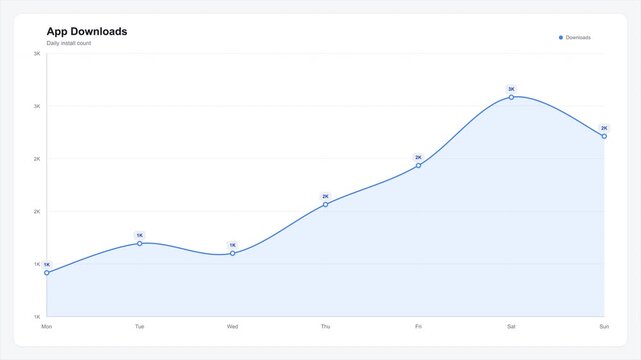
App download growth chart showing upward trend with peak and slight decline over time
00:06
HD
Neon sign Financial business Loss down graph chart icon animated. Graph shows downward arrow, symbolizing decline, loss, market drop, risk, or negative growth.4k animation motion graphics video.
00:10
HD
A glowing red line graph showing a downward trend on a dark grid background
00:07
HD
Gradient blue bar chart shows a downward trend. Rendered in a cool, minimalist style
00:10
HD
Business growth bar chart showing monthly decline on dark background graph data finance analysis statistics graph data finance analysis statistics
00:07
HD
Animated 3D bar chart showing financial market decline and economic downturn trends financial data economic decline
00:06
HD
Abstract financial chart with glowing red and orange lines on a dark background, depicting market fluctuations and data analysis.
00:20
HD
Fluctuating bar chart tracks volatile marketplace economic trading values. Technical bar chart visualizes corporate asset revenue risk assessments. Financial forecasting with digital bar chart.
00:08
HD
Animated bar chart growth and decline concept: business data visualization and financial market trends animation 4k
00:10
HD
Glowing neon arrows chart upward and downward trends against a dark brick wall, symbolizing financial growth and market fluctuations. ..Created with Generative AI, not depicting real subjects.
00:10
HD
Revenue decline chart animation drops on dark grids. Corporate revenue decline chart animation tracks market recession. Modern revenue decline chart animation details losses.
00:10
HD
Futuristic neon business bar chart showing growth and decline over grid background for data analysis concept.
00:10
HD
Declining bar chart with downward trend, Blue bar chart with falling line graph decline in business data, finance performance and analytics animation
00:07
HD
Financial market chart showing a sharp price decline with red candlesticks, technical analysis tools, market volatility, trading losses, bearish trend, and investment risk.
00:10
HD
Financial growth and decline dashboard control panel animation, mouse cursor presses up down next arrow buttons, piston bar chart and gauge needle react, 2D loop
00:10
HD
Digital bar chart with a trend line showing growth and decline on a dark grid background
00:10
HD
green upward growth arrow and red downward decline arrow chart icon with financial trading trend symbol, market profit sign animation.
00:10
HD
Clean 4K vector animation displaying a minimalist infographic bar chart with a dramatic steep downward trend line visually communicating financial loss economic decline or negative data metrics
00:10
HD
Market downturn chart with declining trading data multicolor
00:15
HD
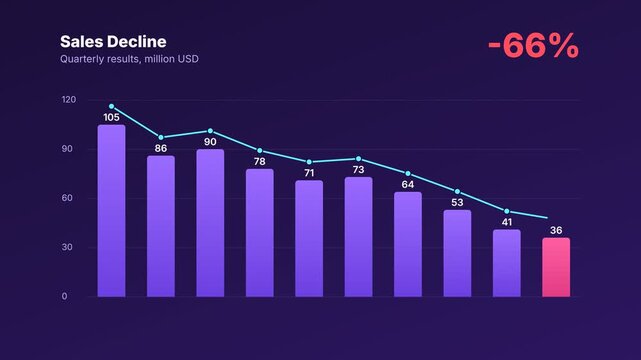
Animated bar chart showing decline and falling trend, purple business infographic 4K
00:10
HD
Stylized financial chart with illuminated line graph and reflective bar chart, futuristic minimal aesthetic animation
00:08
HD
Animated bar chart growth and decline concept: financial data visualization for business analytics and market trends
00:10
HD
Digital animation showing a declining candlestick chart with a red arrow going down, representing a financial crisis, economic recession, bearish market, and investment losses
00:10
HD
Stock Market Chart Flow. Moving banner with statistical data on growth and decline in trading and investing. Alpha Channel with financial chart for money management. Realistic graphic animated footage
00:10
HD
Monthly business growth chart with pink bars showing declining trend bar graph decline data finance bar graph decline data finance
00:07
HD
Red arrow pointing downward on digital financial graph. Declining trend line market data visualization for investment analysis.
00:08
HD
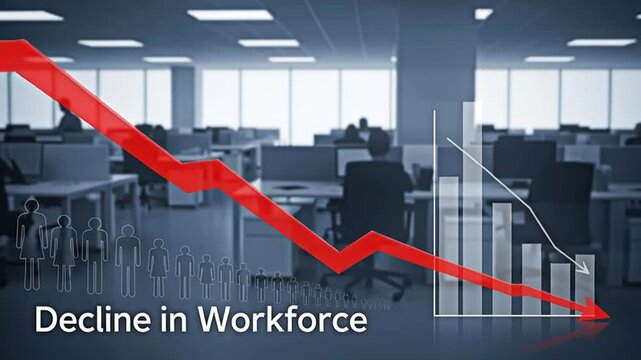
The decline in the workforce chart for the concept of economics and unemployment.
00:06
HD
Red graph going down into recession. Stock Market Crash Background Animation. Downtrend. Financial failure, economic crisis concept. Stock chart fall. Downward trend, business crash and collapse.
00:10
HD
Financial loss concept with red decreasing graph line representing market crash, economic crisis and business decline
00:10
HD
Red Arrow Heading Down 3D 4347
00:18
HD
arrow rising transparent abstract business graph arrow rising transparent channel, business growth chart icon animation background 4k. fall up arrow ;Business decline trend animation.
00:10
HD
Declining financial chart. Blue and White. 2 videos in 1 file. Economy background. More options in my portfolio.


00:30
HD