A link to set your password has been sent to: To access your purchases in the future you will need a password.
Create without limits — unlimited downloads, plus powerful AI editing
New filters added
Sort by

29,857 results for decision chart in videos

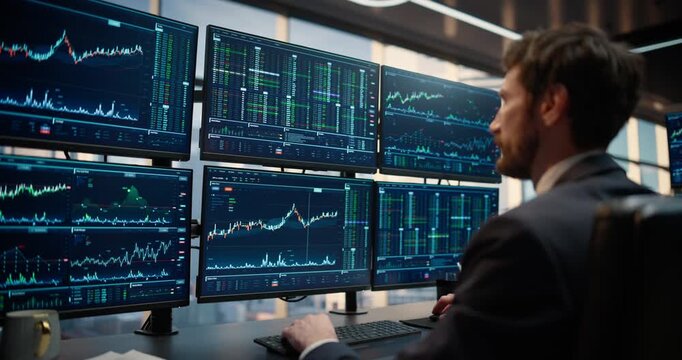
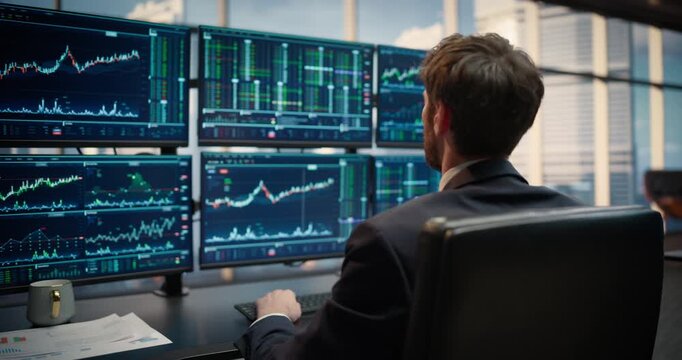
Thoughtful Caucasian Male CEO Standing at a High-rise Window, Planning Investment Decisions as Surrounding Monitors Show Live Stock Market Data and Charts. Cinematic Shot
00:21
HD
Abstract digital illustration of an AI decision flow showing glowing data lines converging into a central HUD target reticle on a dark blue background.
00:10
HD
Businessman hand pointing pen at target goal hexagon icon with growth chart and checklist hologram, representing business strategy planning, performance tracking and management technology concept
00:08
HD
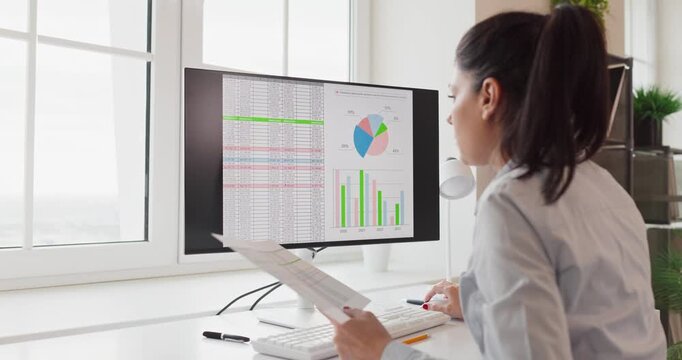
Analyst woman reviews data charts on computer monitor. She reviews an office dashboard and spreadsheet, interprets metrics, and prepares a report for planning. Clear data driven decision concept.
00:06
HD
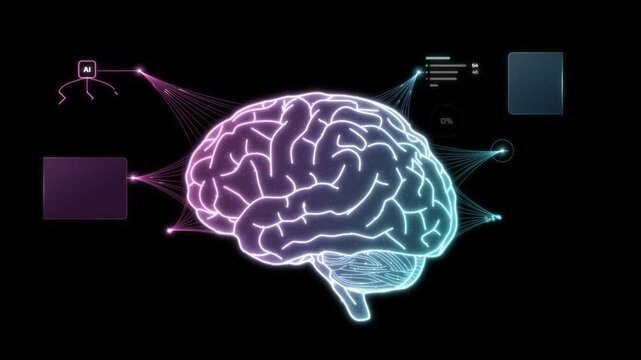
Glowing human brain outline draws from a spark and links to AI decision tree and analytics chart panels
00:14
HD
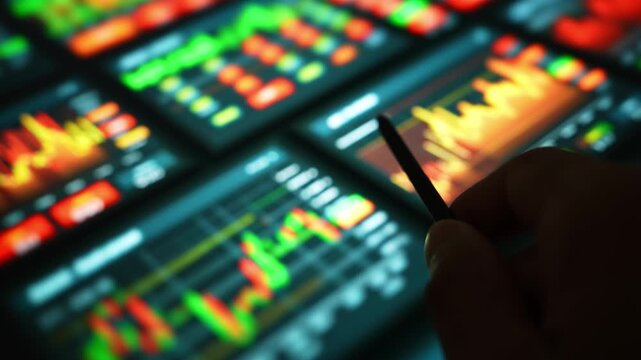
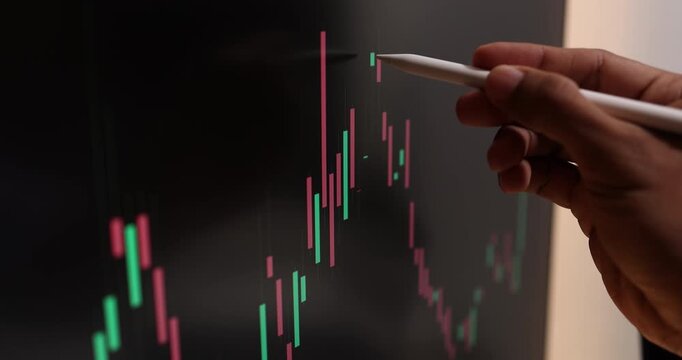
Investor holding a stylus pen to analyze colorful stock price charts on a digital screen, representing financial technology, market trading, investment strategy, and data-driven decision making. 4k.
00:09
HD
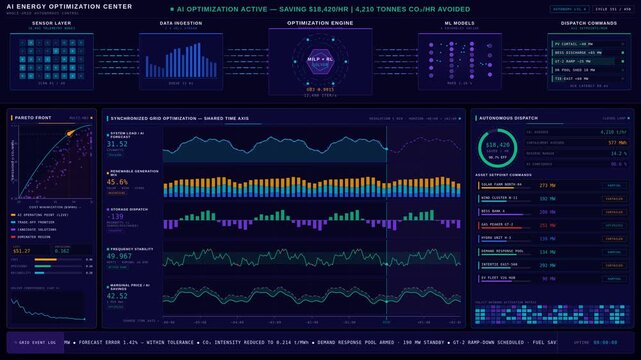
Futuristic AI energy optimization control center with glowing data analytics and autonomous decision dashboard in 4K. professional stock footage for technology, business, and editorial use.
00:15
HD
Business team takes notes, reviews documents, and analyzes financial data meeting in office.
00:15
HD
Scheme hierarchy management of corporate. Digital technology of business process and workflow automation with flowchart and processing management.
00:13
HD
AI explainable interface showing feature attribution waterfall chart with SHAP summary in clean UI layout. professional stock footage for technology, business, and editorial use.
00:15
HD
Business analytics dashboard animation displaying colorful bar graphs, percentage indicators, and performance metrics for corporate reporting and data-driven decision making.
00:15
HD
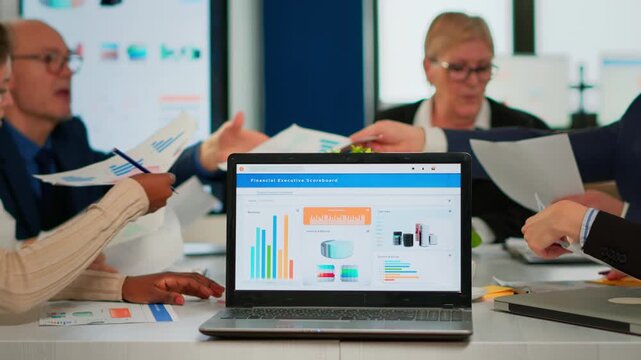
Team collaboration in a corporate office environment with laptop and reports on the table. Professionals reviewing KPI, income data and charts to support planning and decision making.
00:19
HD
Over shoulder view of African American man watching stock charts on monitor. Adult male wearing glasses. Analyzing market data on screen. Sitting indoors at night office. Focused trading session.
00:13
HD
Dynamic Analytics Dashboard Visualizing Real-Time Business Performance and Data Insights.
00:15
HD
Top down view of business people listen businessman present idea while making decision. Group of diverse team making a decision to invest start up project while hold tablet display graph. Directorate.
00:16
HD
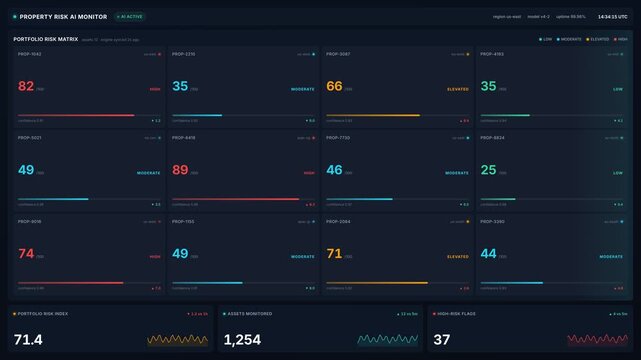
Property risk ai monitor dashboard with portfolio risk matrix with asset scores, for financial analysis, data monitoring, 4k digital decision making technology
00:20
HD
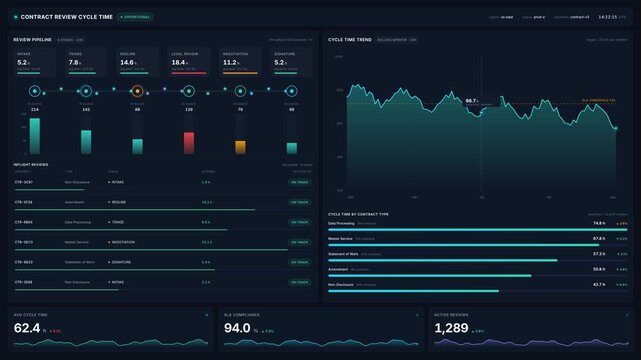
Contract review cycle time analytics dashboard with animated kpi cards, for legal workflow efficiency, performance tracking, data driven decision making in business
00:20
HD
Woman Studies Market Charts On Laptop While Sharing Insights
00:23
HD
financial statistics chart bars arrow down, decreasing graph, drop market, white arrow falling down, downward trend arrow, business analysis and market decline concepts animation, 4k video
00:10
HD
Doctors consulting together and planning treatment in a modern medical office, reviewing healthcare data, charts, and reports on a laptop for clinical decision making and patient care.
00:13
HD
Business cost reduction and market chart icon , .arrow showing rising quality and decreasing cost. Visualize business performance optimization, 4 k

00:08
HD
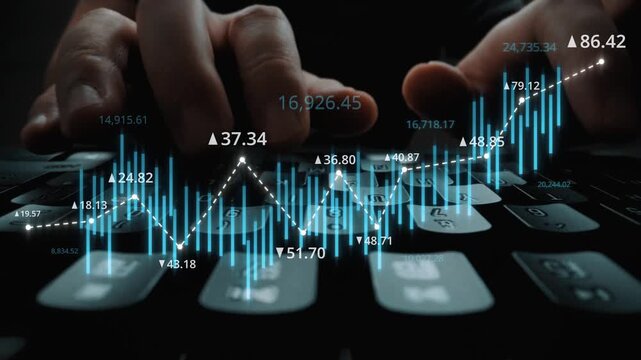
Dynamic financial market motion with fluctuating stock chart graphs and real-time data analysis for investment decision making.
00:10
HD
Businessman's hand drawing upward arrow on growing financial chart with smartphone during bright studio lighting
00:05
HD
Violet region revenue bars crossing a target line, with bar chart and glowing on a dark purple background, assembling in smooth motion, for corporate explainer videos and slides
00:12
HD
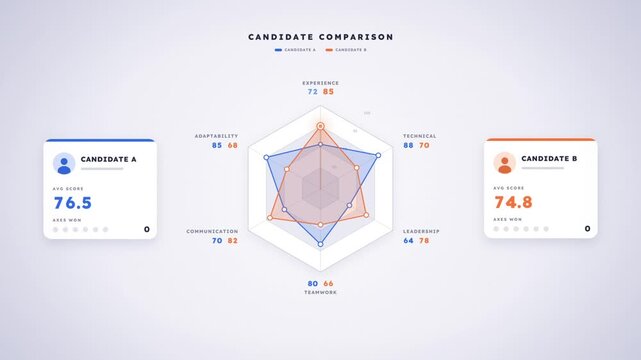
Candidate comparison radar chart scoring two applicants across six skills until a top candidate is chosen
00:15
HD
Diverse colleagues place hands above documents during strategy meeting. Multiethnic business team reviews charts confirming decision near laptop with focus
00:13
HD
Semantic search optimization diagram shows claude model options chart interface user choices menu. Suitable for web design, seo presentations, and techrelated content.
00:10
HD
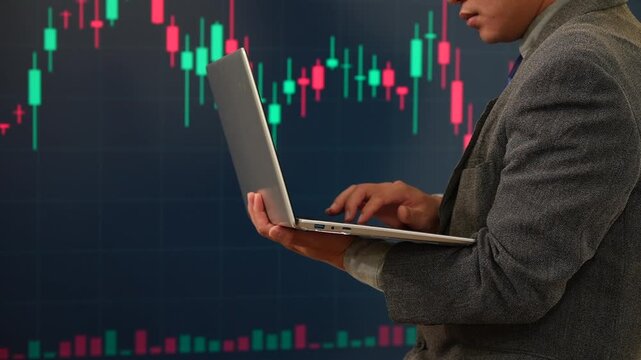
Businessman using a laptop in front of a glowing stock market chart with red and green candlesticks, showing online trading and financial analysis.
00:12
HD
A candlestick chart used in finance to analyze market trends. The chart displays price movements in a visual format, focusing on fluctuations.
00:10
HD
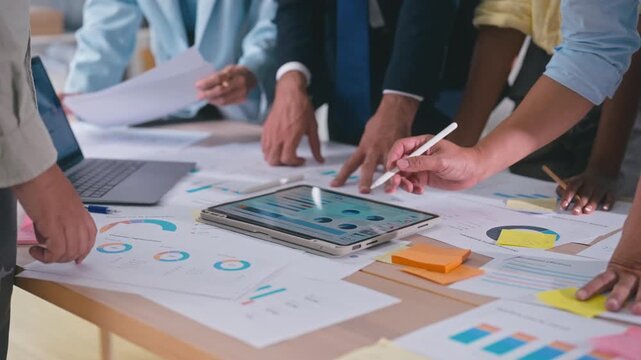
Business team discussing financial charts and data on a digital tablet during a meeting in a modern office corporate strategy, and teamwork.
00:19
HD
Business people analyzing business growth chart and discussing company strategy
00:24
HD
Dashboard, finance and laptop with financial charts on computer as business team reviews reports at conference table, for data analysis, planning, strategy, performance and decision making.
00:16
HD
Animated red bar chart with growing business data analysis algorithms dashboard display black hi-tech technology graph background
00:20
HD
Slow Dolly-in Through a Stock Exchange Asset Management Firm, Where a Stockbroker Ceo Studies Live Charts, Weighing Banking Decisions, Strategy and Capital Growth for Corporate Career Success
00:13
HD
Future business flowchart process diagram with decision nodes Business process and workflow automation with flowchart concept...
00:11
HD
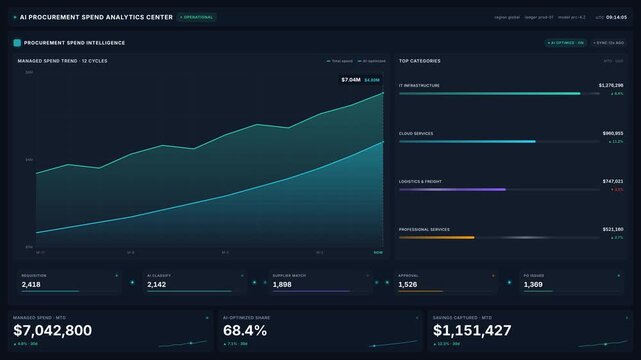
Ai procurement spend analytics dashboard with real-time savings, budget trends category charts in 4k, for business intelligence, cost control decision making
00:20
HD
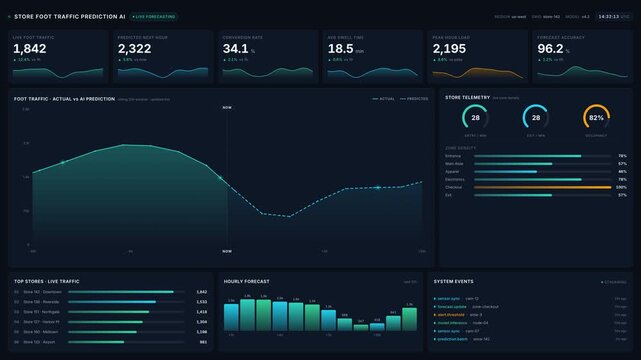
Dark themed store foot traffic prediction ai dashboard with live forecasting charts telemetry data, for retail analytics intelligent decision making
00:20
HD
Self drawing line animation road Signpost continuous one single line drawn concept video, road direction sign arrows isolated on white background. Full-length one-line animation.
00:05
HD
Stock market analysis with candlestick chart and price movement trend line, highlighting global financial trends, stock trading, and investment strategy insights Marrow
00:10
HD
Focused businesswoman analyzing financial data charts on computer screen in modern office. Professional workplace environment, analytics and teamwork for strategic decision making.
00:09
HD
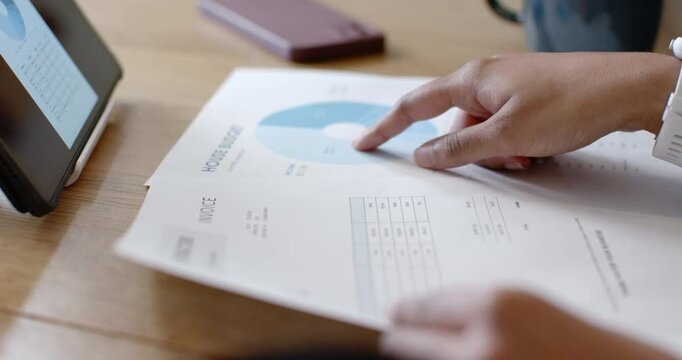
Right hand entering and tapping blue chart on desk, two fingers tracing chart and comparing numbers
00:22
HD
Bar chart under limit line for AI regulation and ethics full scene
00:15
HD
Blue bar chart under limit line for AI regulation and ethics
00:15
HD
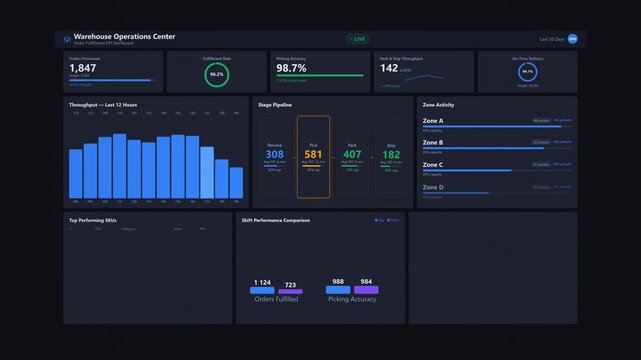
Warehouse order fulfillment dashboard: animated inventory operations tracker with pick rate metrics, shipment status breakdown and daily throughput performance visualization
00:10
HD
Glowing process flowchart draws itself as a light pulse travels through decision steps to the end point
00:15
HD
Multicultural business team meets around table with laptop and chart screen. Presenter listens to colleagues discussing project data during strategy session
00:22
HD
Explain, finance and laptop with business women in boardroom for review of data charts. Computer, conversation and investment decision with employee people in financial workplace for risk management
00:11
HD
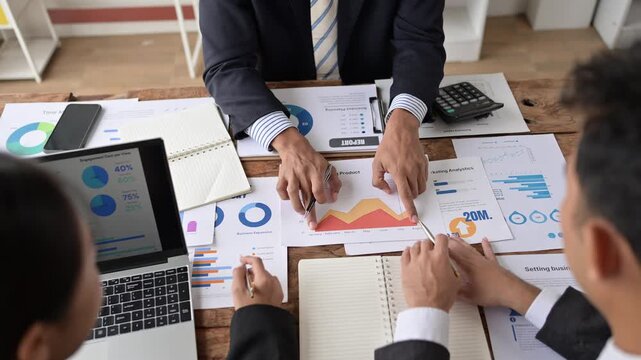
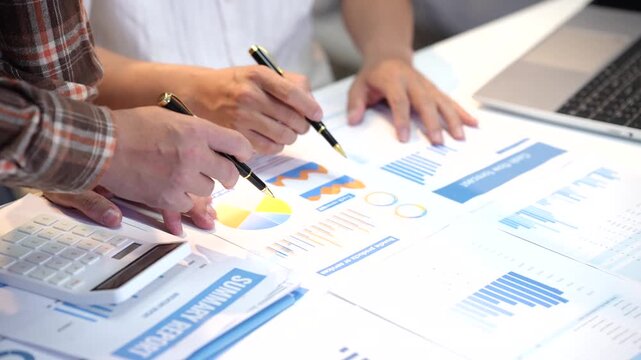
Close-up of business colleagues reviewing colorful financial charts and reports on a desk with calculator, pen, and laptop during a planning meeting.
00:11
HD
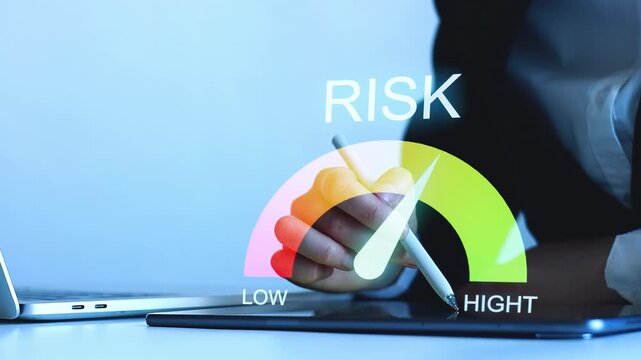
Understanding risk levels in finance using a digital display during a business meeting in an office.
00:10
HD
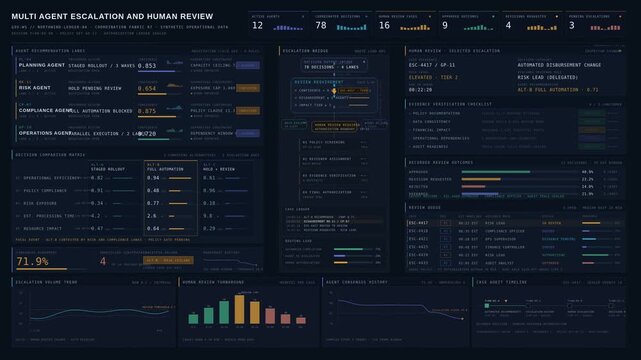
4K multi-agent coordination dashboard showing task escalation, human review outcomes, and decision accountability in a dark enterprise interface. for commercial creative technology and business use.
00:15
HD
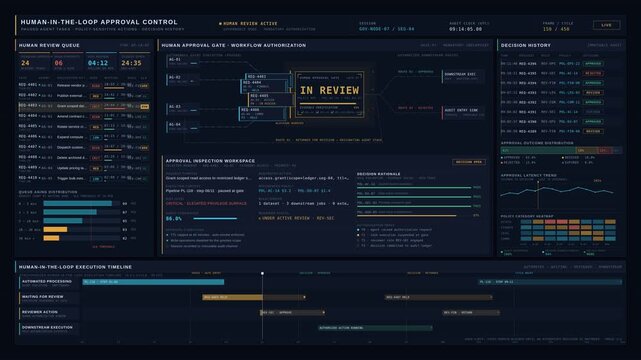
Premium enterprise human-in-the-loop AI governance dashboard visualizing agent approval workflows, decision history, and policy tracking in dark mode for commercial creative technology and business.
00:15
HD
Analytics, tablet and teamwork as colleagues discuss bar charts on a touchscreen and point with a pen. Business reporting, data review, digital presentation and collaborative decision making.
00:13
HD
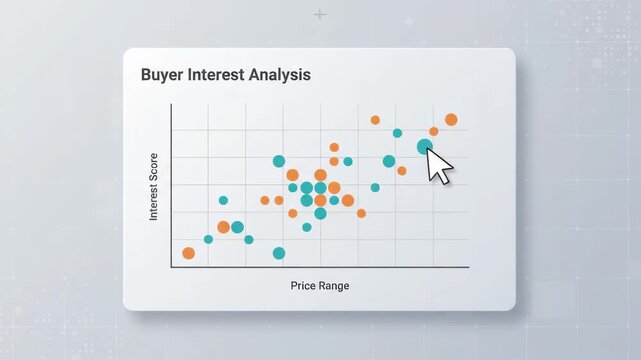
bubble chart displays buyer interest analysis against price range on digital interface screen set against soft abstract grid background representing data analytics and business intelligence
00:06
HD
Portrait of Confident Male Trader turning and Looking at Camera while working at an Asset Management Firm. Investment Strategy, Live Stock Exchange Screens, Corporate Career Success and Banking
00:13
HD
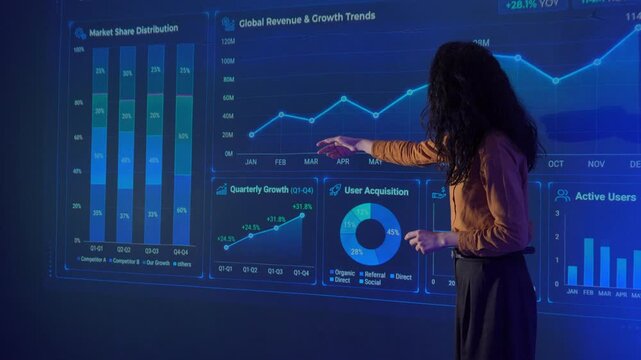
Businesswomen analyzing global market trends and revenue data during a corporate presentation, teamwork, data analytics, financial strategy, and technology-driven decision making in a modern office.
00:17
HD
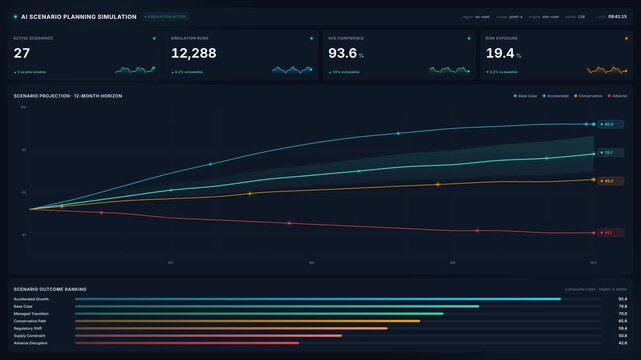
Ai scenario planning simulation dashboard with risk exposure metrics projection charts, for strategic decision making, predictive analytics, forecasting in 4k
00:20
HD
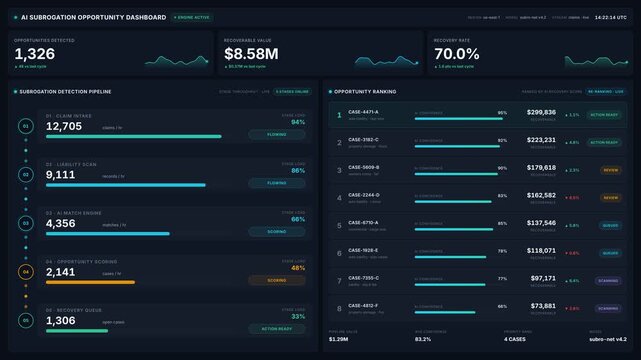
Ai subrogation opportunity dashboard with claims intake, liability scan, recoverable value analytics, for insurance recovery, automation, decision making
00:20
HD
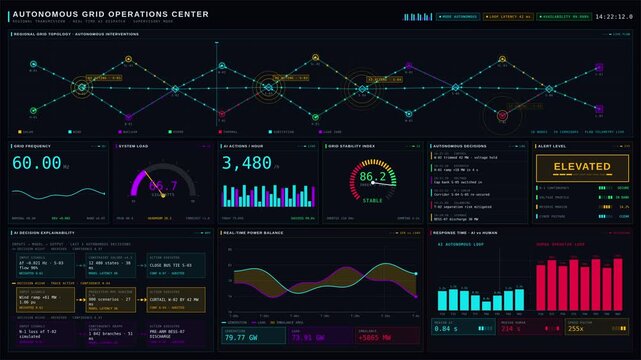
An immersive 4K control room dashboard simulating an autonomous grid operations center with animated energy flows and AI decision indicators in vibrant colors.
00:15
HD
Top view of caucasian businessman present marketing plan by show financial graph to diverse investor to make decision for investment. Diverse business people discussion about smart plan. Convocation.
00:22
HD
Inside modern office, elderly ladies viewing charts and diagrams on glass wall. Teamwork and brainstorm in boardroom, senior women making decisions and solving financial problem, business investments
00:12
HD
African American couple at table holding red phone and pointing at tablet pie chart
00:24
HD
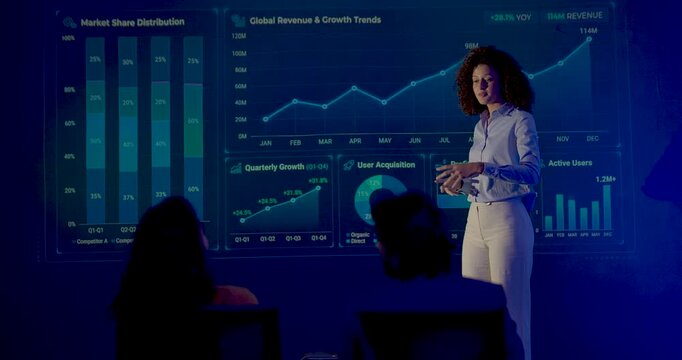
Adult female business presenter speaks beside digital performance dashboard, using expressive gestures while explaining growth analytics to seated audience during corporate intelligence presentation.
00:13
HD
Business analysts team in office data analysis. Colleagues present charts on a computer during a meeting. They debate options and plan actions. Clear business team discussion concept image.
00:07
HD
Businessman pointing pen between gold bars and coins to analyze and decide on investment allocation.
00:13
HD
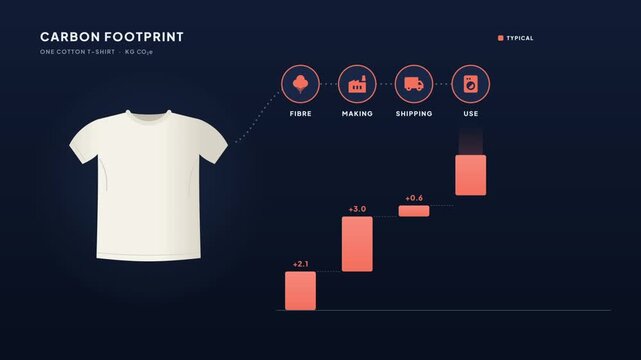
Carbon footprint waterfall chart of a cotton t-shirt drops from 8.4 to 3.2 kg CO2e with lower-impact choices
00:15
HD
kpi business analytics and data management concept. businessman using dashboard interface, corporate data metrics tracking, strategic planning, track performance metrics and optimize strategy decision
00:11
HD
Professional trader analyzes live financial charts across desktop, laptop, tablet, and smartphone in a modern office, monitoring market trends, tracking investments, and making trading decisions.
00:16
HD
Scheme hierarchy management of corporate. Organizational chart company hierarchy,roles,team structure,showing connections between managers, employees,and departments for clear communication workflow.
00:13
HD
A person uses a laptop and smartphone to study bond market data. The screen shows graphs and information about bond trends. This happens indoors in a workspace setting.
00:10
HD
Cinematic enterprise AI governance dashboard displaying decision logs, task ownership matrices, and workflow evidence in a dark, professional interface with dynamic data updates and compliance.
00:15
HD
Cinematic autonomous AI workflow dashboard visualizing decision stages, processing queues, and policy routing in dark enterprise technology style for commercial creative technology and business use.
00:15
HD
Charts, analytics and research in close-up of colleagues examining a printed data report with line graphs and pie charts at an office table, useful for business analysis, planning and decision making.
00:14
HD
Business data dashboard interface with charts and indicators chart graph analysis report statistics chart graph analysis report statistics
00:08
HD
Camera Glides Around a Stock Exchange Asset Management Firm as a Successful Stockbroker Ceo Studies Market Screens, Thinking Strategy, Banking Decisions and Capital Growth for Corporate Career Success
00:13
HD
Beige flowchart diagram drawing step by step, business infographic transparent loop animation
00:08
HD
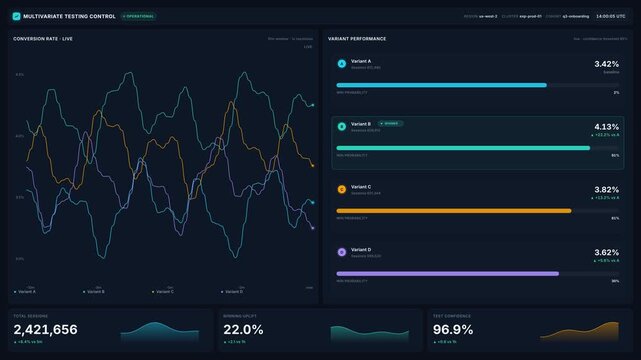
Multivariate testing dashboard with live conversion rate graphs variant performance metrics, for informed decision making, optimization, marketing analytics
00:20
HD
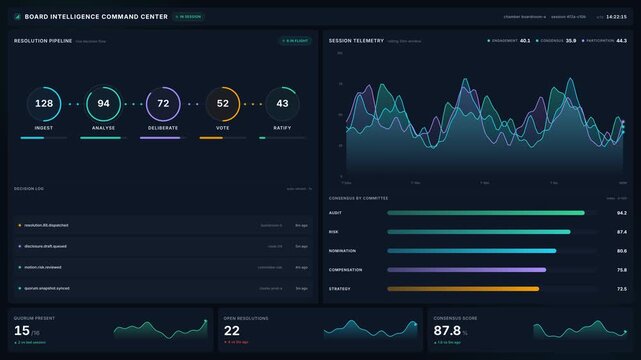
Corporate board intelligence command center dashboard with live decision pipeline session telemetry, for data analytics, governance, 4k business strategy
00:20
HD
Change management in organization and business concept with consultant presenting icons of strategy, plan, implementation, communication, team, success. 4k animation video
00:10
HD
Top view of businesswoman sitting at seat while business team plan marketing strategy. Group of smart people looking at financial statistic document while making decision for investment. Directorate.
00:21
HD
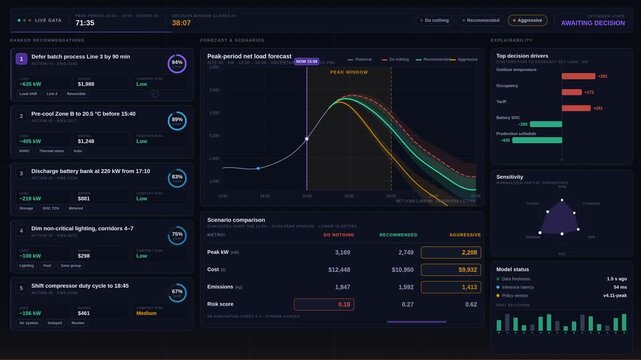
AI decision support dashboard recommending optimal energy usage during peak periods with forecast fan chart, scenario comparison, and explainability panel on dark background.
00:15
HD
arrow down business graph icon animation. business chart concept. A neon down business graph icon displays a glowing, downward-sloping line or bar chart, symbolizing decline, loci
00:08
HD
Business professional using AI tools for customer targeting, data analytics in digital marketing. Audience insight, performance metrics, data visualization dashboard for strategic marketing decision
00:12
HD
Couple budget planning on finance dashboard online. They review savings and monthly expenses on a computer at home using charts analytics for smarter choices. Clear concept of home finance teamwork
00:08
HD
Woman typing, man noting at table, chart overlay shifting upward spurring lean and finance decision
00:12
HD
Gold AI finance earnings waterfall chart holographic centered view
00:12
HD
Cost management concept with businessman holding performance gauge, showing financial planning, data analysis, and strategy to reduce expenses and improve company efficiency, 4k video clip
00:12
HD
Two colleagues reviewing chart reports with manager at office desk
00:25
HD
Futuristic Big Data Funnel with Binary Number Processing Visualisation Animation
00:15
HD
Bars in various heights represent data points on a chart while a line moves upward to show increasing trends. This represents analysis in business or finance.
00:10
HD
Business colleagues review data on a tablet, discussing performance metrics, market trends, and strategic insights for informed decision making
00:19
HD
Business team analyzing financial charts and graphs during a meeting, pointing at statistics and discussing data, collaborating on business strategies and making decisions
00:26
HD
Analytics, presentation and strategy with businessman pointing at dashboard charts while colleagues review reports in boardroom for planning, teamwork, discussion and financial decision making.
00:15
HD
Analyzing Data Graph And Dashboard
00:25
HD
In the Meeting Room Team of Startup Businesspeople sitting at the Conference Table Have Discussions, Solve Problems, Use Tablet, Laptop, Share Documents with Statistics, Charts.
00:18
HD
Stock market Interface display showing indicator, traders analyze charts and graphs during market analysis candlestick charts and arrow trend lines number counting.
00:19
HD
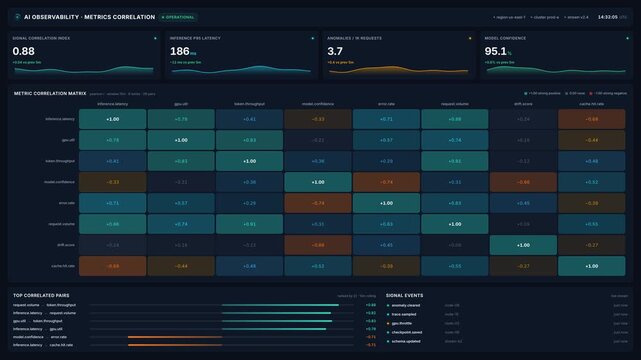
Ai observability dashboard with 4k animated metric correlation matrix heatmap, for real time performance monitoring, system reliability, data driven decision making for
00:20
HD
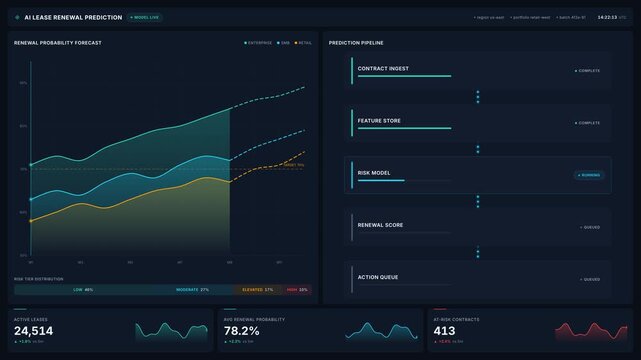
Ai lease renewal prediction dashboard for property analytics charts, renewal probability forecast, risk model workflow, for data driven decision making smart contract management
00:20
HD
Business strategy meeting office digital analysis collaborative environment close-up view financial insights
00:19
HD
AI-generated image showing data-driven projection of business performance trends across five years using charts and analytics for strategic planning and decision making Marrow
00:10
HD
Data analysis with interactive charts and graphs. Statistical information shows market trends and performance insights. Visual data representation enhances decision making.
00:07
HD