A link to set your password has been sent to: To access your purchases in the future you will need a password.
Create without limits — unlimited downloads, plus powerful AI editing
New filters added
Sort by

87,336 results for connection chart in videos

Blue heart rate abstract digital background with glowing tech effects
00:08
HD
Data analysis process flow database network connection gear analytics growth chart abstract technology concept
00:20
HD
Rising arrow graph digital growth concept with blue glowing chart and upward trend showcasing futuristic data visualization and digital progress in business technology sectors
00:09
HD
Up arrow animation on green background. direction arrow icon motion. Up arrow isolated. swipe up pointing video footage-4k green background icon animation
00:10
HD
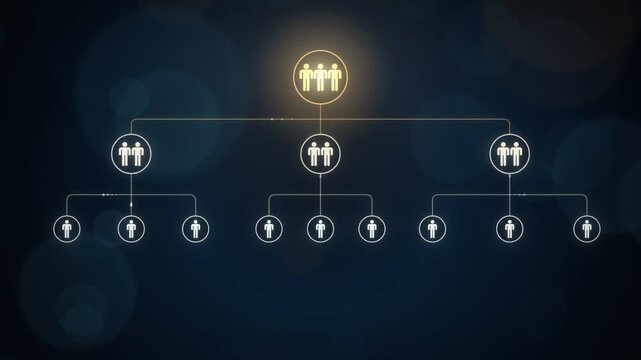
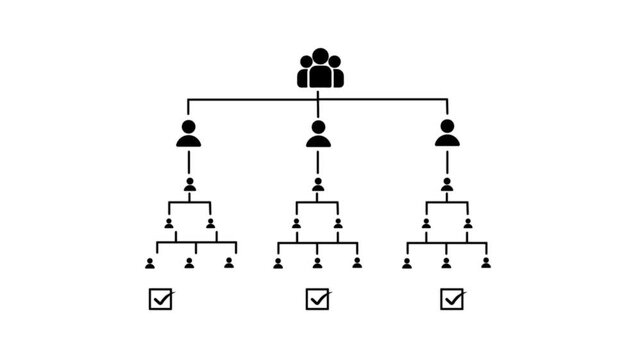
corporate structure hierarchy business organization chart animation
00:29
HD
A futuristic glowing blue digital chart with rising bars and a trend line representing business growth analytics and financial success metrics on a dark background
00:15
HD
Top Down View of Business Professionals Collaborating Around Office Table With Laptops and Charts as Linked Visualization Layer Appears, Glowing Blue AI Icons Represent Data Analytics and Security.
00:13
HD
Stock market candlestick chart hologram on digital world map,global financial index analysis,business economy investment.Global market analysis world map with stock market graph overlay animation
00:15
HD
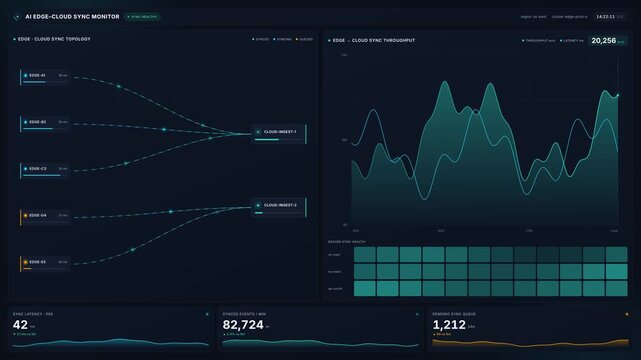
Advanced 4k ai edge cloud sync monitor interface with real time network traffic data server performance graphs, for big data analysis, digital security, system
00:20
HD
Workflow process optimization interface displaying business methodology layout and corporate data analytics.
00:14
HD
White animated social network icon. Network of connected people with peripheral circle nodes, ideal for illustrating social networks, teamwork, connectivity, relationships, communication, technology.
00:10
HD
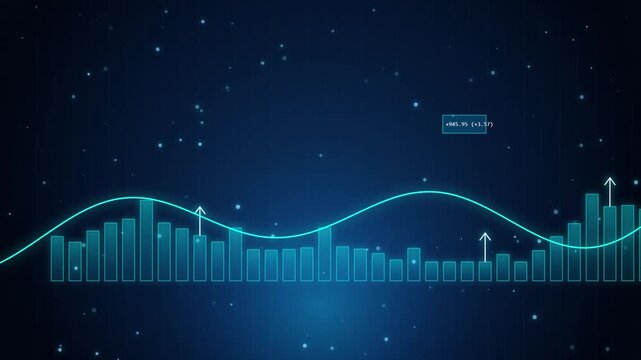
Digital data chart animation showing financial market growth with moving sine wave graph over dark grid background representing modern stock exchange statistics.
00:10
HD
Golden 3D rising bar chart and yellow arrow symbolizing success and growth on a digital world map, concept for investment strategy, financial planning and global trading analysis
00:05
HD
Abstract digital illustration of an AI decision flow showing glowing data lines converging into a central HUD target reticle on a dark blue background.
00:10
HD
Data visualization animation showing digital bar charts and abstract network nodes moving across white background in dynamic business video footage
00:10
HD
Stock Market monitor screen while open market for trading sell and buy stock online. Business economic and finance concept.
00:22
HD
Financial stock market chart featuring rising and falling graph lines superimposed over the United Kingdom national flag, representing economic trends, investment opportunities, and market performance
00:10
HD
Smart city skyline of Chicago showing futuristic financial data, stock market infographics, business analytics, big data visualization over urban landscape
00:06
HD
3D render: Abstract digital financial data charts background. Futuristic business analytics, market research, global network concept. Big data report, statistic visualization. Ideal for tech
00:20
HD
Abstract digital background with glowing blue wave lines and financial trading chart elements.
00:10
HD
Scheme hierarchy management of corporate.	Organizational chart company hierarchy,roles,team structure,showing connections between managers, employees,and departments for clear communication workflow.

00:10
HD
Smart city at night slowly generating data visualizations
00:15
HD
Hands, tablet and person writing in notebook for planning, agenda or financial report. Accountant, notes and digital bookkeeping with to do, data analytics or tasks for business audit and summary
00:06
HD
Global Business Partnership: Two businessmen in suits shake hands, symbolizing a successful international deal with a world map and financial charts in the background.
00:05
HD
Futuristic HUD technology interface screen showing progress concept with growth chart target idea icons dashboard display.
00:15
HD
Teal and green bar chart with hundred percent grid. Financial profit chart for corporate business economics success. Digital bar graph animation for progress report.
00:06
HD
Top Down View of Corporate Team Working Around Conference Table With Laptops and Documents as Linked Visualization Layer Appears, Glowing Ai Icons Represent Cloud Storage, Cybersecurity and Analytics.
00:12
HD
Business team analyzing financial data projected on a futuristic interactive touchscreen interface, working together using innovative technology for investment strategy and market analysis
00:05
HD
Organizational chart animation showing corporate hierarchy or business structure on black background 4k video animation
00:10
HD
Close-up of stock market analyst working in front of computer screen
00:26
HD
Blue digital dashboard with glowing charts and data graphs
00:06
HD
Telemedicine virtual consultation interface for remote patient care monitoring and digital health visits.
00:14
HD
Ship bridge with multiple digital screens and control panels for advanced marine navigation, radar, electronic charting and autopilot systems guiding vessels across open sea
00:05
HD
Dashboard animation displays financial market data with a downward arrow on dark. Business revenue downturn analytics track on dashboard. Consoles monitor dashboard.
00:21
HD
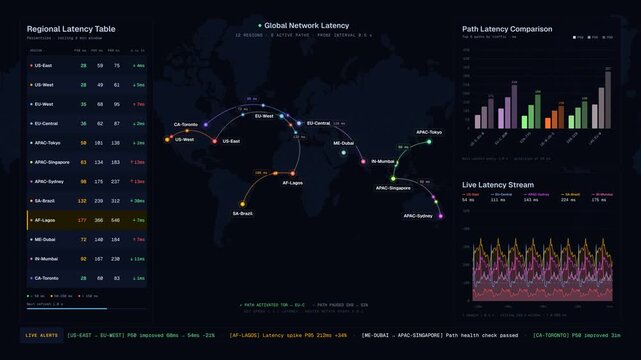
Network latency dashboard comparing response times across regional connection paths with world map, animated data points, and live metrics in 4K. for commercial creative technology and business use.

00:15
HD
Hologram, chart and increase on dark background for finance, stock trading and cryptocurrency. Economy inflation, digital overlay and graph, statistics and data for internet, fintech or profit growth

00:12
HD
Stock market candlestick chart hologram on digital world map,global financial index analysis,business economy investment.Global market analysis world map with stock market graph overlay animation
00:24
HD
Smart city network showing big data communication and financial charts in downtown Chicago with futuristic digital overlay and information graphics connecting buildings
00:11
HD
A professional analyzing business data through an interactive digital interface, showcasing various graphs and metrics in a modern workspace setting. Cipher
00:13
HD
 Abstract technology background representing corporate DSP connection and digital infrastructure.
00:10
HD
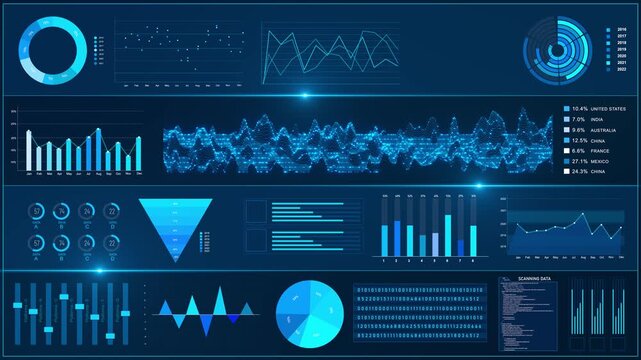
High tech interface screen circular HUD display, charts, graphs analytics panels background. data monitoring system visualization for technology presentations dashboards cybersecurity innovation media
00:20
HD
Glowing neon line Business hierarchy organogram chart infographics icon isolated. Neon flowchart, Corporate organizational structure graphic , network diagram, hi-tech illustration animation...
00:10
HD
Blue lines flowing and connecting on dark background.
00:10
HD
Team organization chart expanding downward through four levels of connected group icons
00:15
HD
Digital financial chart motion graphic showing fluctuating stock market data visualization with numbers and blue lines video footage
00:08
HD
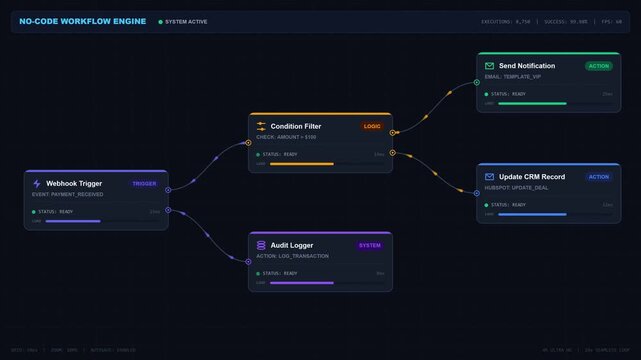
Automated workflow engine interface with digital logic flow and visual node programming builder
00:20
HD
Top Down View Of Diverse Team Of Business Specialists And Managers With Laptops Entering The Conference Room And Sitting Behind Table To Discuss Financial Data And Sales Reports In Corporate Office.
00:13
HD
Business data visualization with bar chart and connection icons
00:10
HD
abstract digital background with glowing lines and particles moving in waves, technology and data concept
00:10
HD
A person using a smartphone with glowing digital financial graphs overlaying the cityscape at sunset.
00:10
HD
Collaborative team in company office sharing project files via cloud integration, digital ecosystem HUD icons. Aerial view of business colleagues syncing documents via online network on remote server
00:31
HD
Digital visualization of user network connections with a glowing central node on a dark background, concept for social media marketing, big data analysis and professional networking
00:08
HD
Neon-lit monitoring concept with glowing blue lines and symbols on a black background with a futuristic feel.
00:10
HD
Holographic market analytics dashboard with fluctuating statistics. Digital interface showing financial growth patterns.
00:05
HD
Neon Energy Radar Screen Technology Animation on black background. glowing neon searching Rader concept animation.
00:10
HD
Business teamwork hud with ai system technology, digital data chart screen animation, financial network flow loop.
00:15
HD
Timeline clip with five circles 4k animation video. Growing horizontal line and orange circle data points on a dark grid background. Useful for information sharing and animated infographic
00:10
HD
London skyline showing big data infographics with charts and diagrams. Financial technology information overlay on Europan city. Modern smart city with data visualization
00:11
HD
Abstract digital bar chart visualization representing global network data Motion Graphic
00:15
HD
 Abstract technology background representing corporate NPU connection and digital infrastructure.
00:10
HD
Stylized financial chart with illuminated line graph and reflective bar chart, futuristic minimal aesthetic animation
00:08
HD
Digital bar chart displays international financial growth metrics. Advanced bar chart visualizes global corporate data statistics. International business connection with bar chart.
00:12
HD
Organizational hierarchy chart animation: business management structure and team growth concept
00:10
HD
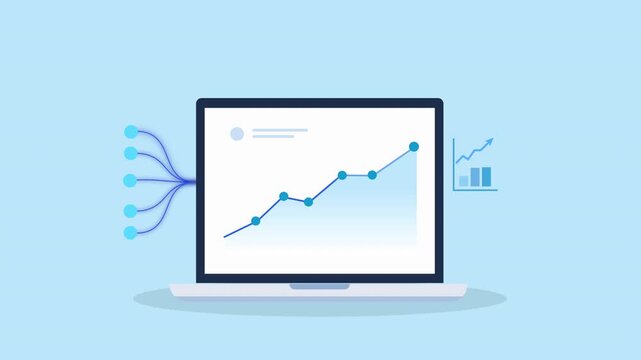
Minimal flat animation of a laptop displaying a rising data chart with incoming data lines and a statistics icon, representing analytics, data analysis, and business performance insights.
00:10
HD
Process Flow Diagram with Arrows and Boxes Minimal Icon. Work flow Chart Symbol with Connected Steps. Flowchart Icon with Directional Arrows and Blocks .4K Motion Graphics.
00:10
HD
Futuristic Artificial Intelligence Network with Neon Data Connections, Digital AI Chip Interface, Glowing Technology Circuits and Connected Data Streams on a Dark Background
00:10
HD
Top View of a Business Meeting With Interactive Holographic Data Visualizations. Professionals Analyze Charts, Graphs, and Percentages Projected. AI Technology in Modern Corporate Revenue Growth
00:13
HD
Sleek digital cyber connection nodes converging into circular HUD audio equalizer chart background
00:10
HD
Digital analytics data background, glowing blue lines, dots, graphs, network. Represents business intelligence, financial growth, technology, innovation. Concept of big data, global communication
00:20
HD
Abstract digital network with glowing lines and nodes, data charts and code snippets, futuristic technology concept, connection and analysis, blue and purple gradient
00:12
HD
Agentic ai multi agent collaboration workflow diagram with data input process analysis and auto optimize concept for future technology modern office
00:08
HD
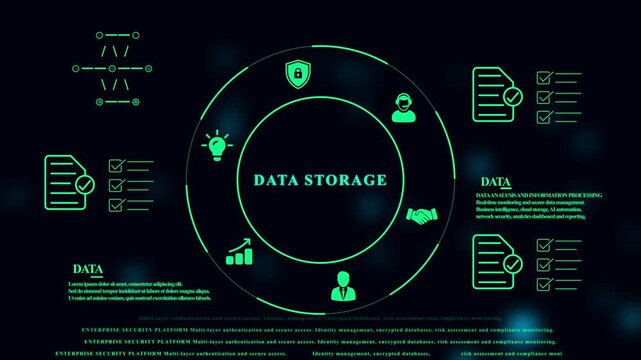
Digital infographic interface displaying data storage concepts with glowing green and circular charts on a dark background for cyber protection
00:10
HD
Professional businessman broker analyzing global stock exchange chart and graph for financial investment strategy and profit growth, management marketing
00:19
HD
Abstract digital business chart showing financial growth graph finance data success network
00:07
HD
Abstract financial chart showing market growth and data fluctuations on dark blue background.
00:15
HD
AI agent automation workflow diagram with glowing connected nodes and animated data flow lines
00:15
HD
Blue digital world map background dotted continents, glowing grid floor, and futuristic global data space. news , finance reports, business intros, travel screens, network visuals, technology overlays
00:20
HD
Global finance stock market digital data technology economy trading graph network investment business chart analysis futuristic virtual earth connection currency growth trend background digital globe
00:08
HD
Abstract digital arrow pointing upwards, representing growth and progress in the future
00:08
HD
 Abstract technology background representing corporate VPU connection and digital infrastructure.
00:10
HD
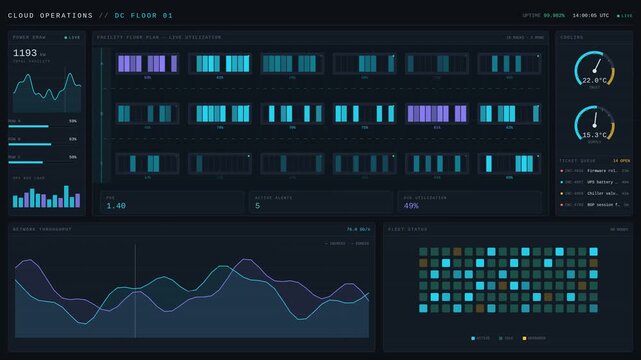
Digital data center cloud operations dashboard displaying real time analytics
00:15
HD
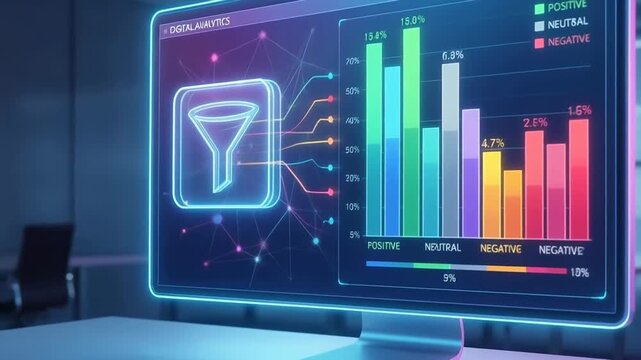
Tech business metrics visualization digital screen with colorful bar chart showing social media sentiment analysis and emoji reactions modern office
00:05
HD
Organizational hierarchy chart animation: business structure, team management, and strategic planning process
00:10
HD
Abstract digital bar chart with connection lines on dark background
00:24
HD
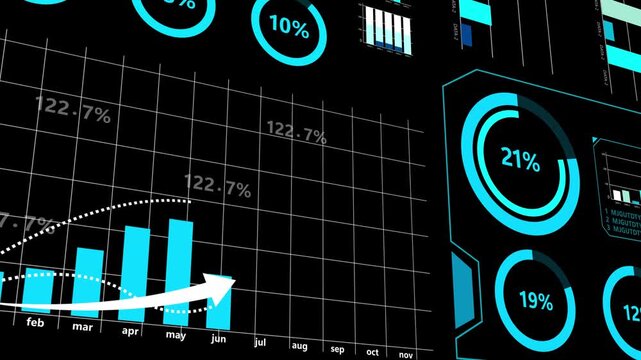
Percent growth chart animation rises on dark grids. Corporate percent growth chart animation tracks dividend success. Modern percent growth chart animation details returns.
00:11
HD
Minimalist horizontal timeline animation with growing white line and circular nodes on black background.
00:06
HD
Top Down View: Multiethnic Male And Female Colleagues Using Desktop Computers In The Fintech Startup Office. Managers, Financial Analysts Working, Analyzing Data On Graphs And Charts, Creating Reports
00:08
HD
Concept of efficient business processes and productivity optimization using glowing blue gear systems and icons.
00:13
HD
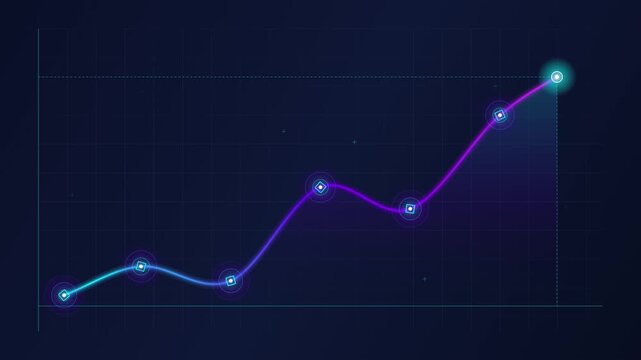
Glowing neon financial chart rising upward with dynamic data points on grid
00:08
HD
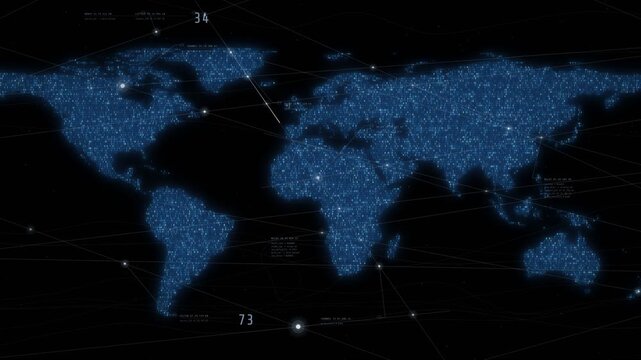
Animated world map made of binary code digits with moving plexus network lines, HUD data labels, global cyber security and big data connection concept
00:15
HD
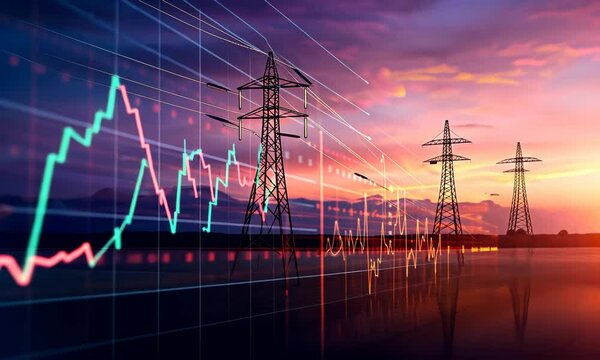
Data Visualization of Energy Trading: A modern representation of energy market data using a candlestick chart against a blurred background of infrastructure.
00:10
HD
Sinusoid wave analysis data network technology on futuristic overlay
00:20
HD
Futuristic digital data flow with analytics interface. Abstract technology scene showing a futuristic digital environment with floating data and analytical elements in blue tones. Seamless loop 4k
00:15
HD
futuristic infographic of data connections and global network represent Big data concept and node base programming,4k seamless loop
00:08
HD
Business people working in office
00:33
HD
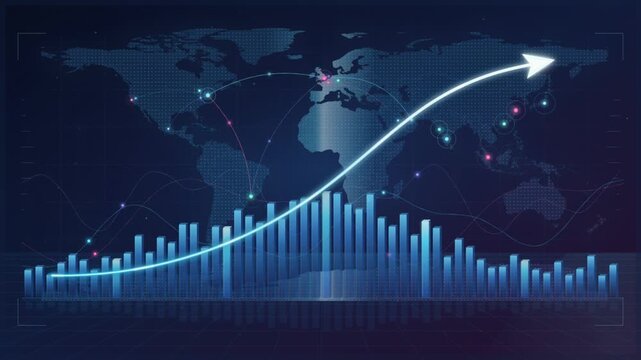
Rising business growth arrow over blue bar chart with world map and global connection network
00:15
HD
Futuristic Blue Digital Data Dashboard Financial Charts Graphs, High-tech HUD interface displaying analytics statistics. business presentations, financial market updates, stock trading technology
00:20
HD
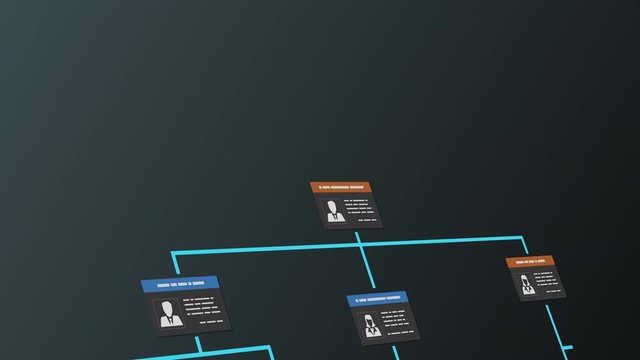
company organization chart with employee badges, scrolling on screen
00:15
HD
Business Network Connections Economic Signals 3D Animation Cyberspace Blue Lines Dots 4K flight flying line dot node digital cloud computer connect connection global net technology big datum database
00:10
HD
 Abstract technology background representing corporate DPU connection and digital infrastructure.
00:10
HD