A link to set your password has been sent to: To access your purchases in the future you will need a password.
Create without limits — unlimited downloads, plus powerful AI editing
New filters added
Sort by

7,331 results for concept data graph ui in videos

Abstract stock market performance graph animation with digital trading data overlay. Business and Economy Related Abstract 3D Concept.
00:16
HD
Professional man in a suit managing a complex project workflow by touching a futuristic virtual user interface with a glowing flowchart, demonstrating advanced business automation technology
00:09
HD
Digital security concept with padlock icon and data analytics charts on a futuristic blue hexagonal background
00:20
HD
Glowing neon line graph rising on black background, financial growth concept animation chart
00:10
HD
Investment strategy infographic animation featuring dynamic financial growth charts, and corporate planning for modern business presentations, data visualization, and market analysis
00:10
HD
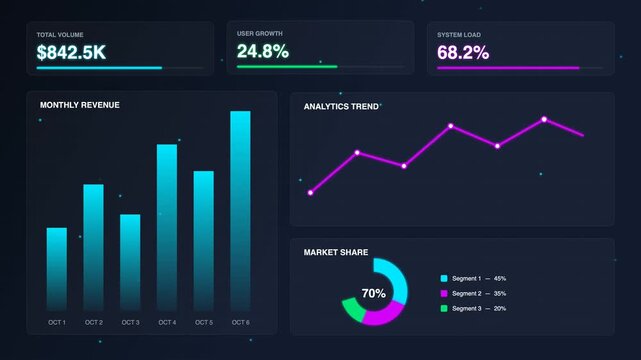
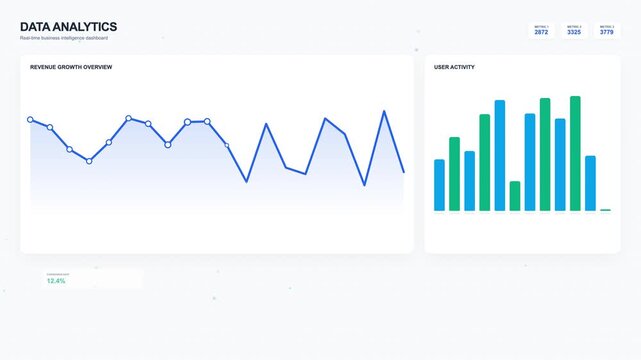
Data Analytics Dashboard with Animated Bar Chart, Donut Chart and Line Graph
00:08
HD
HUD line graph tracking data fluctuations and market trends, futuristic cyber technology overlay 4k video
00:10
HD
Comprehensive business analysis concept animated featuring glowing global network infographics, strategy data charts, and corporate growth metrics on modern dark digital background
00:10
HD
Abstract Financial Stock Market Charts Displaying Multiple Rising Trends Over Dark Background
00:20
HD
Rising line graph animated line icon, white outline with yellow accent on transparent background, digital marketing and analytics concept
00:06
HD
Digital data analysis concept with a magnifying glass focusing on a glowing bar chart graph on a dark background
00:15
HD
Minimalist neon line graph rising on black background, financial growth and data analysis concept chart
00:10
HD
Glowing neon line graph rising on black background, financial growth and data analysis concept for business presentations
00:06
HD
Abstract financial data visualization with orange glow line graph and blue grid.
00:10
HD
Neon green financial chart line graph on black background, digital data analysis and business growth concept
00:15
HD
Futuristic Digital Dashboard with Neon Charts and Data Visualization Graphs.
00:06
HD
Digital interface displays a circular data visualization with a growth chart on a tablet screen in a futuristic, glowing blue aesthetic for analytics.
00:05
HD
Futuristic HUD interface displaying glowing data charts and readouts, digital technology concept
00:07
HD
Digital dashboard displaying upward growth chart with bar graph and circular progress indicator on transparent background.
00:10
HD
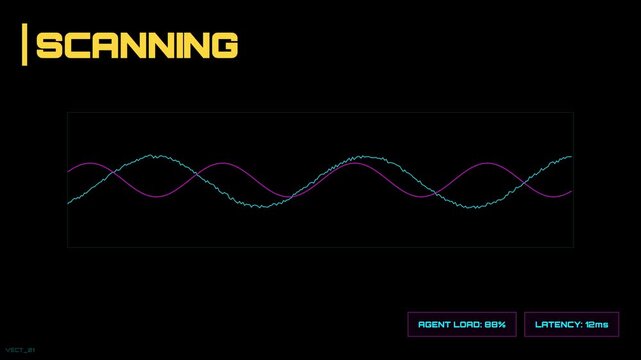
Futuristic digital HUD interface screen displaying a scanning process with neon wave graphs and data metrics including agent load and latency for technology and sci-fi concept background.
00:07
HD
Abstract stock market data graph animation with financial charts and statistics. Business and Economy Related Abstract 3D Concept.
00:16
HD
Dark analytics dashboard user interface with live line charts, gauge, bar graph and progress rings, business data monitoring concept, seamless loop 4K
00:10
HD
Financial stock market data and world map analytics visualization
00:06
HD
Abstract digital interface with data visualization charts and graphs on a dark background
00:15
HD
Futuristic business data dashboard hologram display, glowing blue digital bar chart and analytics graph overlay, modern financial growth screen concept
00:09
HD
Minimalist animated line graph with moving nodes, digital data flow and progress concept on dark background
00:10
HD
Neon green glowing line graph rising on black background, financial growth concept
00:09
HD
Digital futuristic interface with animated charts and graphs, radar screen, data streams, and glowing elements on a dark background, technology concept
00:06
HD
Minimalist white animated bar chart graph with upward trending arrow on a solid black background, representing financial growth, business success, positive, market trends, and, data analytics progress
00:10
HD
Green digital line graph rising on dark background for financial growth and data analysis.
00:05
HD
Abstract neon bar graph animation: dynamic financial growth and data visualization concept 4k
00:10
HD
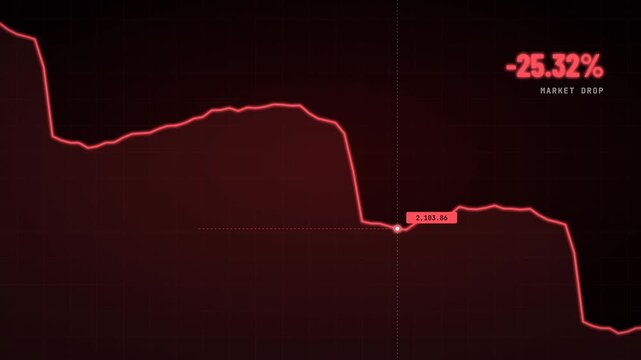
Red market crash graph
00:12
HD
Futuristic digital interface with glowing data charts and graphs in a dark environment
00:08
HD
financial analytics concept with digital hud elements and business icons for data visualization and strategic decision making. abstract visualization of financial management, investment analysis.
00:15
HD
Futuristic user interface with globe, code, and data graphs in blue tones for technology concepts
00:10
HD
digital business dashboard interface showing data analytics metrics and line graph centered on dark blue background with various numeric dimension notations surrounding the UI card element
00:06
HD
Futuristic digital HUD interface with white tactical telemetry overlay, altitude tracking waypoints, and line graph on dark background, concept for military surveillance technology, gaming UI design,
00:10
HD
Minimalist abstract line graph animation, dynamic cyan data trend motion on black background, blue business
00:10
HD
Flat vector animation of a desktop analytics dashboard with charts, notification bell, chat bubbles, and email icons. Concept of alerts, communication, and real time business updates.
00:10
HD
Skill gap concept on virtual screen with futuristic interface and glowing lightbulb
00:07
HD
Abstract business data graph visual animation for corporate finance and investment. Business and Economy Related Abstract 3D Concept.
00:16
HD
Digital UI animation interface with glowing data charts and floating HUD elements
00:11
HD
Curved neon line graph showing exponential growth on a dark grid background.
00:12
HD
Productivity dashboard showing data analytics and progress bars
00:15
HD
Futuristic startup growth dashboard with digital data visualization
00:15
HD
A digital graph displays ascending bars in green and blue with a glowing line trend, set against a dark background, indicating data growth
00:12
HD
Futuristic digital dashboard displaying analytical data visualizations
00:10
HD
Abstract 3D render of floating holographic charts and waveforms in a dark tech space. Digital dashboard visualization concept for data analysis and AI.

00:05
HD
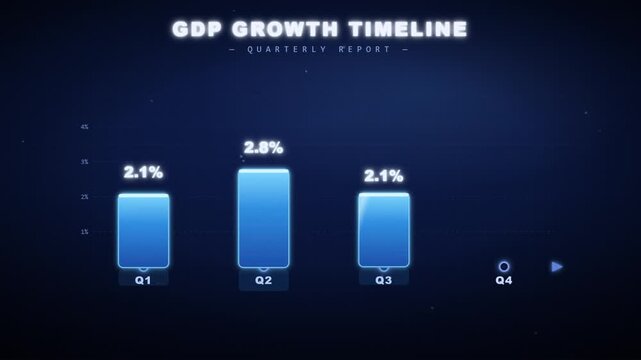
Animated blue business bar chart and line graph showing quarterly GDP growth timeline and annual percentage
00:12
HD
Abstract high-tech futuristic HUD UI dashboard concept with dynamic data visualization, glowing digital grids, telemetry elements, pie charts, progress bars, and glowing geometric circuits. Ideal for
00:10
HD
Futuristic digital radar screen interface displaying data analysis and target tracking with glowing blue elements and grid overlay, technology concept
00:11
HD
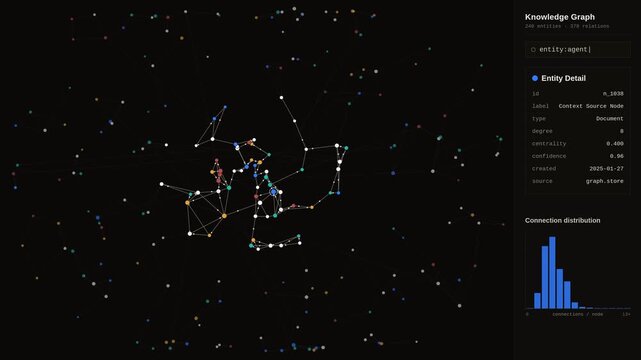
Dark-themed knowledge graph visualization dashboard with color-coded nodes and interactive sidebar interface. professional stock footage for technology, business, and editorial use.

00:15
HD
Clean login form followed by data analytics dashboard with interactive charts, concept for web development, software interface and business intelligence
00:10
HD
Silhouettes of people looking at futuristic data screens, glowing blue corporate technology and global network connection concept background.
00:10
HD
Futuristic digital interface displaying complex data visualizations, charts, and a 3D schematic in a dark, modern environment with glowing blue elements, technology and analytics concept
00:08
HD
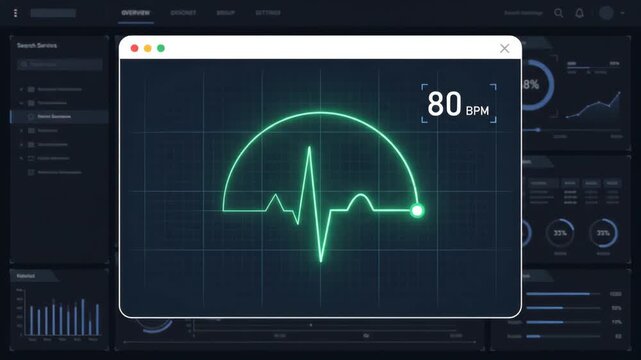
digital heartbeat monitoring interface pulsating within software application window set against dark background featuring complex data analytics charts and informational dashboard metrics
00:06
HD
Neon purple financial downtrend graph arrow moving downwards on black background, for economic loss analysis
00:10
HD
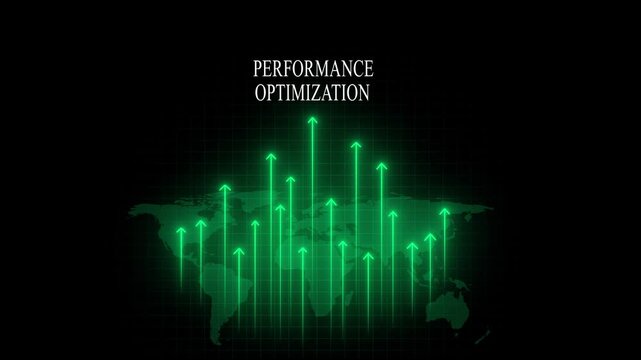
Performance optimization digital graph with rising arrows over map background, business growth data
00:06
HD
Neon green digital growth graph rising on black background, financial data analysis concept chart finance
00:10
HD
Digital concept of decentralized finance with cryptocurrency symbols, data graphs, and user interface elements on a glowing background. Entropy.
00:10
HD
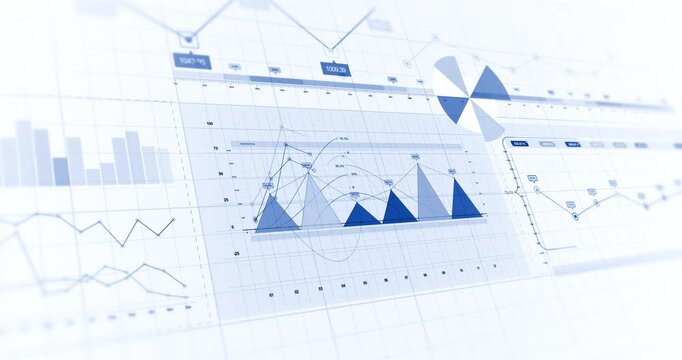
Clean blue financial dashboard graph animation with stock market data overlay. Business and Economy Related Abstract 3D Concept.
00:16
HD
Bullish financial chart and business data on a futuristic digital display. Stock market investment and economic growth concept
00:08
HD
Minimalist digital user interface dashboard with abstract data visualization graph and connected points on a clean white background. Modern web design and software analytics concept for technology.
00:10
HD
Futuristic digital dashboard with data visualization charts and graphs
00:12
HD
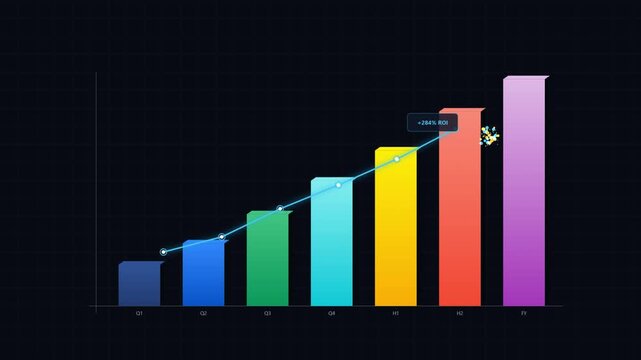
Animated business growth bar chart with roi data overlay financial performance and market analysis concept
00:10
HD
Glowing red neon line graph rising upward on black background, digital financial growth chart showing positive market trends, business success concept, animated data visualization for presentation
00:10
HD
Space junk monitoring dashboard animation showing orbital debris and satellite tracking data around Earth
00:30
HD
Dynamic investment concept infographic featuring animated hexagonal ui financial growth strategic business planning symbols, and digital data visualization for corporate financial presentations
00:10
HD
Abstract digital background with glowing wave lines and bar graph data visualization, representing technology, financial analysis, and data science concepts
00:10
HD
Futuristic glowing neon HUD callout frame for digital interface on black background with alpha channel. Sci fi HUD broadcast titles and callout concept animation.
00:10
HD
Futuristic UI interface with glowing icons and data visualization, digital technology concept, blue and purple gradients
00:06
HD
Animated exponential growth chart rising on black background, business data visualization concept graph
00:10
HD
Digital business improvement concept featuring animated hud interface with global growth metrics, financial strategic planning symbols, and data analytics visualization for corporate presentations
00:10
HD
Dashboard animation displays financial market data with a downward arrow on dark. Business revenue downturn analytics track on dashboard. Consoles monitor dashboard.
00:21
HD
Neon red line graph rising upward, financial growth and success concept animation glowing
00:10
HD
Strategic marketing concept display with futuristic HUD interactive interface, featuring business analytics, target audience, and campaign planning
00:17
HD
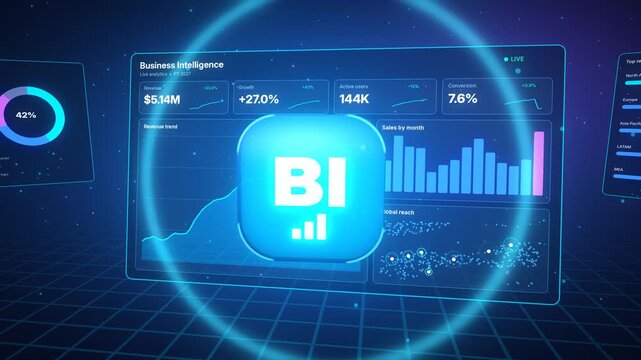
3D glowing BI icon button over virtual business intelligence dashboard with charts and KPI, futuristic data analytics hologram concept 4K
00:08
HD
Neon financial chart animation with glowing data waveform for business analytics and digital growth concepts
00:15
HD
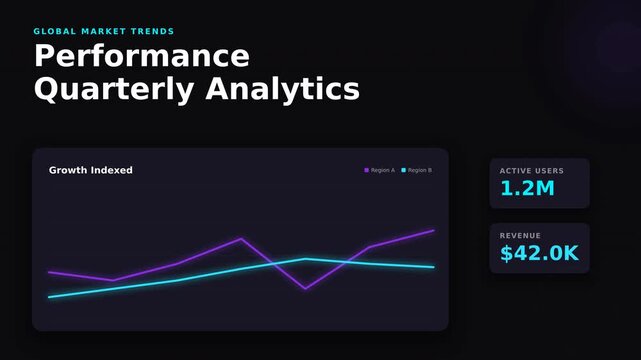
Sleek digital dashboard with glowing neon line graphs showing quarterly performance analytics, concept for an income tracker and financial growth monitoring, ideal for business presentations and SaaS
00:10
HD
Glowing blue neon line graph rising upward, financial growth and business success concept animation chart
00:10
HD
Stock market trading interface animation with financial data graphs on screen. Business and Economy Related Abstract 3D Concept.
00:16
HD
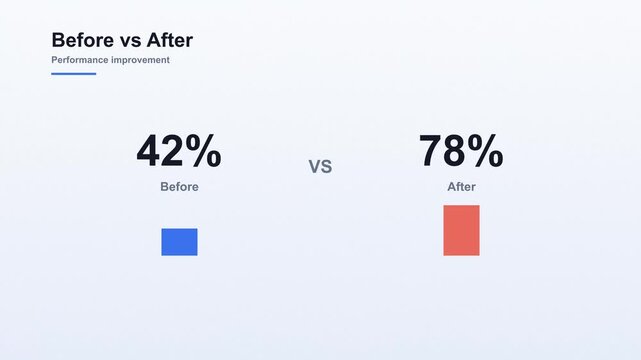
Light theme animated comparison chart showing performance improvement before versus after
00:10
HD
Minimalist laptop computer with ascending digital data graph animation
00:10
HD
Red arrow pointing left on digital grid background, abstract motion for business data analysis, financial trends, and navigation concepts
00:06
HD
Minimalist neon line graph animation: abstract financial data trends and digital growth concept 4k
00:10
HD
Neon pink financial growth chart animation, rising business success graph with arrow, digital data analytics trend line, glowing stock market performance concept on black background
00:10
HD
Glowing green neon line graph rising on black background, financial growth and data analysis concept
00:10
HD
Dynamic proof of concept poc digital interface featuring animated hud corporate business global network connectivity, financial growth graphs, and futuristic data visualization technology
00:10
HD
Minimalist line graph animation, digital data visualization, abstract business growth concept, blue ui on dark background
00:10
HD
Glowing blue neon line graph rising on black background, financial growth and data analysis concept
00:10
HD
Dynamic gdp growth infographic animation featuring financial and data visualization for corporate economic presentations, market analysis reports, and global business strategy planning concepts
00:10
HD
Bullish financial chart and business data on a futuristic digital display. Stock market investment and economic growth concept
00:08
HD
blue glowing digital line graph animation with downward trend and arrow on black background. minimalist animation of a data trend fluctuating downwards, ideal for technology and business presentations
00:07
HD
Flow data analysis code program business dashboard graph 4k
00:20
HD
Futuristic digital interface element with a glowing wave graph and data particles, isolated in a dark space environment for hightech ui design
00:15
HD
Glowing cyan line graph rising on dark background, financial growth and data analytics concept business
00:10
HD
Futuristic user interface with HUD and infographic elements. Looped motion virtual technology background. Intelligent head-up display dashboard for business, games, motion design, web and app.
00:20
HD
Motion graphic of head up display ( HUD UI ) technology interface screen with futuristic elements graph and chat panel dashboard abstract background
00:15
HD
Rising line graph animated line icon, dark navy outline with orange accent on transparent background, digital marketing and analytics concept
00:06
HD
Digital HUD Animation. Radial graph visualization on dashboard panel. Futuristic user interface. Virtual data rounded graph concept. Bright glowing blue colored 4K backdrop with Depth of Field effects
00:20
HD