A link to set your password has been sent to: To access your purchases in the future you will need a password.
Create without limits — unlimited downloads, plus powerful AI editing
New filters added
Sort by

3,879 results for cluster chart in videos

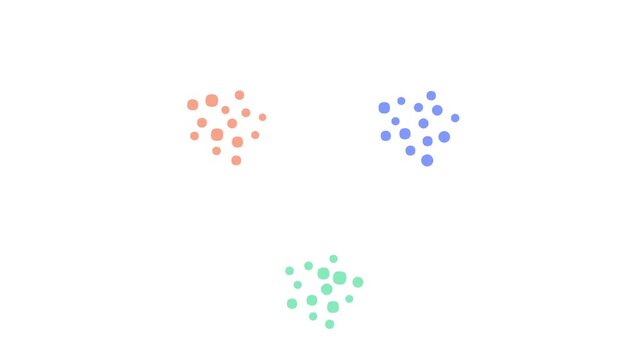
Colorful scattered particles sorting into three part pie chart
00:10
HD
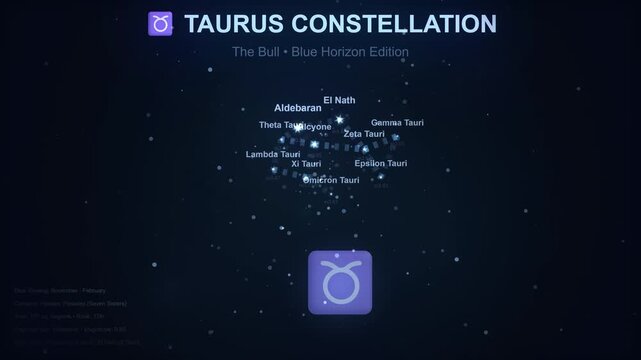
Explore the radiant beauty of the Taurus constellation, a celestial bull formed by brilliant stars, meticulously plotted against the deep, dark expanse of the universe
00:30
HD
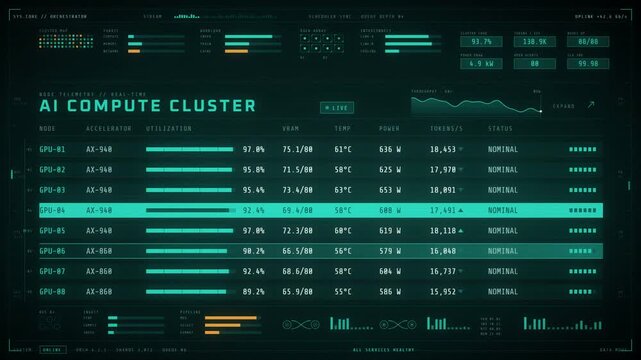
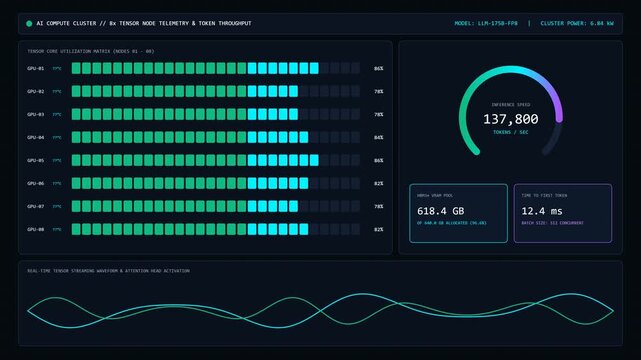
AI compute cluster dashboard animation with GPU node telemetry and thermal alert status
00:20
HD
Laptop receiving business metrics input and generating 3D bar chart line graphs arrow code panel
00:10
HD
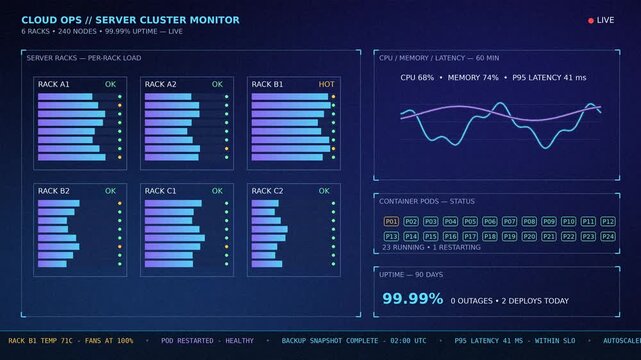
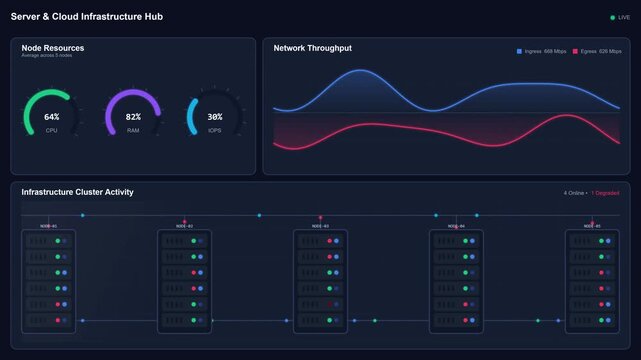
Cloud server cluster monitoring dashboard with server rack load bars, CPU memory latency charts and container pod status, animated data visualization
00:10
HD
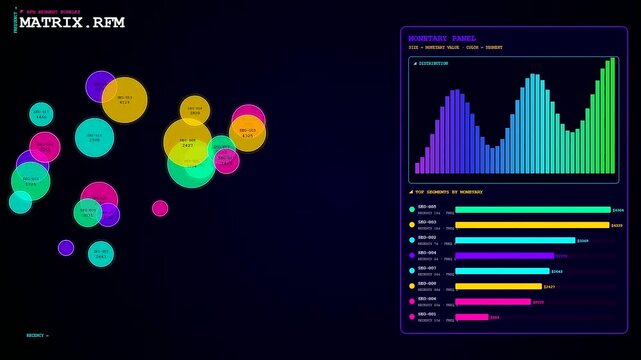
Data visualizations showing audience segmentation and cluster analysis using glowing bubbles and dynamic bar charts on a dark interface for modern digital market research presentations
00:06
HD
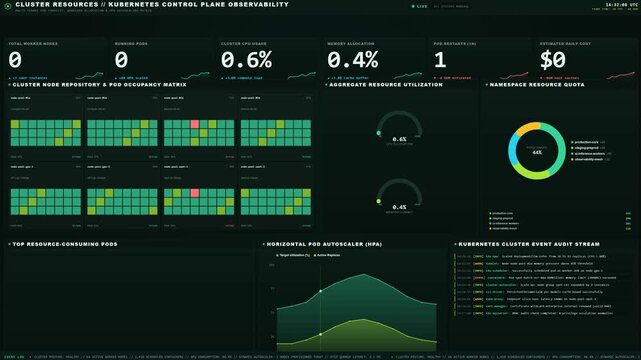
Advanced kubernetes control plane dashboard displaying cluster resources node occupancy and real time metrics
00:15
HD
Motion graphic icon displaying a global community network node structure chart connecting multiple points around a single human avatar.
00:10
HD
Cinematic 4K dark-mode Kubernetes cluster health dashboard showing nodes, pods, and resource utilization with real-time animated metrics and status indicators.
00:15
HD
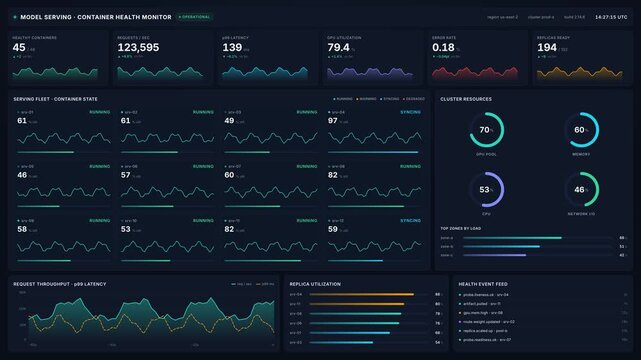
Dashboard monitoring system with container health status metrics cluster resources, for cloud computing, data analysis, software performance, network infrastructure management
00:20
HD
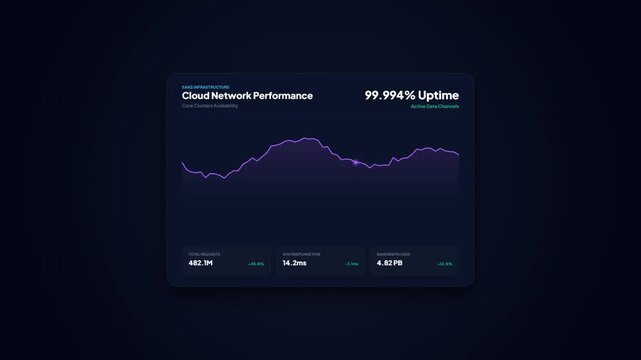
Cloud Network Performance Monitoring Dashboard with Purple Line Chart for Data Server Uptime and Bandwidth Analytics Interface Animation
00:08
HD
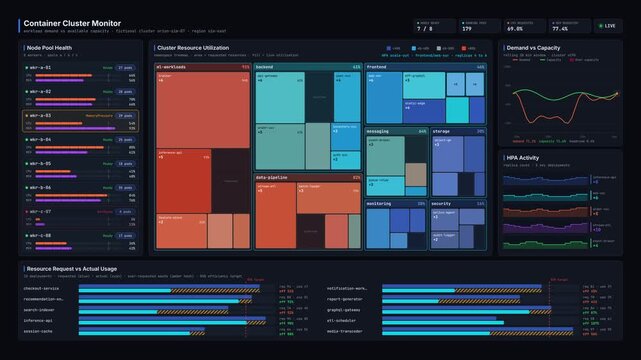
Kubernetes monitoring dashboard animation showing cluster resource utilization treemap, node health, and workload demand charts in dark mode for commercial creative technology and business use.
00:15
HD
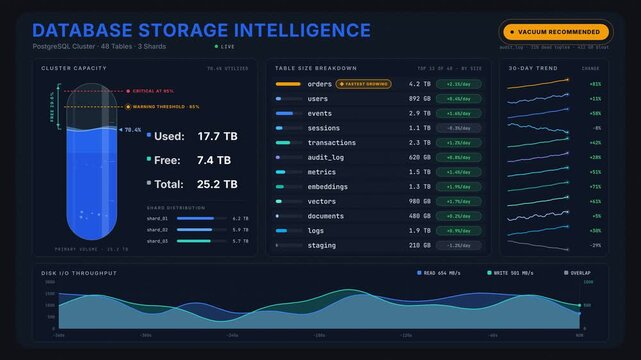
Database storage dashboard animation showing table growth metrics, available disk space cylinder, and real-time I/O activity charts on a dark premium interface.

00:15
HD
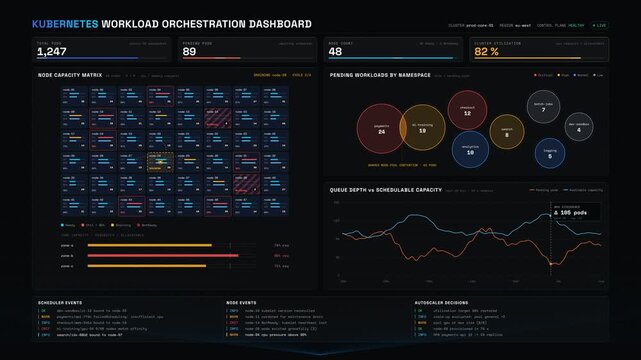
Kubernetes operations dashboard showing pending workloads and node capacity with animated charts, KPI counters, and cluster utilization metrics in a dark 4K interface.
00:15
HD
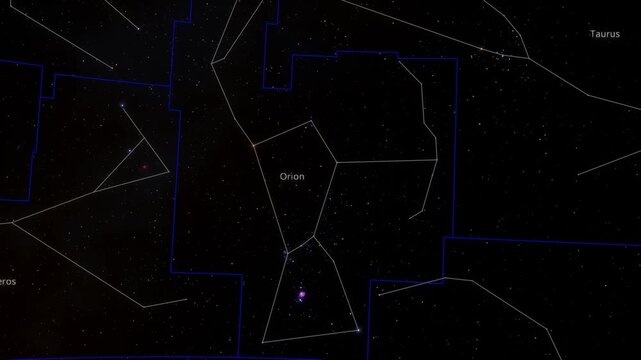
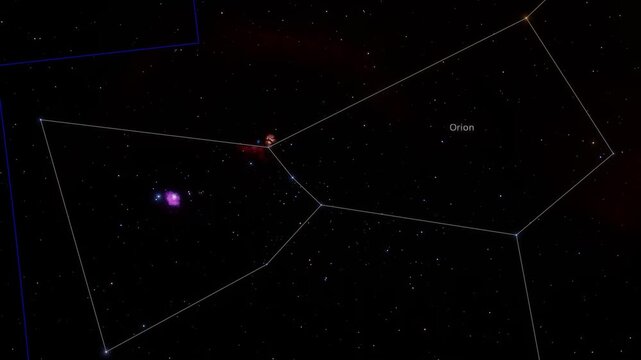
Rotating part 1 video of Orion constellation star chart mapping, detailing boundaries, connecting lines, and neighbouring deep-sky objects like the Orion Nebula against a dense starfield background.

00:20
HD
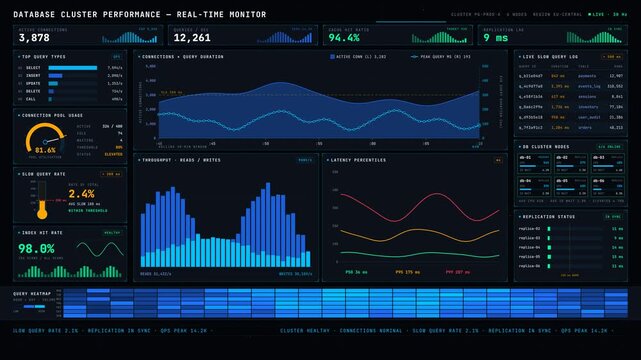
4K real-time database cluster performance dashboard animation with live query metrics, connection counts, and latency charts on a dark neon interface for IT monitoring.
00:15
HD
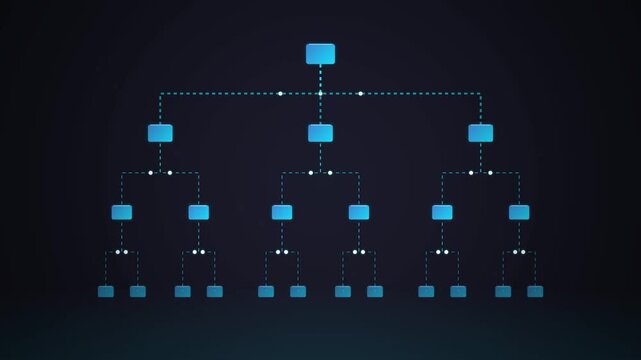
Abstract digital hierarchical network structure showing data flow and organization with blue glowing nodes on a dark futuristic background
00:10
HD
Modern data center server cluster monitoring network throughput and
00:20
HD
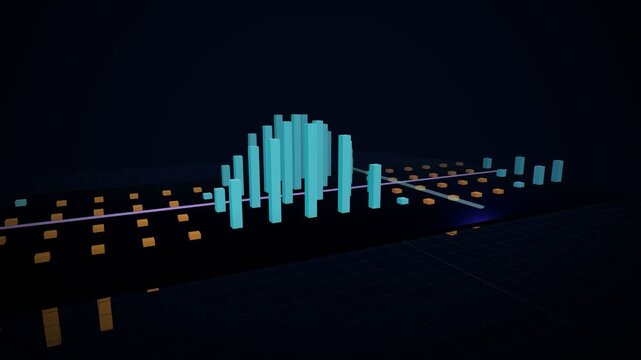
Wave shaped cluster of cyan bar chart columns rising and falling with orange data markers and sweeping camera
00:10
HD
Bitcoin tokens swirling above glowing circuit board while holographic chart appearing, AI-generated
00:05
HD
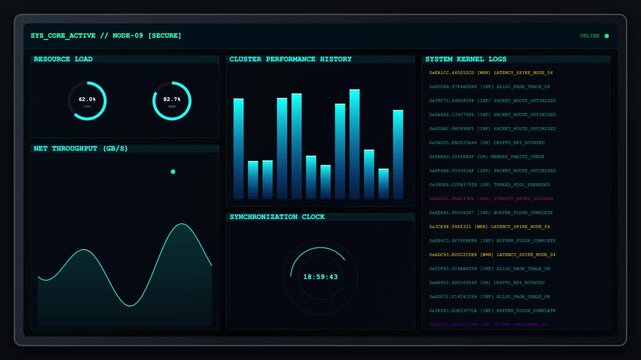
Futuristic cyber security dashboard showing cluster performance history telemetry graphs and live system kernel logs.
00:10
HD
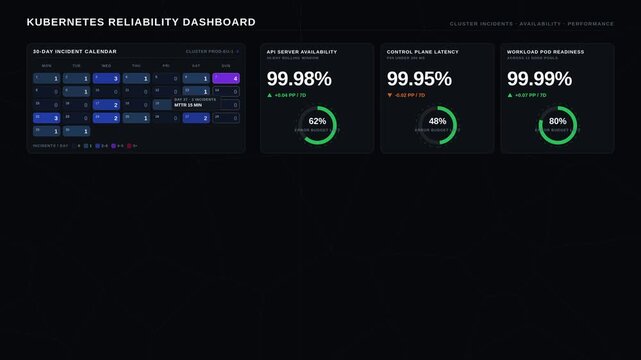
Kubernetes Reliability Dashboard displays cluster incidents, availability, and performance metrics with a visual calendar, SLO panels, and incident breakdown timeline.
00:15
HD
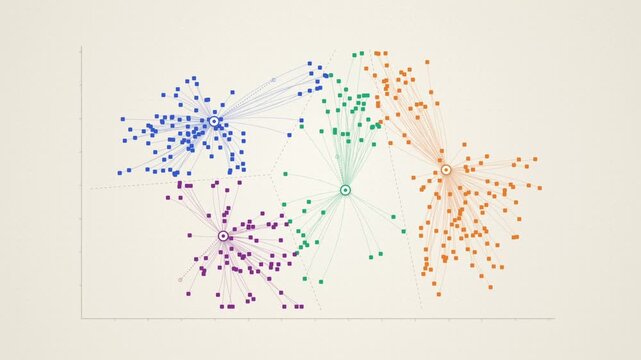
Data clustering animation, gray scatter plot points sort into four colored segments around moving centroids
00:14
HD
On load central HUD building rings drawing panels sliding binary stream chart updating to show data
00:12
HD
Futuristic 3D digital bar chart and glowing blue cubes representing big data technology and analytics
00:30
HD
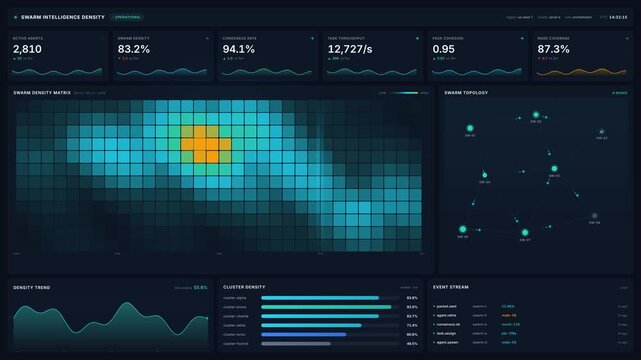
Futuristic swarm intelligence density heatmap dashboard with live analytics, cluster tracking, water meter anomaly radar, for real time data monitoring oversight
00:20
HD
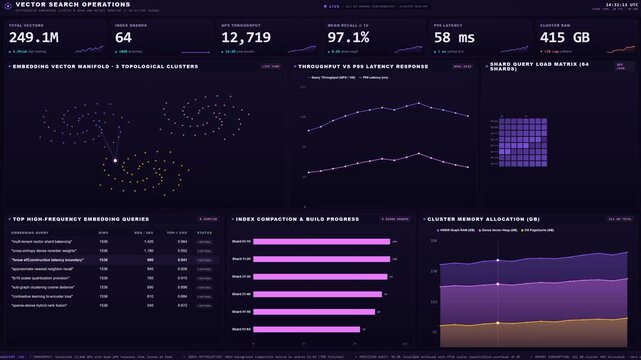
Advanced vector search operations dashboard displaying real-time database queries and cluster memory allocation metrics
00:15
HD
Glowing four quadrant strategic decision chart highlighting cluster in high impact winner corner, dark background
00:08
HD
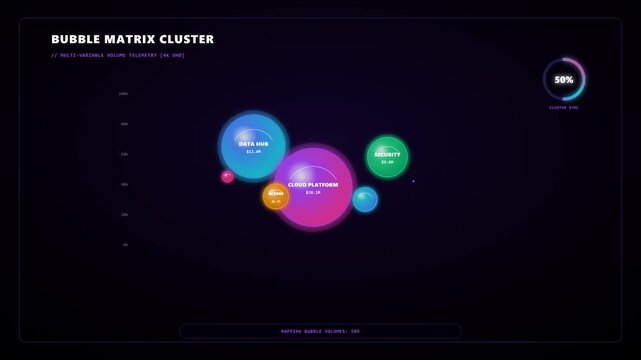
Futuristic Bubble Matrix Cluster HUD Data Visualization Dashboard Showing Cloud Platform Data Hub and Security Metrics with Loading Progress Percentage for Science and High Tech Concepts
00:10
HD
High frequency algorithmic trading UI with quantitative execution matrix displaying green candlestick charts and automated auto buy server cluster nodes
00:59
HD
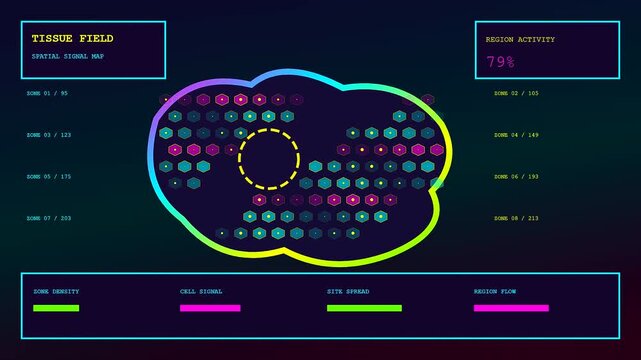
A digital bioinformatics interface displays biological signal tracking across three side by side panels showing shifting cluster patterns and light intensity metrics in a dark aesthetic environment
00:06
HD
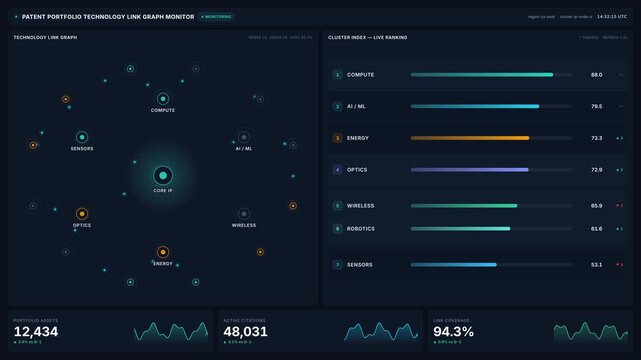
Patent portfolio link graph dashboard with glowing network nodes core ip connections, for data analytics, innovation tracking, live cluster ranking
00:20
HD
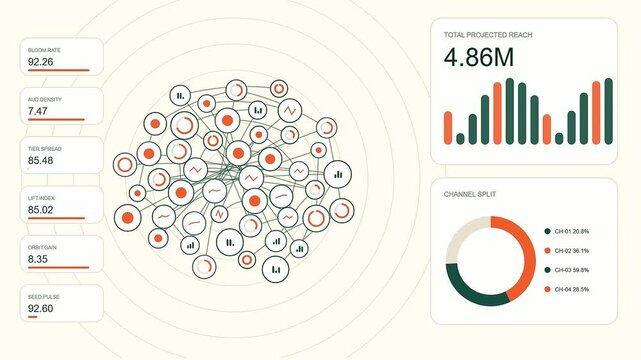
A reach projection interface displays complex network clusters with circular nodes and data visualization charts set against a light beige background for modern analytical dashboard screens
00:06
HD
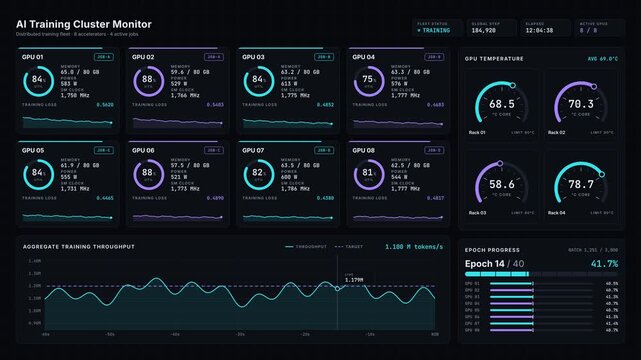
AI training cluster monitor dashboard showing GPU performance metrics
00:15
HD
Rotating Part 3 video of Orion constellation star chart mapping, detailing boundaries, connecting lines, and neighbouring deep-sky objects like the Orion Nebula against a dense starfield background.
00:19
HD
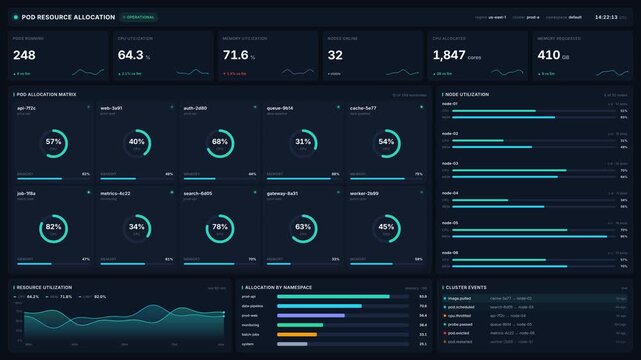
Kubernetes pod resource allocation dashboard for live cpu memory metrics, node utilization, cluster events, for cloud infrastructure monitoring
00:20
HD
Isometric 3D monochrome bar chart cluster in white slate gray and dark charcoal on a deep black background
00:10
HD
Black abstract dot cluster pattern icon representing molecular data node network connection scatter plot grid system UI graphic element isolated clean bright white background vector.4 k video.
00:10
HD
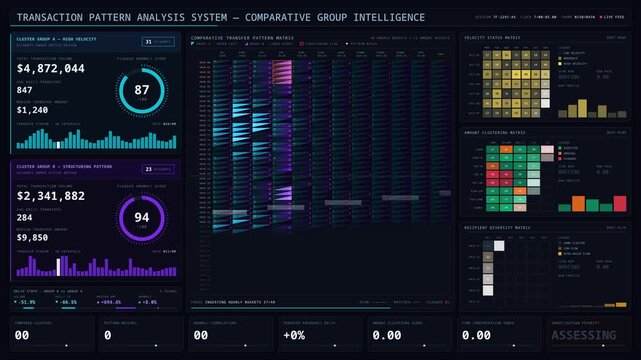
4K animated transaction analysis dashboard comparing transfer patterns across suspected account groups with heatmaps and status matrices on dark background.
00:15
HD
Diverse female team leaning, pointing at laptop at work, reviewing chart after colleague smiling
00:10
HD
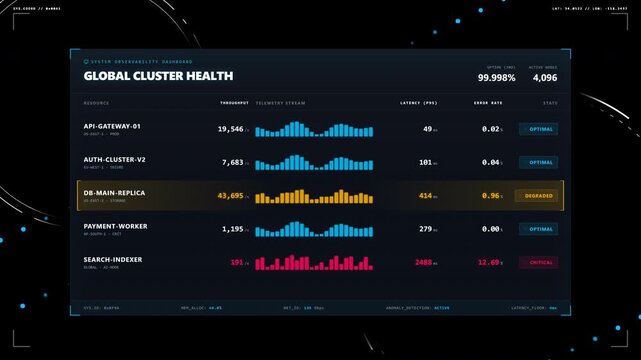
Futuristic observability dashboard HUD overlay featuring looping telemetry sparklines cluster health metrics and latency data for devops network monitoring and digital technology video backgrounds
00:10
HD
Red shaded data region meets cyan signal clusters
00:10
HD
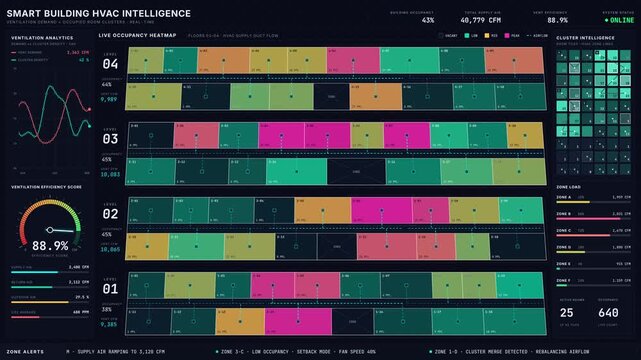
Smart building HVAC dashboard animation comparing ventilation demand curves with occupied room clusters and animated occupancy heatmaps on dark background.
00:15
HD
Spanish flag waving triggers waveforms growing into candlestick charts showing market shifts
00:14
HD
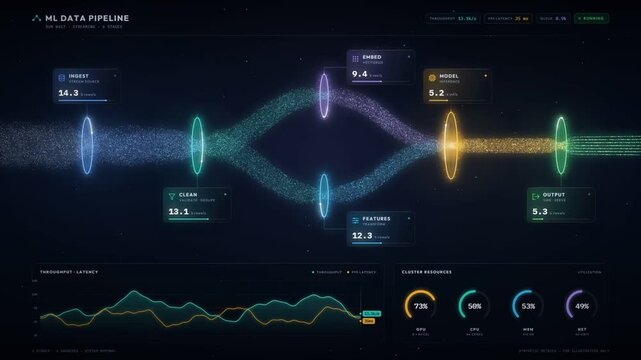
Data pipeline visualization with particle stream flowing through machine learning stages
00:20
HD
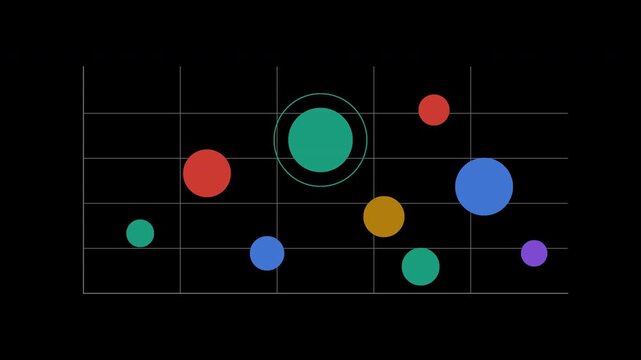
Animated bubble chart with varied bubble sizes with alpha channel
00:10
HD
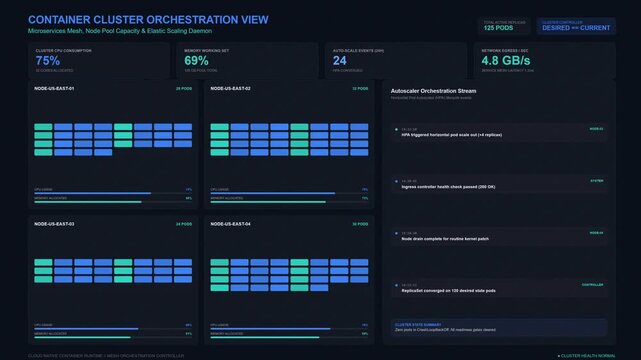
Container Cluster Orchestration View Loop Animation
00:15
HD
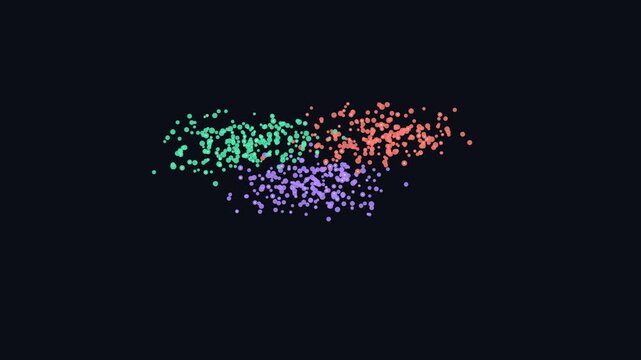
Abstract clusters of colorful dots on dark background
00:15
HD
A team of professionals engages in a collaborative meeting to discuss business strategy and project planning using a large paper chart and digital devices. Raster
00:13
HD
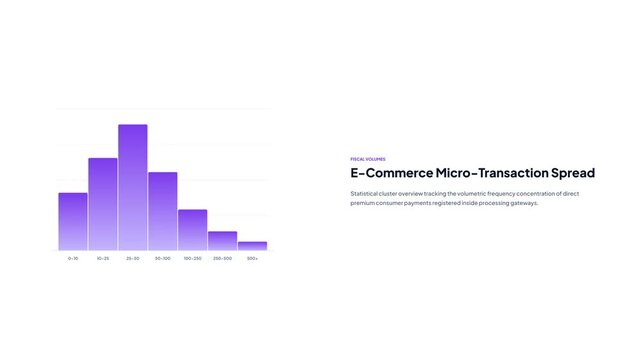
E-commerce micro-transaction spread histogram chart vector animation with data visualization text
00:06
HD
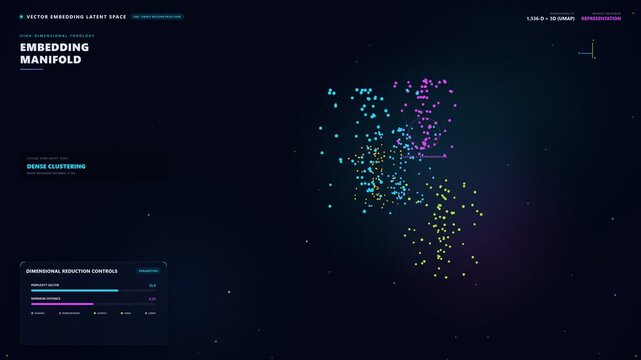
Vector embedding space 3D cluster explorer with colorful point cloud orbit, neighbor highlight and sliders, seamless loop
00:20
HD
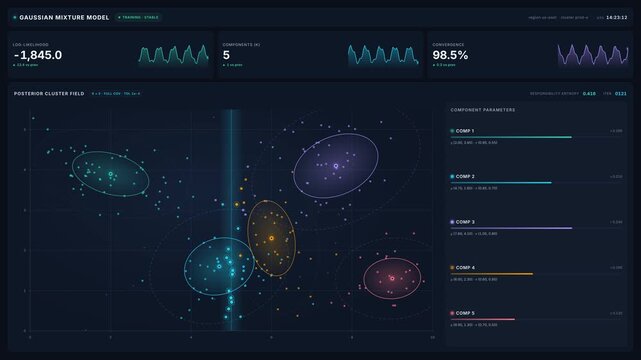
Gaussian mixture model dashboard with scatter plot posterior cluster field five data clusters, for machine learning, data science, artificial intelligence
00:20
HD
Stock marker position comparison bar clustered infographic element animation. Business plan. Animated chart graph. Dynamic data visualization on white background. HD video, motion graphics
00:09
HD
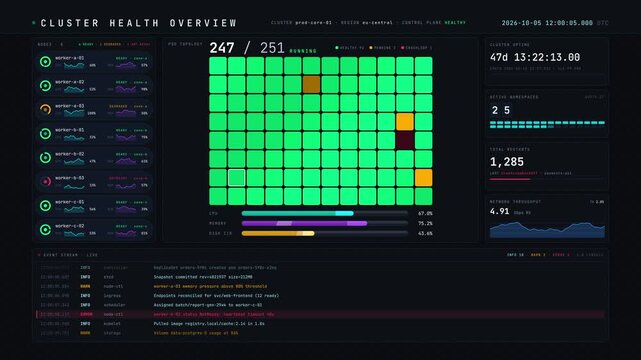
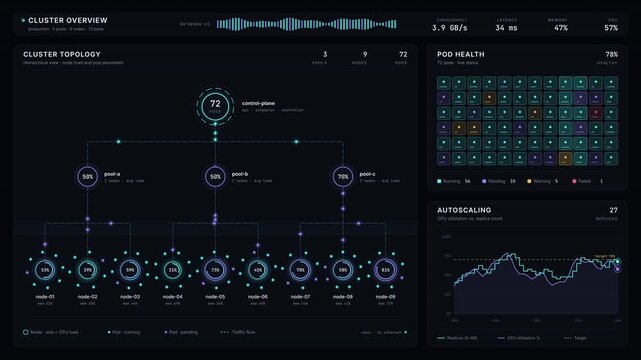
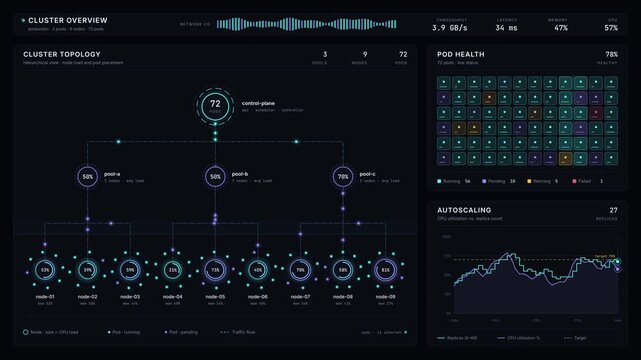
Kubernetes cluster overview dashboard showing node topology and pod health metrics interface
00:15
HD
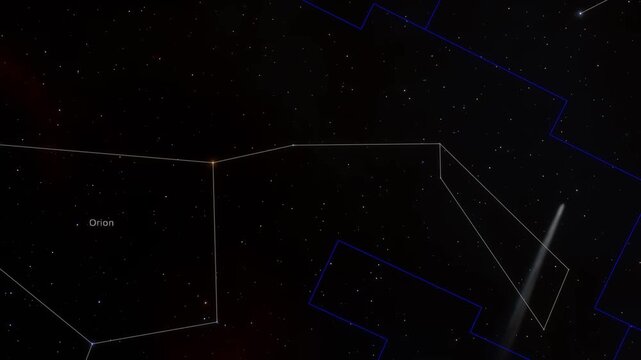
Rotating part 2 video of Orion constellation star chart mapping, detailing boundaries, connecting lines, and neighbouring deep-sky objects like the Orion Nebula against a dense starfield background.
00:20
HD
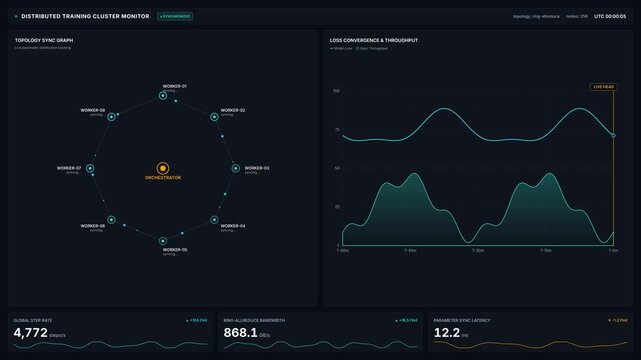
Distributed training cluster monitor for worker nodes synchronization system metrics, for artificial intelligence, machine learning performance, cloud computing, big data processing
00:20
HD
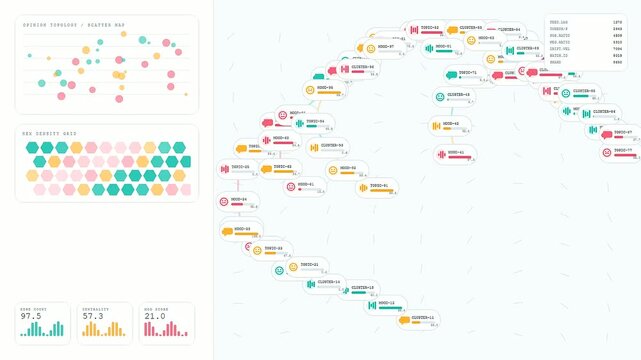
A digital sentiment analysis dashboard displays shifting network patterns as nodes connect and organize within a glowing interface showing evolving clusters of data and information flows
00:06
HD
High-impact 4K flat vector commercial animation of a big data analytics cylindrical database server cluster with dynamic rising 3D bar chart graphs, l.
00:10
HD
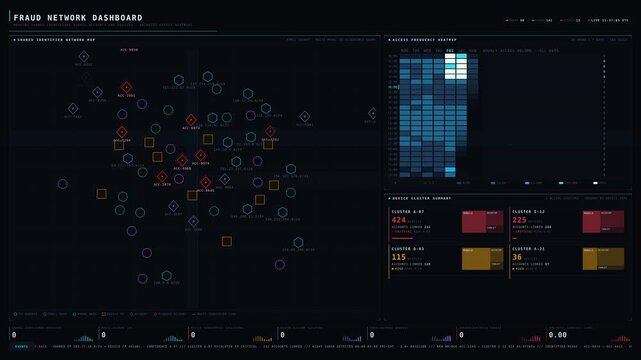
Cyber threat intelligence dashboard visualizing fraud network map with animated access heatmaps and device clusters on dark blue background for commercial creative technology and business use.
00:15
HD
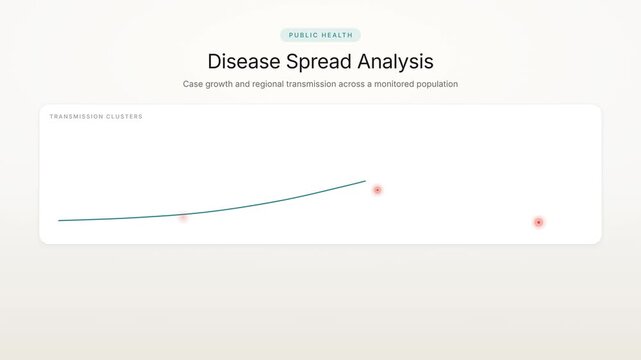
Public health disease spread dashboard with case growth chart
00:15
HD
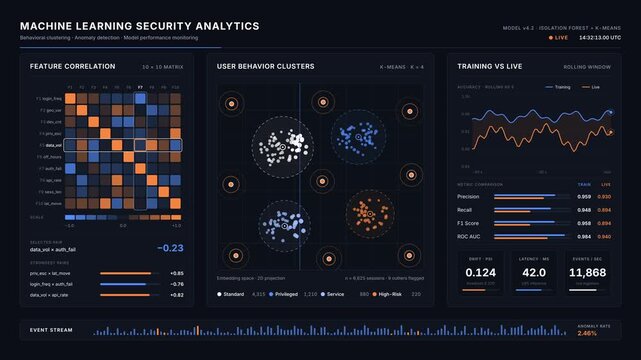
Machine learning security analytics dashboard with user behavior
00:15
HD
Data cluster analysis bubble chart with colorful circles on dark
00:10
HD
Illuminated display close view with magnified pixel grid and red green vertical bars forming compact chart detail, with display, pixel, subpixel, grid detail, showing matrix, screen, monitor
00:05
HD
Data overlays appearing above needles syringe cluster anchoring concept numeric charts shifting
00:12
HD
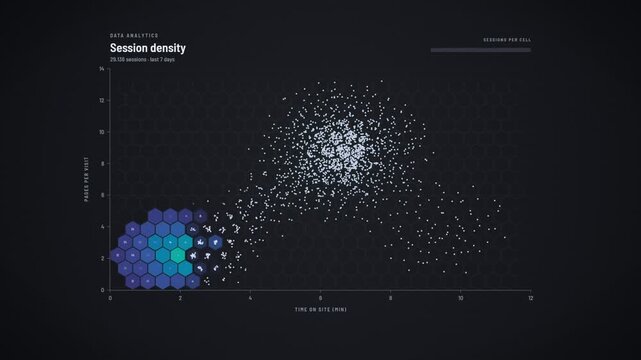
Hexbin heatmap chart forms from scatter plot points as magnifier finds hotspot of website session density
00:12
HD
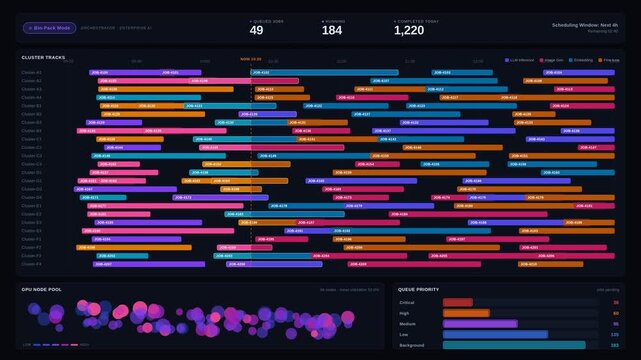
A sleek dark-mode GPU scheduling dashboard displays compute resources across enterprise AI workloads with animated counters and a Gantt chart for effective resource management.
00:15
HD
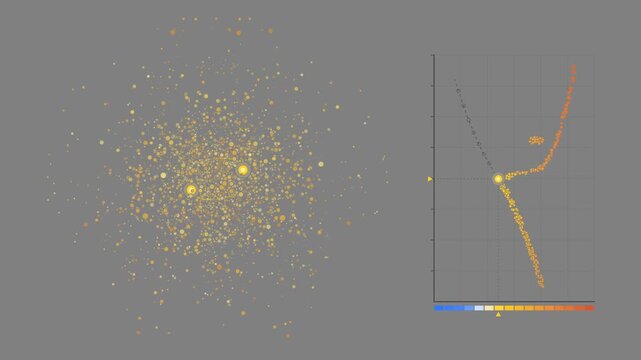
Blue stragglers created in a packed star cluster core
00:15
HD
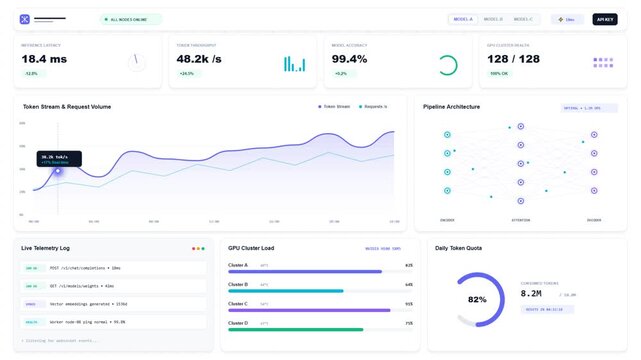
Futuristic clean white Bento Grid dashboard animation for AI SaaS, neural network monitoring, GPU cluster health, and cloud telemetry. Seamless 7-second 60fps loop.
00:07
HD
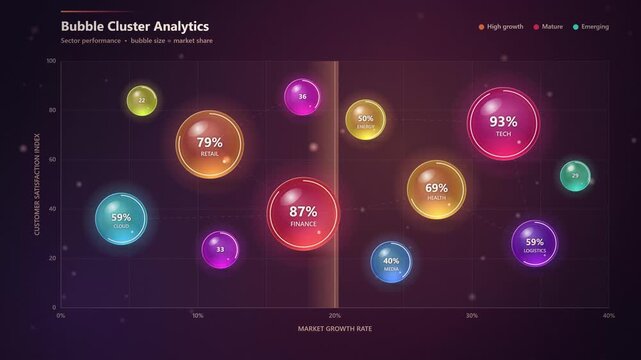
Glowing bubble cluster analytics dashboard displaying market growth
00:10
HD
Animated horizontal stacked bar chart showing cloud infrastructure cluster resource allocation data
00:06
HD
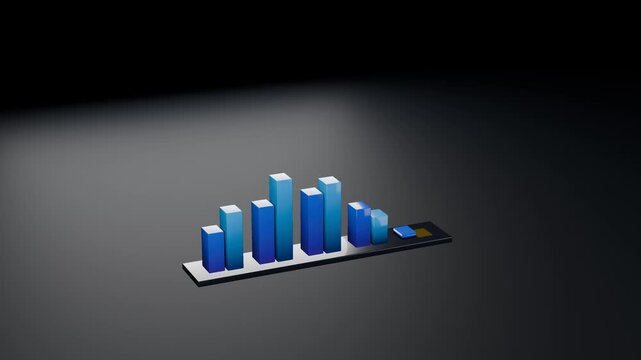
3D animation of a rising grouped bar chart with five pairs of blue columns and a tall golden final bar on a dark spotlight background, symbolizing data comparison, record profit, and business growth.
00:15
HD
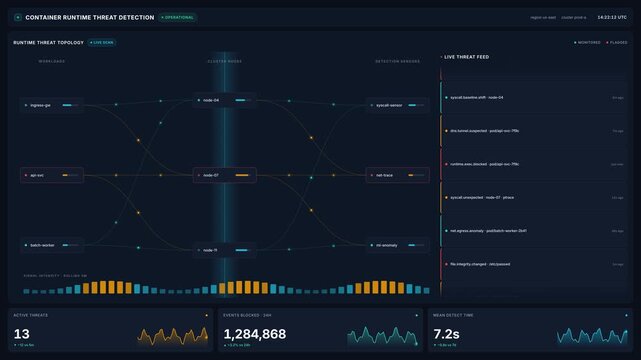
Container runtime threat detection dashboard for kubernetes cluster security topology, live threat feed, blocked events, mean detect time for cloud security monitoring
00:20
HD
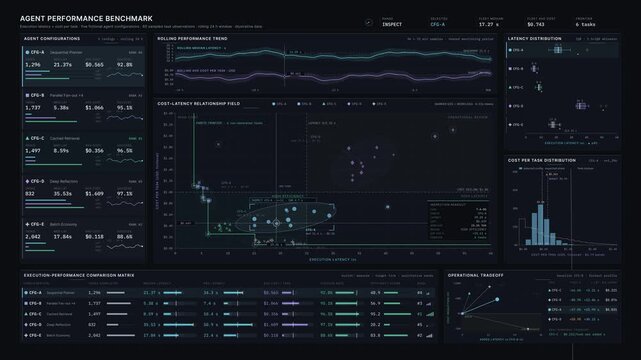
UHD animated agent performance dashboard comparing execution latency and cost per task with statistical charts and efficiency metrics for enterprise AI analytics.
00:15
HD
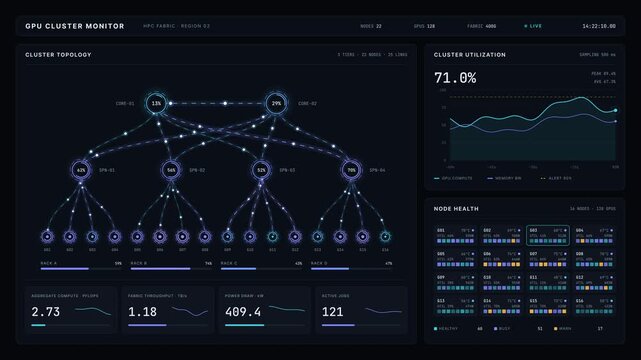
GPU cluster monitor dashboard showing network topology and real time server performance metrics
00:15
HD
A dense cluster of vertical blue light lines shoots upward in a smooth motion. Modern technological motion graphics display active quantitative metrics.
00:20
HD
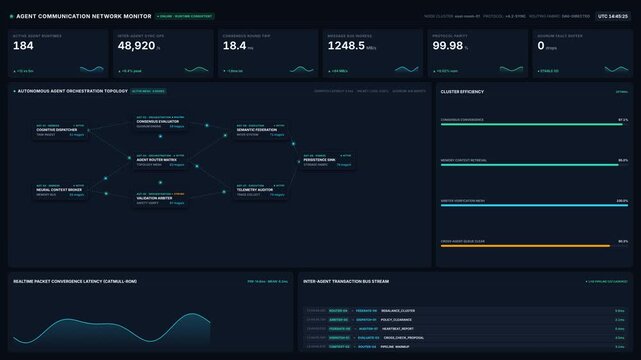
Agent communication network monitor dashboard with real time node cluster metrics data packet stream, for advanced artificial intelligence workflow management systems modern technology
00:20
HD
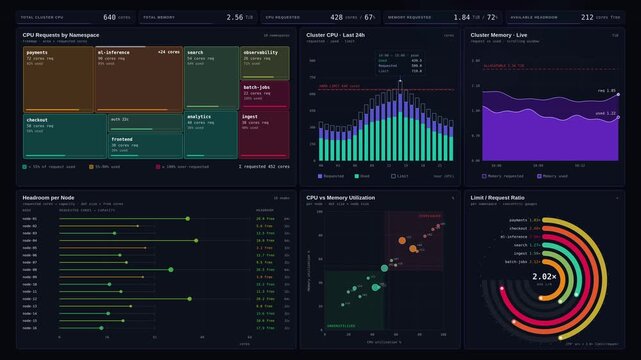
Premium 4K dark mode cluster capacity dashboard animation visualizing CPU memory requests limits and headroom with animated data charts and KPI counters on indigo background.
00:15
HD
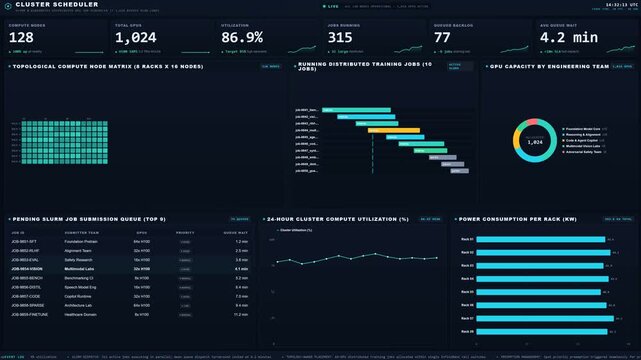
Advanced cluster scheduler dashboard displaying real time metrics and active computing nodes telemetry data
00:15
HD
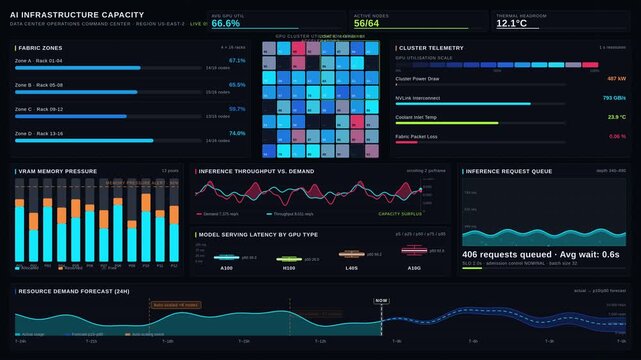
4K animated AI infrastructure dashboard showing GPU cluster utilization grid, VRAM memory pressure, inference queue, throughput chart, and 24-hour demand forecast with neon cyan and dark tech.
00:15
HD
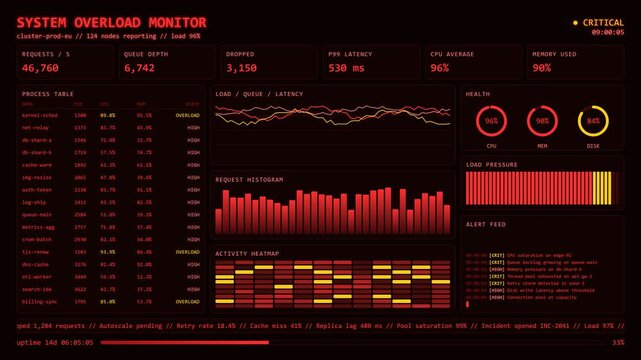
Red System Overload Monitor Cluster Process Table Alert Feed Dashboard.
00:15
HD
Sharp focus on central processing unit within autonomous trading cluster featuring highfrequency trading indicators with peripheral servers and wires fading into bokeh.
00:05
HD
AI compute cluster telemetry dashboard showing gpu utilization metrics and
00:10
HD
Market depth chart used in cryptocurrency trading
00:14
HD
Thin lines tracing curved paths starting central brain shape linking charts showing data growth
00:12
HD
Data center cluster topology dashboard monitoring server compute load and power usage
00:12
HD
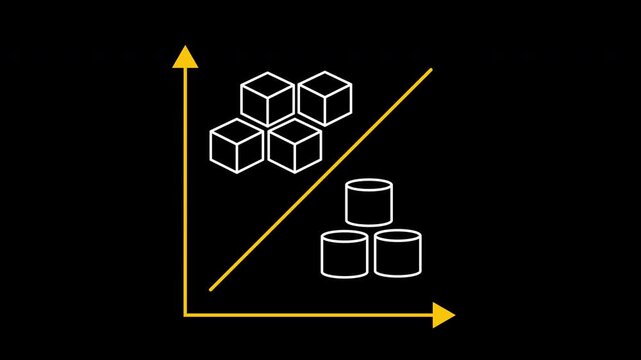
Data cluster analysis icon animation on transparent background showing minimal line scatter plot chart and blocks with trim paths in and out. Statistical machine learning and grouping concept idea.
00:10
HD
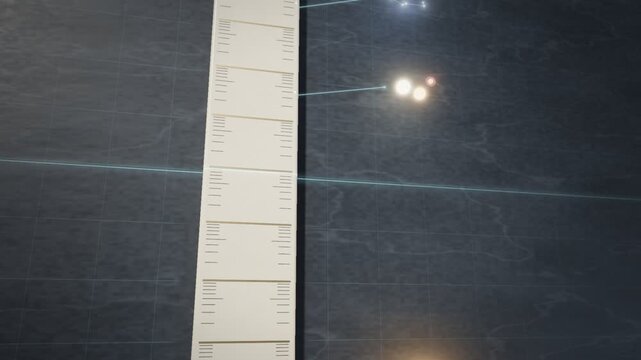
On dark slate an ivory ruler strip scrolls past the Sun nearby stars galaxies clusters and quasars to the microwave background showing how a logarithmic scale fits the whole universe on one chart
00:15
HD
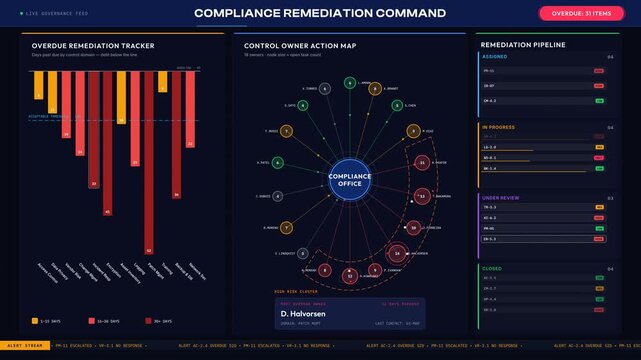
Compliance remediation command dashboard tracking overdue items, control owner actions, and risk clusters in premium animated blue interface for commercial creative technology and business use.
00:15
HD
Blue neon bubble cluster network infographic coming to life background
00:15
HD
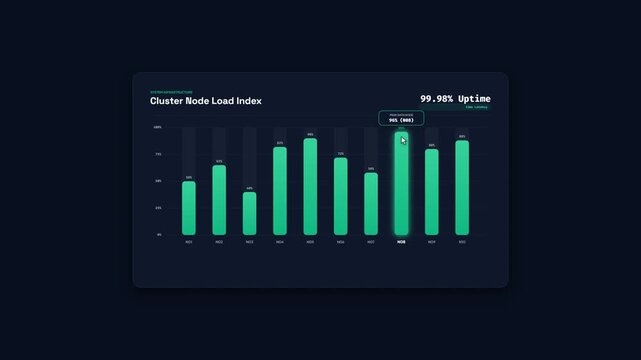
Cluster Node Load Index Animated Bar Chart UI Dashboard Metric Monitor Motion Graphics 4K
00:08
HD
Data, charts and bar graphs.
00:30
HD
graph 13
00:06
HD
A cluster of white representing business concepts such as percentage, dollar sign, documents, airplane, target, growth chart, IT, gear, location pin, bell, user, lock, and list arranged on a dark
00:10
HD
Cloud kubernetes monitoring dashboard showing cluster topology and pod health metrics interface
00:15
HD
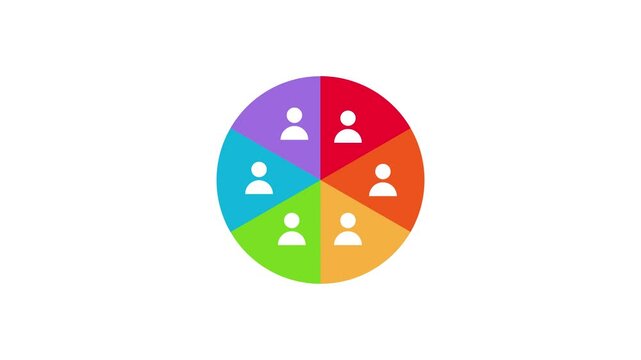
Demographics and Segmentation Motion Graphic
00:12
HD
A fruity themed sticker cluster with cheeky caption.
00:02
HD
Abstract background of brightly colored heat map representing large scale genomic data
00:05
HD
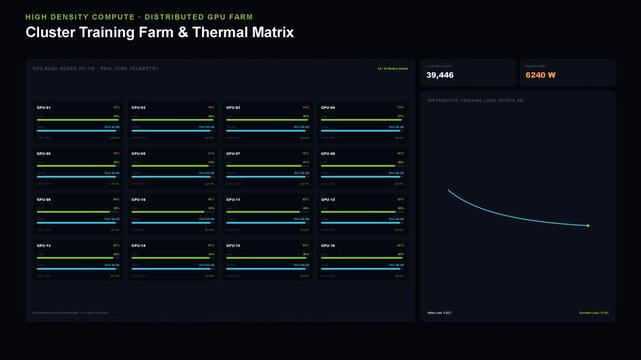
GPU Cluster Training Farm Loop Animation
00:15
HD
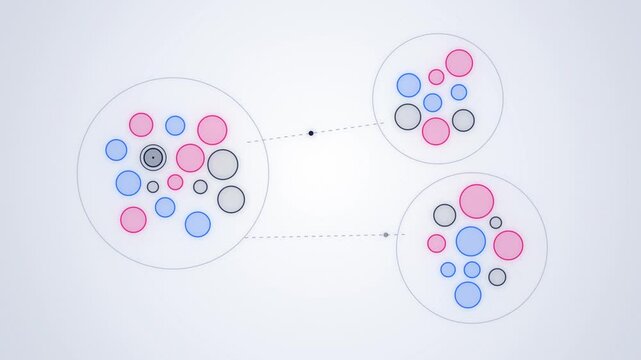
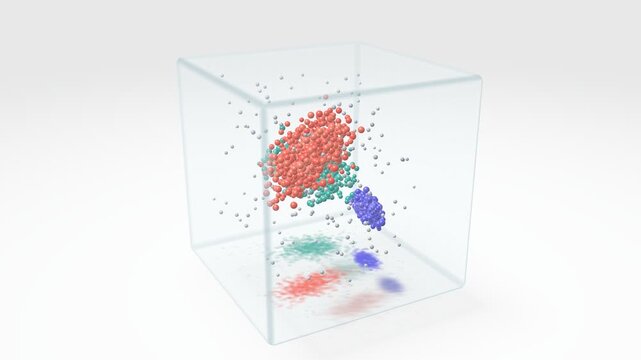
Inside a rotating glass cube on a white set coral teal and indigo points drift together and apart as a seamless loop showing how cluster analysis groups similar records in three dimensions
00:15
HD
Big data clustering on white background, 3D animation for data science
00:20
HD