A link to set your password has been sent to: To access your purchases in the future you will need a password.
Create without limits — unlimited downloads, plus powerful AI editing
New filters added
Sort by

73,789 results for chart overlay in videos

Dark blue corporate business growth chart 2026 to 2027 financial success animation motion graphics overlay
00:12
HD
Org Chart Hierarchy Tree Diagram Growing From Root With Nodes Lighting In Sequence, Seamless Loop in bright emerald tones
00:10
HD
A business professional conducts in-depth financial analysis on a laptop, with a digital growth chart overlay emphasizing rising trends and potential market success. Copula
00:10
HD
Neon glowing bar chart with rising line overlay stylized retro futuristic data visualization animation
00:13
HD
Financial chart overlays power plant and oil refinery, symbolizing global energy economic growth. Represent rising market prices, increased production and demand for petroleum and power generation.
00:18
HD
Agentic ai multi agent collaboration workflow diagram with data input process analysis and auto optimize concept for future technology modern office
00:08
HD
Smart city skyline of Chicago showing futuristic financial data, stock market infographics, business analytics, big data visualization over urban landscape
00:06
HD
Glowing blue bar graph ascending with line chart overlay during dark digital night with bokeh lights
00:05
HD
Futuristic HUD line chart with a sweeping scanner beam, grid ticks and glowing data points on pure black, seamless 10 second 4K overlay loop for dashboards and sci-fi interfaces.
00:10
HD
Top Down View of Corporate Team Working Around Conference Table With Laptops and Documents as Linked Visualization Layer Appears, Glowing Ai Icons Represent Cloud Storage, Cybersecurity and Analytics.
00:12
HD
A sophisticated digital interface displays a dynamic broadcast data overlay showing real time financial market fluctuations with glowing blue line graphs and professional statistical trading metrics
00:06
HD
Animated financial bar chart with rising trend line arrow showing business growth, market success, profit increase, and positive economic performance on a clean minimalist black background overlay
00:06
HD
Business person using a laptop and touching a digital holographic chart overlay at a desk, Business data analysis finance planning and modern office work
00:09
HD
Financial growth bar chart animation with rising trend line and digital data overlay for business success and market analysis
00:10
HD
ECG monitor beating heart with a neon electrocardiogram overlay, featuring dynamic HUD elements.Abstract neon heartbeat signal icon animation on black background.
00:10
HD
Pink bar chart with line graph overlay showing financial data on black background
00:15
HD
Woman shifting folder scanning docs while man pointing chart highlighting business data review
00:11
HD
Animated glowing trend line chart overlay loop on black
00:15
HD
Animated 3d bar graph chart showing fluctuating financial data with line graph overlay on a dark background motion graphics clip.
00:15
HD
Animated holographic bar chart HUD overlay on black background
00:12
HD
Financial charts and data analysis graphics motion overlay on blue background. Business and Economy Related Abstract 3D Concept.
00:16
HD
dynamic graph chart line rising on green screen
00:29
HD
Hands typing on laptop with data charts and security icons overlay showing analysis, statistics, and technology insights in a dark modern workspace Gluon.
00:10
HD
Neon glowing bar chart with rising line overlay stylized retro futuristic data visualization animation
00:13
HD
Isolated cortisol stress level gauge animation with smooth needle sweep on solid white background motion overlay
00:10
HD
finance progress bar plotted line showing companies growth.on black backround. Dynamic financial growth bar chart animation with rising trend arrow overlay
00:10
HD
Stock market candlestick chart hologram on digital world map,global financial index analysis,business economy investment.Global market analysis world map with stock market graph overlay animation
00:24
HD
Animated business growth bar chart with roi data overlay financial performance and market analysis concept
00:10
HD
Businessman touching on hologram digital dashboard overlay showing graph charts, map and growth data animation, Holographic modern business analytics, finance planning and market performance
00:10
HD
Top Down View of Office With Multiethnic Employees Working at Computer Desks as Linked Visualization Layer Appears, Glowing Blue Lines and Ai Icons Represent Machine Learning, Analytics and Security.
00:09
HD
Dynamic rising green graph with upward arrow over backdrop of towering skyscrapers, clear sky. Symbolizes real estate investment growth, increasing property value and strong market performance.

00:12
HD
Blue HUD code interface background circular scanner rings, data numbers, percentage labels, analytics depth. finance software demos, trading screens, AI intros, business reports, digital overlays.

00:20
HD
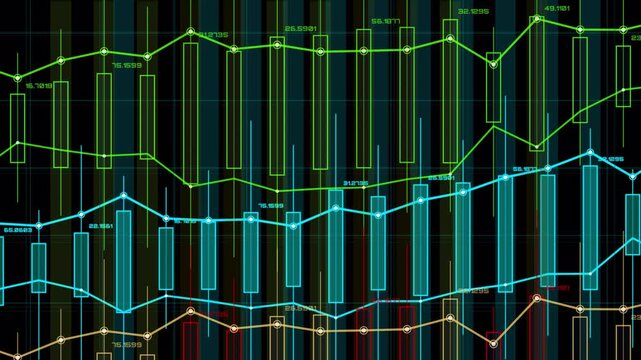
Futuristic digital stock market financial graph data visualization motion graphics animated glowing blue line chart with bar graph histogram for business analytics overlay dark background
00:10
HD
Animation of a financial chart daily profit line overlay on a black background. Trading dashboard UI element, stock market investment and revenue growth business concept.
00:11
HD
Growing graph chart animated Saving rates moving up and down. Chart with rising saving rates. Banking, interest rates, savings.4k motion graphics animation video.
00:10
HD
Vintage silent movie caption cards. Set of vintage silent movie frame caption cards with old film effects and scratches. 5 sets vintage ornate frame styles. 4k video
00:50
HD
Blue neon handshake icon with bar graph and data chart overlay symbolizing business growth
00:08
HD
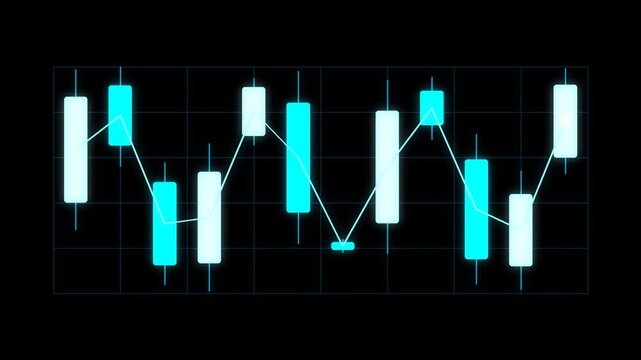
Animated candlestick trading chart overlay loop on black
00:15
HD
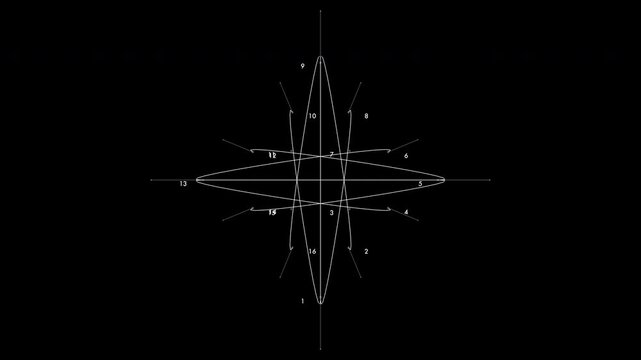
An evolving geometric chart mapping math vectors and numeric intersections along coordinate lines. Tailored for software developer backgrounds and sci-fi movies.
00:20
HD
Digital stock market candlestick chart with glowing neon lines showing financial data analysis on a overlay background for business and investment
00:07
HD
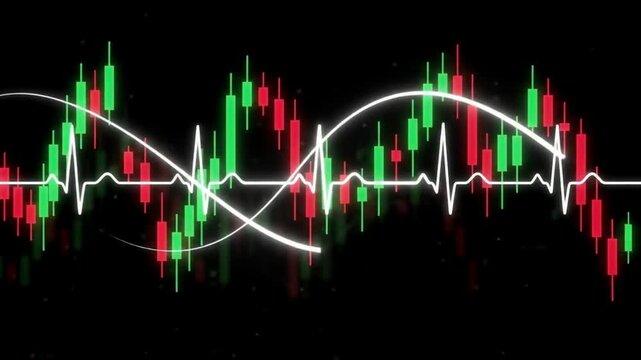
Financial stock market candlestick chart with a glowing heartbeat line overlay representing market volatility
00:10
HD
Stock chart overlay graphics candlestick and table stock price, digital world map, line arrow up trend, global business financial trading exchange index indicator
00:19
HD
Close-up of hands typing on a keyboard with a digital graph overlay showing upward trends, symbolizing business growth and the influence of technology in data analysis. Copula
00:10
HD
Financial stock market candlestick chart overlay on modern city business district skyline
00:10
HD
Dynamic white bar chart graph animation with rising line trend overlay on a clean black background, for financial data, visualization, business growth, analysis, and corporate, performance reporting
00:05
HD
finance progress bar plotted line showing companies growth.on white backround. Dynamic financial growth bar chart animation with rising trend arrow overlay
00:10
HD
Bar chart growth progression with line graph overlay in clean studio lighting for financial data analysis
00:05
HD
Neon-style glowing bar chart on black background with axes and three trend arrows overlay animation
00:05
HD
Stock market candlestick chart hologram on digital world map,global financial index analysis,business economy investment.Global market analysis world map with stock market graph overlay animation
00:15
HD
Top Down View of Diverse Business Team Gathered Around Meeting Table With Laptops and Statistical Reports. Visualization Icons Represent Connectivity, Cloud Security. Action Zoom out camera.
00:07
HD
Aerial night view of industrial facility oil refinery storage tanks and processing infrastructure. Upward-trending financial graph overlays scene, symbolizing industry growth and rising petrol prices.

00:18
HD
Digital financial bar chart with rising growth trend and data analytics overlay business
00:15
HD
Dynamic financial growth bar chart animation with rising trend arrow overlay on a dark blue grid background, representing business success, market analysis, economic progress, and data visualization
00:10
HD
Red ui chart widget element, a bar chart growing from the baseline with a trend line drawing across it, light theme, no text no numbers, black background overlay
00:05
HD
Center woman placing sticky note, team writing on clear glass for planning, green chart overlaying
00:15
HD
Rising bar chart columns transition on green screen, colorful flat shapes cover the frame then reveal, chroma key overlay
00:05
HD
 icon swipe up animation black background. UP Directional Arrow Loop Animation. Animated arrows for the overlay video layer.
00:10
HD
Aerial drift over the Manhattan skyline at sunset: glass towers under a pink sky, stock market overlay with an animated red and blue bar chart climbing. Concept visualization
00:12
HD
Animation of a glowing financial bar chart overlay on a black background. Digital trading dashboard UI element, stock market revenue and business growth concept.
00:10
HD
rad bar chart graph rising up animation for video overlay, financial success and statistics motion graphic
00:12
HD
Business bar chart and trend line analysis dashboard graphic digital analytics interface showing a with an overlay for tracking financial or growth performance graph data finance growth performance
00:10
HD
Colorful line charts scrolling on dark monitor screen, shot at angle with depth of field blur and noise. Cinematic and atmospheric, suitable for finance and tech content.
00:10
HD
A business professional focuses on analyzing financial data on a tablet, showcasing a digital growth chart overlay symbolizing success and corporate progress. Copula
00:10
HD
Green screen audio visualizer background, podcast audio frequency signal meter, music equalizer rhythm bars overlay effect 4k video, white sound wave spectrum chroma key animation.
00:20
HD
ECG monitor beating heart with a neon electrocardiogram overlay, featuring dynamic HUD elements and a gradient background.Abstract neon heartbeat signal icon animation black background .
00:10
HD
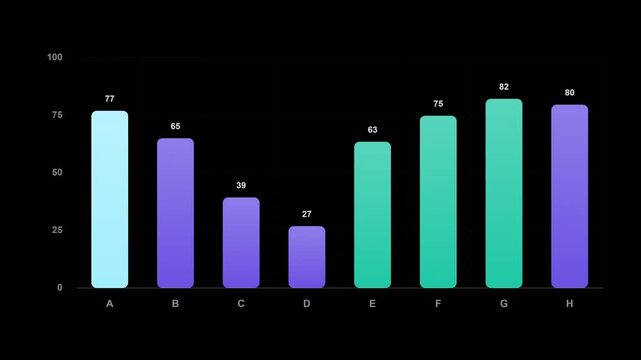
Animated bar chart overlay with eight gradient bars in aurora teal and purple on pure black background, data visualization for presentations and screen blend mode
00:10
HD
Candlestick chart overlay and trading graph displaying stock market price movement on dark digital monitor screen, financial data analysis investment, trend indicator forecast
00:20
HD
Neon-style glowing bar chart on black background with axes and three trend arrows overlay animation
00:05
HD
Digital financial growth chart with animated data lines and analytics hud overlay stock market
00:15
HD
Top Down View of Business Professionals Collaborating Around Office Table With Laptops and Charts as Linked Visualization Layer Appears, Glowing Blue AI Icons Represent Data Analytics and Security.
00:13
HD
Industrial business concept with rising financial graph overlaying oil refinery plant at night. Symbolize increasing oil prices, refinery operating costs and growth in global power and energy sector.
00:18
HD
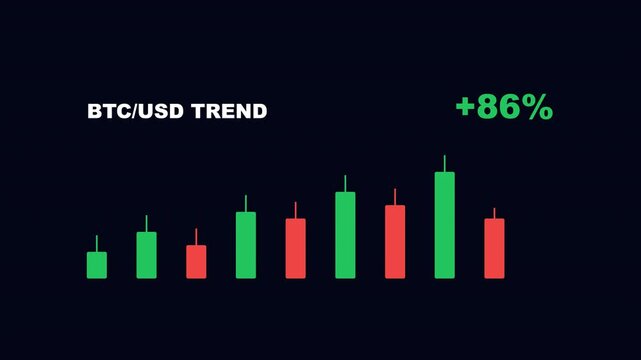
Cryptocurrency candlestick trading chart with positive trend counter overlay
00:07
HD
Gold bars stacking up into a pyramid with financial chart and reserve data overlay
00:15
HD
Blue ui chart widget element, a bar chart growing from the baseline with a trend line drawing across it, light theme, no text no numbers, black background overlay
00:05
HD
Animated 3 d bar chart with fluctuating data trends and digital analytics overlay for business growth and financial market analysis
00:10
HD
Animated vintage silent movie caption card with old film frame, dust, scratches, and flicker effects.
00:20
HD
Digital audio waveform spectrum, white sound frequency pulse visualization, sound line audio wave visualization voice record animation on green screen, music equalizer rhythm bars overlay effect.4k
00:30
HD
Glowing blue neon upward trend arrow chart animation on black background, for financial growth, and success
00:10
HD
Team meeting around desk, seated man tapping laptop causing animated charts showing business growth
00:12
HD
Financial candlestick stock chart trading graph overlay seamless loop alpha channel 4K
00:10
HD
Double exposure footage of hands typing on laptop with animated financial chart and data overlay, business analysis concept
00:16
HD
Animated market depth and volume bar chart rising and falling with glowing neon edges on pure black, seamless 10 second 4K overlay loop for trading and business presentations.
00:10
HD
A high-tech digital interface displaying an annual revenue chart with a rising trend line, bar graphs, and a sales growth report overlay on a dark blue background, representing financial success and d
00:05
HD
Green screen audio visualizer background, podcast audio frequency signal meter, music equalizer rhythm bars overlay effect, white audio waveform spectrum chroma key moving animation 4k.
00:30
HD
Animated bar chart with trend line without text on transparent background, 4K infographic overlay with alpha channel
00:10
HD
finance progress bar plotted line showing companies growth.on black backround. Dynamic financial growth bar chart animation with rising trend arrow overlay
00:10
HD
Smart city network showing big data communication and financial charts in downtown Chicago with futuristic digital overlay and information graphics connecting buildings
00:11
HD
Neon-style glowing bar chart on black background with axes and three trend arrows overlay animation
00:05
HD
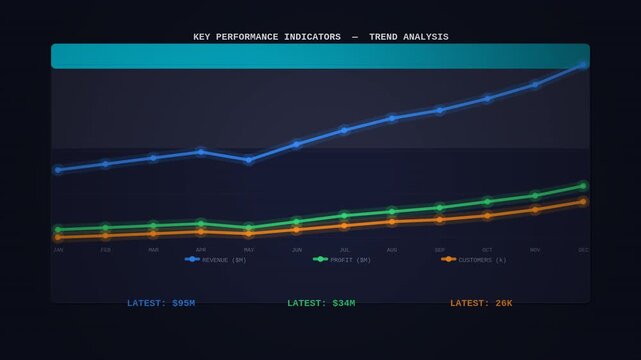
Business KPI line chart trend analysis animated overlay alpha
00:12
HD
Global biohazard alert dashboard animation featuring a world pathogen trace map and epidemic curve
00:30
HD
HUD line graph tracking data fluctuations and market trends, futuristic cyber technology overlay 4k video
00:10
HD
Colorful monthly bar chart infographic data overlay on transparent background
00:07
HD
Charts and Graphs components. Advanced Data Analytics Dashboard Displaying Numerical Metrics and Percentages. Business analysis, technical overlays
00:08
HD
Indigo ui chart widget element, a bar chart growing from the baseline with a trend line drawing across it, light theme, no text no numbers, black background overlay
00:05
HD
rule of thirds grid for framing and composition for film, video, photography and cinematography image making guide frame camera guide markings overlay 4K animation with alpha channel
01:00
HD
 Interface screen animation with stock exchange chart overlay.
00:18
HD
Oil barrels stacked high with a glowing stock chart overlay, offshore rigs silhouetted against a vibrant sunset
00:10
HD
Abstract background Video overlay Futuristic HUD Head up display interface template with basic geometry grid line element. Video template widescreen aspect ratio
00:20
HD
Grid overlay appearing, red and cyan lines sliding in charting data trends while globe rotating
00:12
HD
Global warming newspaper full of climate crisis articles - 3D render with live footage
00:11
HD