A link to set your password has been sent to: To access your purchases in the future you will need a password.
Create without limits — unlimited downloads, plus powerful AI editing
New filters added
Sort by

278 results for chart data simple user in videos

A dark mode histogram titled "User control Analysis" displays a distribution of data with various grey bars on a stark black background.
00:19
HD
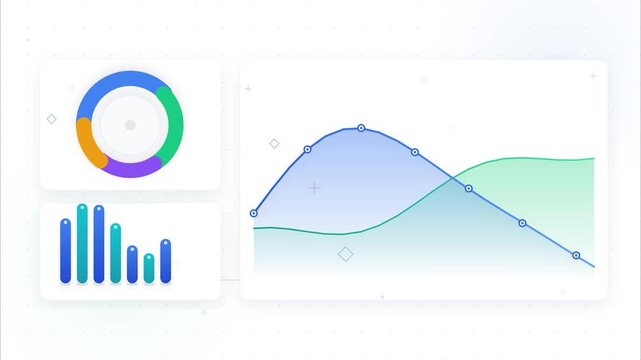
Data Visualization Dashboard Displaying Interactive Graphs and Analytics Interface in a Modern Digital Environment
00:08
HD
Animated Graphic Elements User Profile Heart Data Charts and Countdown Timer
00:05
HD
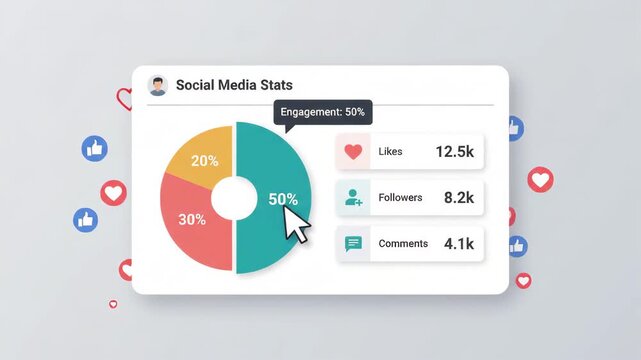
digital social media statistics dashboard displays colorful donut chart engagement data follower counts likes and comments on minimalist neutral light grey background interface design
00:06
HD
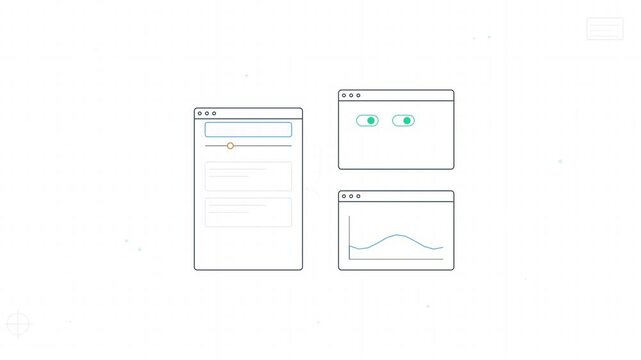
Minimalist digital user interface with search engine bar data analytics charts and system status dashboard on white grid
00:07
HD
Real-time data analytics dashboard displaying performance charts and user interface elements for business intelligence
00:10
HD
Abstract representation of a user interface card with colored bars and dots.
00:15
HD
Modern dashboard interface animation glows with green borders. Control room telemetry data updates on the dashboard interface. High tech user displays guide the dashboard interface.

00:08
HD
User profile connection dashboard with flat interface animation
00:05
HD
Graphical representation of ascending data bars showing a simple digital progress indicator for website user interface and mobile application design
00:10
HD
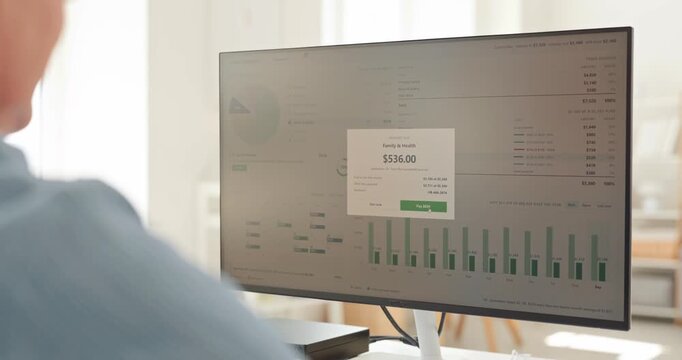
Man completes payment for household bill online. Footage shows a budget dashboard as payment confirmation appears, showing expense tracking. Household finance management made simple today.
00:09
HD
Minimalist Business Analytics Dashboard on Laptop Screen Silhouette Motion Graphic Element
00:08
HD
Animated icons representing data processing and analysis on a black background
00:07
HD
Software dashboard interface with data analytics and progress bars
00:10
HD
Business dashboard interface with data charts and timeline
00:15
HD
Computer screen ui wireframe icons with data dashboard elements
00:15
HD
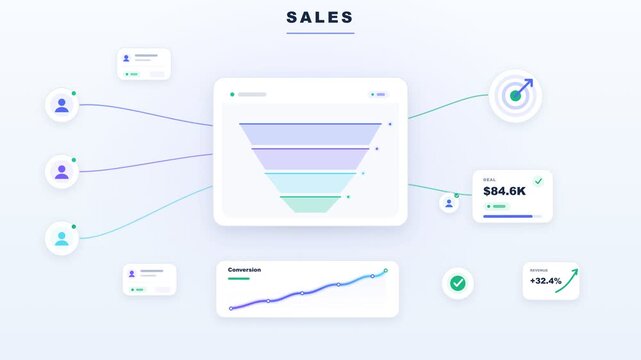
Sales Funnel Dashboard, Clean Motion Graphic Animation Showing User Conversion, Revenue Stats And Data Visuals, Minimalist White Interface Background, Professional Asset For Business Marketing Softwa
00:08
HD
Minimalist digital user interface dashboard with abstract data visualization graph and connected points on a clean white background. Modern web design and software analytics concept for technology.
00:10
HD
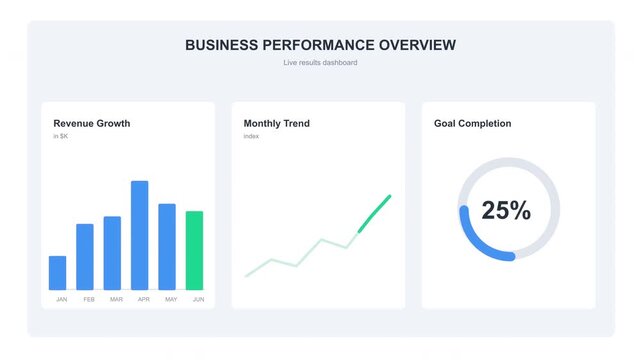
Business performance overview graphs charts data web page popup presentation
00:06
HD
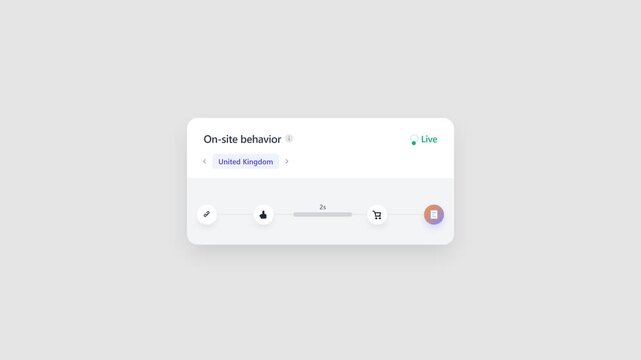
Dashboard interface menu showing user behavior analytics data panel with simple UI design
00:08
HD
Horizontal progress bar with colorful segmented sections for loading process, data measurement, step completion, workflow status, and graphic timeline elements on transparent background
00:05
HD
A red circle growing and displaying 45% then 50% on a white background, motion graphics for business presentations.
00:05
HD
Colorful business data visualization with charts graphs and world map for analytics and statistics
00:05
HD
tablet displays digital line graph tracking data fluctuations presented with clean user interface design against solid neutral gray background
00:06
HD
User interface data dashboard animation with line charts
00:05
HD
Simple upward pointing arrow icons set on black background
00:12
HD
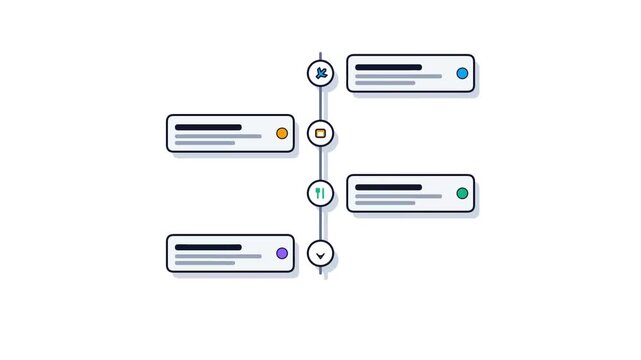
A visual representation of a timeline with connected information cards.
00:10
HD
Minimalist data analytics dashboard animation with business charts
00:10
HD
Colorful minimalist digital data dashboard interface with vibrant neon flat design elements and graphs
00:15
HD
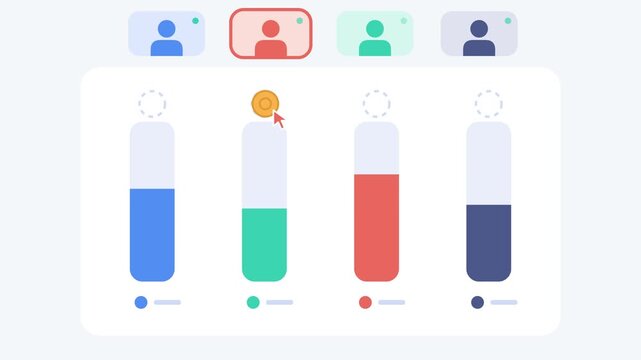
Team Productivity Dashboard Interface Showing Progress Bars Rising with User Profile Icons on White Background
00:10
HD
Minimalist user interface wireframe with moving data elements
00:15
HD
Neon green thermometer icon showing weather temperature level with red markings isolated on a black background for medical and climate science digital user interface design graphic elements.
00:10
HD
Animated icons show contrasting emotions and feedback levels on black background
00:06
HD
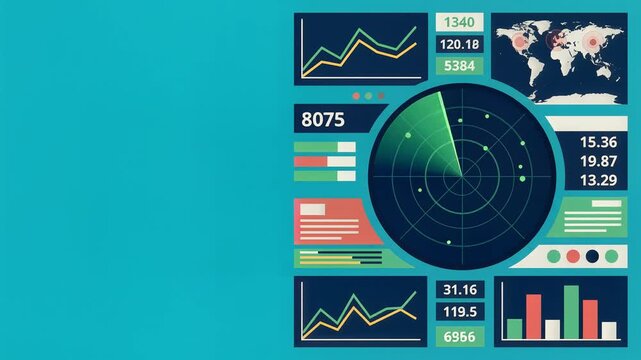
Digital Dashboard Interface with Radar Scan and Data Visualization Graphics
00:10
HD
Business analytics dashboard data charts modern minimalist flat ui design financial reporting information graphic interface
00:10
HD
Minimalist project management dashboard interface showing task lists
00:15
HD
 Financial Choice Concept, Business Decision and Modern Graphic 4k animation. Neon $720 vs $820 Price Comparison Animated with Glowing User Silhouettes, Dual Cost Display, Digital Pricing Analysis.
00:10
HD
Laptop screen displaying growth chart and user icon, simple line art.
00:08
HD
A person is using a tablet to view stock market charts. The screen shows various graph lines and bars in bright colors. The setting has a simple background.
00:11
HD
Collection of conceptual user interface elements including a color picker. Monitor with a successful interaction. And a web browser showing data visualization
00:17
HD
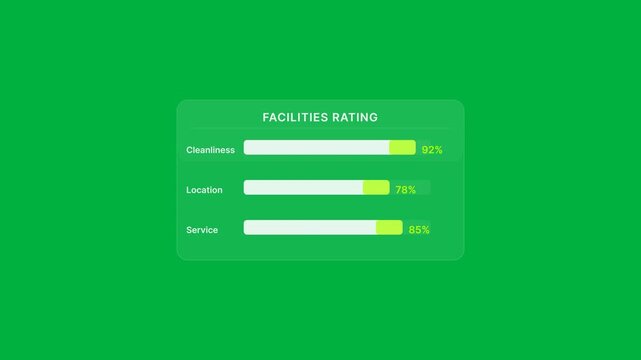
Facility rating interface showing progress bars for performance analytics and data evaluation
00:15
HD
A dark mode histogram titled "User control Analysis" displays a distribution of data with various grey bars on a stark black background.
00:05
HD
Business workflow vector illustration with user icon progress ring line graph and bar chart for data analysis and growth tracking
00:06
HD
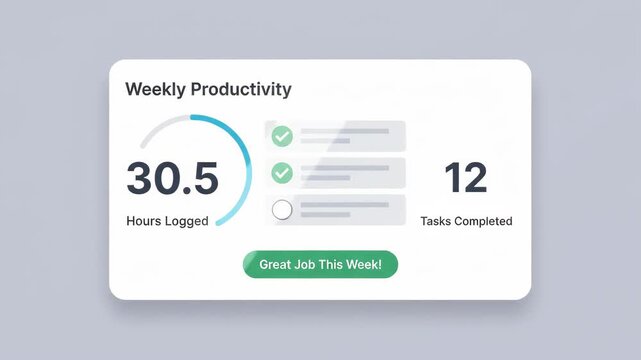
digital weekly productivity dashboard showing logged hours on sleek card UI interface floating against soft-focus minimal gray background visualizing progress through circular progress ring
00:06
HD
Minimalist colorful progress bars with various indicators on dark backdrop
00:10
HD
Pixelated interface screen displayed on tablet device, finger interacting with digital graph and data, technology concept.
00:06
HD
A web browser displaying a user interface with data, progress bars, and a green checkmark indicating completion.
00:10
HD
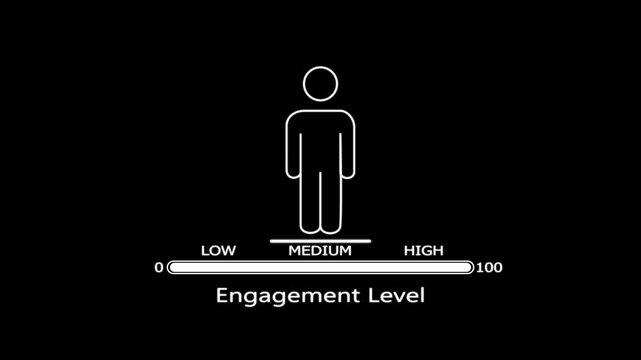
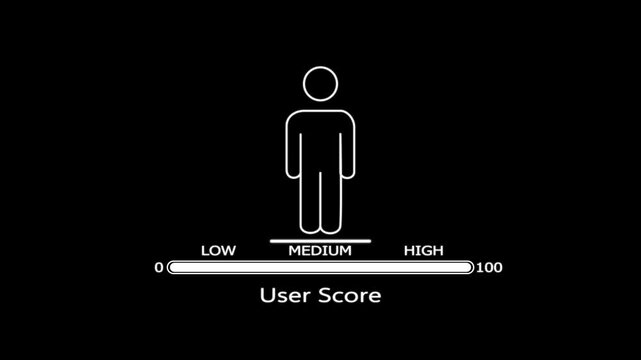
White line of a person standing above a medium engagement level progress bar on a black background
00:10
HD
Futuristic digital interface with hand selecting executive profile in corporate organizational chart
00:05
HD
Neon-lit graphic design on a laptop and smartphone against a dark background with colorful bars.
00:08
HD
Two groups of people icons representing different segments, data visualization
00:06
HD
Circle Loading animation from 0 to 100 with transparent background. Abstract circle frame loading icon animation, Modern User Interface Design Concept,
00:10
HD
Abstract graphic representation of people and data in a list format
00:07
HD
Data Dashboard User Interface Motion Graphics Animation Sequence
00:10
HD
Animated Business Data Dashboard Interface with Progress Bars and Circular Chart
00:10
HD
Computer Monitor Displaying Business Dashboard Interface on Green Screen Background.
00:10
HD
 Financial Choice Concept, Business Decision and Modern Graphic 4k animation. Neon $840 vs $730 Price Comparison Animated with Glowing User Silhouettes, Dual Cost Display, Digital Pricing Analysis.
00:10
HD
Glass Profile Card Growing with Data Elements in Digital Interface Animation
00:08
HD
A person uses a laptop to explore ideas related to artificial intelligence and chatbots. The colorful chart shows various aspects of AI. The background is a simple workspace.
00:10
HD
A graphic representation of a blue rectangular prism with a bar chart on top against a dark background
00:24
HD
Horizontal progress bar with colorful segmented sections for loading process, data measurement, step completion, workflow status, and graphic timeline elements on transparent background
00:05
HD
A dark mode histogram titled "User control Analysis" displays a distribution of data with various grey bars on a stark black background.
00:08
HD
Secure User Login and Authentication Process Animation on Laptop with Account Profile and Data Charts
00:10
HD
teal circular progress bar showing data loading at forty-seven percent inside digital window popup against plain dark grid background
00:06
HD
Business Funnel Conversion Chart on Green Screen Background
00:15
HD
Animated data visualization dashboard with network graph interface
00:10
HD
A minimalist graphic showing a user profile icon next to data bars, representing personal information or statistics.
00:06
HD
A green graphic loop animation shows a rising bar chart on screen
00:05
HD
Neon pink glowing global analytics icon with pie chart and user profile on black background
00:08
HD
Digital analytics dashboard displaying website traffic growth with upward trend line and key performance indicators
00:08
HD
White line of a person standing above a medium readiness level progress bar on a black background
00:10
HD
Circle Loading animation from 0 to 100 with transparent background. Abstract circle frame loading icon animation, Modern User Interface Design Concept,
00:10
HD
Customer satisfaction icons showing positive and negative feedback trends
00:06
HD
Line Art Animated Bar Chart Showing Growth Metrics on White Background
00:10
HD
Animated Business Process Timeline with Four Stages Progress Bar.
00:05
HD
Futuristic dark interface displays a purple circular progress indicator alongside four mini bar graph widgets against a black background
00:30
HD
 Financial Choice Concept, Business Decision and Modern Graphic 4k animation. Neon $730 vs $830 Price Comparison Animated with Glowing User Silhouettes, Dual Cost Display, Digital Pricing Analysis.
00:10
HD
Minimalist business dashboard and digital workspace interface
00:15
HD
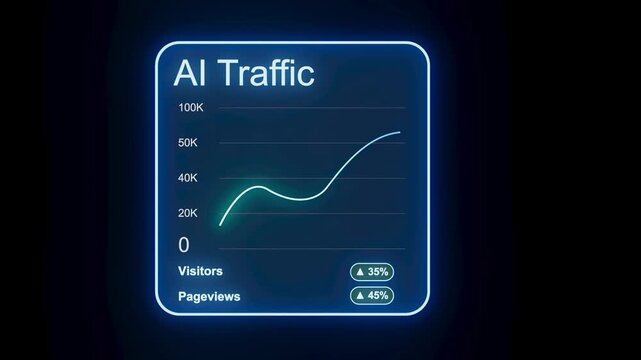
Graph displays AI traffic data with numbers for visitors and pageviews. The design has a blue background with a simple line showing trends.
00:10
HD
Minimalist animation of user profile and settings icons connecting to a document list.
00:06
HD
Horizontal progress bar with colorful segmented sections for loading process, data measurement, step completion, workflow status, and graphic timeline elements on transparent background
00:05
HD
Simple diagram showing a network structure with connected user icons on a dark background, ideal for business, teamwork, communication, technology, and organization concepts.
00:12
HD
A line icon showing a browser window with a bar chart and human figure symbolizing user analytics or profile statistics in a web application
00:10
HD
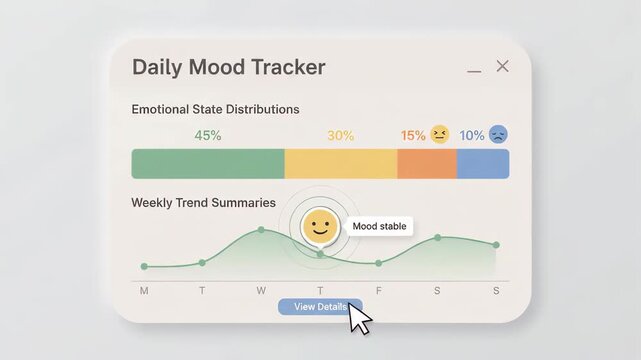
digital daily mood tracker interface showing emotional state distribution percentages and weekly trends in floating window against minimalist light gray soft-focus background
00:06
HD
A blue circular progress bar displays 33 percent completion on a white background
00:15
HD
Illustration depicting an accessibility icon connected with a data analytics chart and a computer monitor, symbolizing inclusive digital solutions for everyone
00:17
HD
Minimalist graphic depicting a person icon connected to a horizontal and vertical line structure.
00:08
HD
Simple financial dashboard on a computer screen 4k
00:06
HD
A dark mode histogram titled "User control Analysis" displays a distribution of data with various grey bars on a stark black background.
00:10
HD
Digital HUD animation dot circle data graph bars connection line dark background grain processed
00:06
HD
White line human figure on a black background with a medium user score indicator bar and numerical scale from zero to one hundred
00:10
HD
HUD UI/UX for games, motion design,. Futuristic user interface HUD and Infographic elements. Abstract virtual graphic touch user interface. UI hud infographic interface screen monitor. High Tech, 4K
00:15
HD
Minimalist line graph on a dark background with a subtle design element
00:10
HD
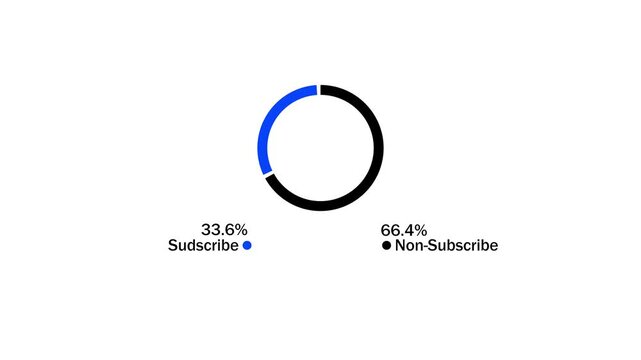
Subscription Analytics Pie Chart Illustrating Subscriber and Non- Subscriber Percentages Data
00:07
HD
4K animation HUD head up display interface code graph bar element for network cyber technology concept
00:20
HD
Set animation graphic futuristic HUD elements for user interface. Technological screen looped elements for broadcast, games, advertising, business.
00:20
HD
 Financial Choice Concept, Business Decision and Modern Graphic 4k animation. Neon $710 vs $810 Price Comparison Animated with Glowing User Silhouettes, Dual Cost Display, Digital Pricing Analysis.
00:10
HD
Animated infographic illustrating personal profile and financial data visualized with charts and graphs. Business growth and financial trends illustrated with animated rising and falling chart.
00:05
HD
Digital abstraction with seamless animation flickering digits of business, finance, technology or marketing on display screen. Animation. Big data on LED panel
00:15
HD
Glowing tax data surrounds hands typing on a laptop Financial planning is made simple with transparent graphs and intuitive user interfaces
00:10
HD