A link to set your password has been sent to: To access your purchases in the future you will need a password.
Create without limits — unlimited downloads, plus powerful AI editing
New filters added
Sort by

787,132 results for chart analysis in videos

Growth up stock markets blue chart 3d loop animation. Success, rising business and financial graph, economy data diagram and money investment analysis loopable and seamless abstract concept.
00:15
HD
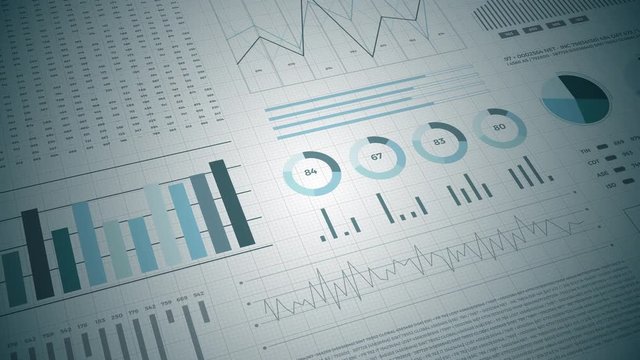
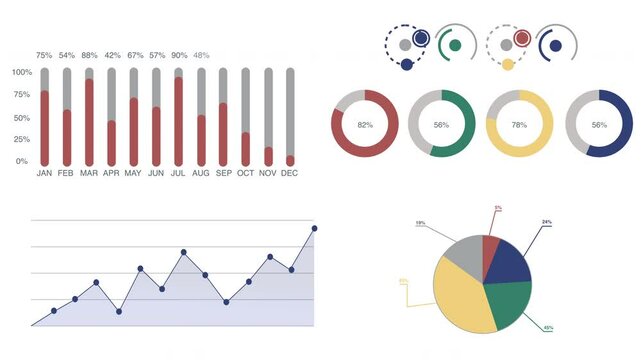
Business Statistics, Market Data And Infographics Layout/ 4k animation of a set of design business and market data analysis and reports, with infographics, bar stats, charts and diagrams
00:14
HD
Bull market chart analysis with increasing bar graph,candlestick chart,and upward trend lines
00:07
HD
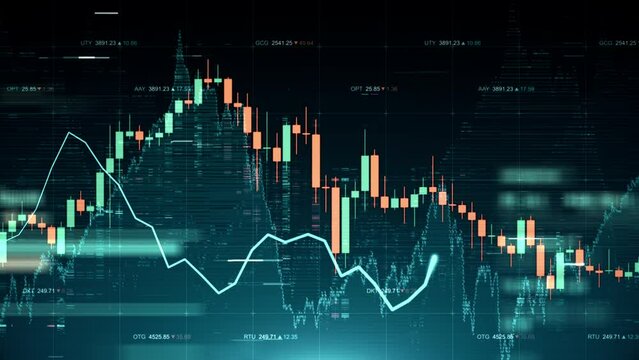
Financial market chart with candlesticks and line graph, Abstract financial chart with candlestick bars and line graphs market analysis growth and data trends animation
00:10
HD
woman analyst uses a computer AI artificial intelligence and dashboard for data business analysis and Data Management System with KPI and metrics connected to the database for technology finance,
00:10
HD
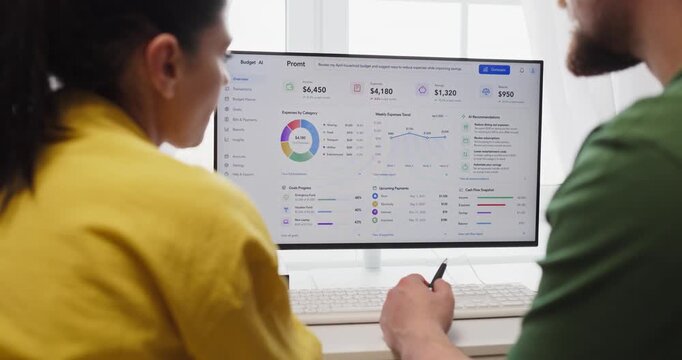
Couple budget planning on finance dashboard online. They review savings and monthly expenses on a computer at home using charts analytics for smarter choices. Clear concept of home finance teamwork
00:08
HD
Statistics, financial market data, analysis and reports, numbers and graphs.
00:30
HD
Blue animated business growth bar chart with rising trend line
00:10
HD
Zoom Out Top Down View: Diverse Team Of Business Professionals With Laptops Entering The Conference Room And Sitting Behind Table To Discuss Financial Data And Project Mindmap in Corporate Office.
00:07
HD
Financial report background graph and charts motion. Abstract futuristic stock market interface concept. Crypto currency commerce texture animation. Seamless loop.
00:15
HD
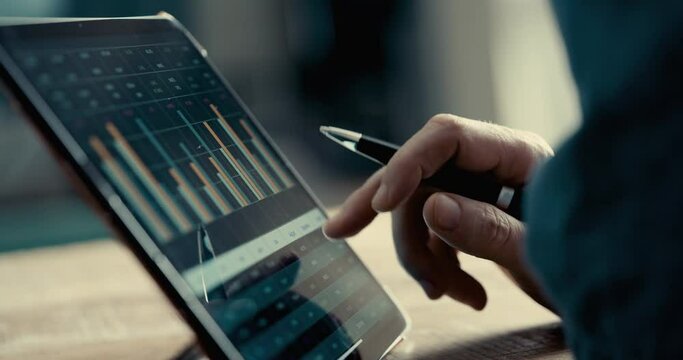
Reviewing business report on digital tablet
00:17
HD
Stock Market Chart, Beautiful 3d Animation of Japanese Candlestick Graph in TimeLapse. Seamless Looping Ultra HD 4K 3840x2160
00:11
HD
Looping animation showing a digital stock market chart with candlestick data and financial numbers
00:15
HD
A dynamic close-up timelapse of candlestick charts rising and falling on a trading screen, reflecting market volatility and momentum
00:29
HD
Dynamic stock market chart with candlestick patterns and real-time financial data on a digital screen ideal for illustrating investment trading and economic analysis
00:08
HD
Close-up of a stock market graph with red and green candlestick charts on a dark grid background with a cinematic lighting effect conveying a sense of financial analysis and trading
00:05
HD
Blue heart rate abstract digital background with glowing tech effects
00:08
HD
Hands typing on laptop with data charts and security icons overlay showing analysis, statistics, and technology insights in a dark modern workspace Gluon.
00:10
HD
Bar chart for growing business progress by month. Developing company growth during the year. Technology hud style computer animation. 
00:09
HD
Business steady growth concept with rising progress bar chart and upward arrow.  Symbolizing rising profits, success, and positive business performance.
00:10
HD
Growth up stock markets chart 3d loop animation. Success, rising business and financial graph, economy data diagram and money investment analysis loopable and seamless abstract concept.
00:15
HD
Business Statistics, Market Data And Infographics Layout/ 4k animation of a set of design business and market data analysis and reports, with infographics, bar stats, charts and diagrams
00:14
HD
Digital world map glowing financial chart bars global data visualization trading market analysis environment futuristic style. finance visuals, stock market business analytics, global economy themes.
00:20
HD
Professional software engineer sits in front of computer with big data server and blockchain network, works in modern monitoring control room with real-time analysis charts. Concept of cyber security.
00:23
HD
Stock chart going up. Share price animation. Investment concept.
00:10
HD
Analysts teamwork discuss finance data and dashboard. Colleagues review charts on computer screens and printouts, aligning analytics with metrics. Concept image of collaborative office analysis.
00:11
HD
African-American financial specalist analyze stock market data using tablet hologram technology
00:27
HD
Time lapse of moving candlestick chart in computer screen
00:25
HD
A futuristic animation of a financial data chart showing market analysis and stock exchange statistics, ideal for fintech, investment, or corporate growth presentations.
00:10
HD
Business intelligence and financial performance analysis report on white background, animated infographic bar chart loop, investment data analytic graph dashboard, enterprise market statistics trend
00:14
HD
Digital line graph tracks upward moving corporate revenue. Interactive line graph demonstrates successful financial forecasting. Economic growth concept with corporate line graph.
00:10
HD
Finance growth chart graph stock market upward data analysis business abstract background with rising green line over bar graph showing market trend investment statistic concept digital chart
00:10
HD
Stock Market monitor screen while open market for trading sell and buy stock online. Business economic and finance concept.
00:20
HD
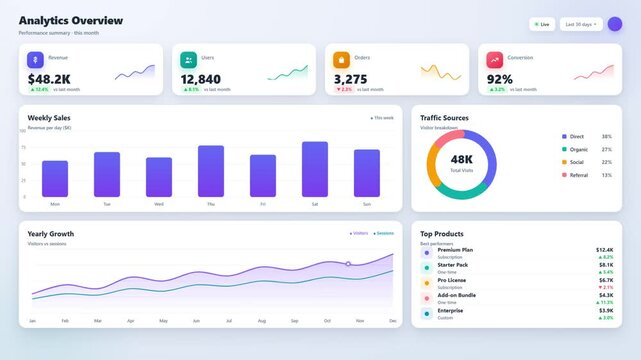
Analytics dashboard interface showing revenue charts user metrics and traffic data visualization
00:10
HD
Glowing bar graph rising showing financial growth and success in a modern digital environment chart business
00:06
HD
Candlestick chart showing a bearish trend with red and green candles on a black background, representing stock market or financial data analysis
00:09
HD
Wave stock markets blue chart 3d loop animation. Different market situation, rising business and financial graph, economy data diagram and money investment analysis loopable and abstract concept.
00:15
HD
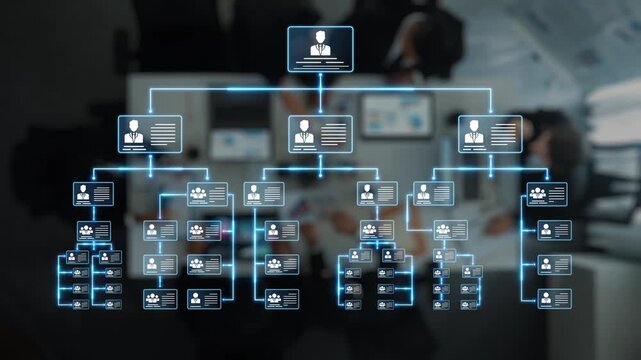
An illustration representing a digital organizational chart set in a modern office, showcasing team structure and collaboration among business professionals for strategic planning. Raster
00:20
HD
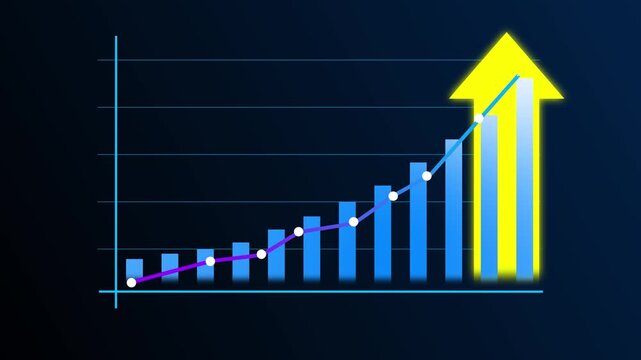
Dynamic financial growth bar chart animation with rising trend line and glowing success arrow for corporate business presentations, stock market analysis, economic forecasting, and data visualization
00:10
HD
Conference Business Meeting Presentation: CEO Businessman Shows Data to Group of Investors, Businessspeople. Projector Screen Shows Graphs, Product Sales, Revenue Growth Strategy, e-Commerce Analysis
00:15
HD
Global business statistics charts background. Pandemic, covid epidemic graph, stock market stats, global crisis, coronavirus world diagram. Abstract concept 3d rendering loopable seamless animation.
00:20
HD
Business Stats Market And Infographics On Computer Screen
Animation of a business and market data analysis and reports with infographics layout bar stats charts and diagrams on a computer screen
00:14
HD
Seamless looped abstract visualization of financial data, price fluctuations, investment analysis and trading activity. Financial market interface with changing charts. Forex trading concept
00:10
HD
African American software engineer looks at computer screen with displayed big data server and blockchain network, monitors real-time analysis charts in monitoring office. Concept of cyber security.
00:13
HD
Stock chart going down. Share price animation. Investment concept.
00:10
HD
Business stock market, trading, info graphic with animated graphs, charts and data numbers insight analysis to be shown on monitor display screen for business meeting mock up theme
00:20
HD
Modern Business Analytics Dashboard Animation with Multiple Data Visualization Panels like Charts, Graphs,  KPI Widgets, And Financial Statistics In A Clean Flat Design. Professional Website Metrics
00:49
HD
Young Businessman Presenting Data Dashboard on Screen in Modern Office
00:13
HD
Abstract financial chart with glowing digital candlestick data points moving across dark screen representing stock market volatility investment analysis business growth and economic trends.
00:10
HD
Businesswoman, question or screen for charts presentation or data analysis with hands up of growth graphs. Infographics, financial statistics or female speaker coaching on monitor ideas in meeting
00:09
HD
Golden 3D rising bar chart and yellow arrow symbolizing success and growth on a digital world map, concept for investment strategy, financial planning and global trading analysis
00:05
HD
Financial chart stock market trading candlestick data analysis investment graph price volatility dynamic movement forex technology screen data driven pattern insight market cycle trend line breakout
00:08
HD
Two diverse crypto traders brokers stock exchange market investors discussing trading charts research reports growth using pc computer looking at screen analyzing invest strategy, financial profit.
00:14
HD
Project Manager Updates Agile Task List In Office Diary
00:28
HD
Digital blue bar chart with growing business concept. Hi-tech style technology chart with a grid. Camera movement with depth of field. 4K resolution animation.
00:10
HD
financial chart with uptrend line candlestick graph in stock market,Stock market data on LED display. Business analysis concept.
00:13
HD
Close-up asia business people meeting plan analysis statistics brainstorm and header of team hold tablet pointing graph chart and employee take note. Finance strategy statistics success concept.
00:14
HD
Top down aerial view of professional businessman analyze stock market chart with tablet with investment graph placed at table while investor group pointing at tablet. Creative business. Directorate.
00:16
HD
Animated stock market chart on a black background.
00:30
HD
Closeup blue green infographic chart dashboard, Business intelligence and financial performance analysis report, investment data analytic bar graph, success corporate market statistics trend
00:16
HD
CEO talking, team and business people with laptop for financial results, banking data and planning. Group, cooperation and manager in office for investment meeting, profit analysis and revenue charts
00:11
HD
Business Statistics, Market Data And Infographics Layout/ 4k animation of a set of design business and market data analysis and reports, with infographics, bar stats, charts and diagrams
00:10
HD
Hand placing a bar on a chart while displaying various types of graphical representations, concepts of data analysis, financial growth, and business strategy
00:17
HD
Team, people and computer screen on stock market for trading with discussion on trends and reading data analysis at night. Business, professional broker and strategy with IPO chart and profit growth
00:05
HD
Animated stock market financial graph with green uptrend line. Beautifully designed growing stock chart for trading and investment, seamlessly looped.
00:15
HD
A detailed close-up shot of a trader's finger tracking the movements of a digital candlestick chart on a monitor, highlighting precise market analysis and strategy
00:14
HD
Infographics, pie charts and diagrams isolated on white background for market data analysis . Set of animated infographic elements 4K animation
00:08
HD
Dark blue graph charts on a futuristic cyberspace background
00:15
HD
Technical analysts marking technical bearish signal on chart by drawing descending trendline below consecutive lower highs and confirming with MACD crossover indicator in  Photo Stock  Concept  and em
00:10
HD
Statistics, financial market data, analysis and reports, numbers and graphs.
00:30
HD
Animation of a glowing financial bar chart overlay on a black background. Digital trading dashboard UI element, stock market revenue and business growth concept.
00:10
HD
Stock market chart with red and green candlestick patterns showing financial data trends and market fluctuations digital display, conveying dynamic investment activity and analysis, market trend
00:10
HD
Business Innovation Light Bulb with Startup and Growth Icons
00:09
HD
Person using smartphone with stock market charts on screen. Trader analyzing financial data on trading app. Concept of online trading, investment analysis and financial risk
00:12
HD
Growing line chart graph - business development competition concept animation. Hi tech style charts with grid. Camera movement with depth of field.
00:12
HD
Stock market ticker terminal screen showing multiple live trading graphs and financial charts
00:30
HD
Stock market candlestick chart hologram on digital world map,global financial index analysis,business economy investment.Global market analysis world map with stock market graph overlay animation
00:15
HD
GDP growth economic indicator chart with rising bar graphs and HUD radar
00:15
HD
Financial Data Analysis On Computer Monitor
00:26
HD
Urine sample test and analysis for kidney issues detection using color chart, medical diagnosis and laboratory health test sample chart
00:09
HD
Business profit income and capital charts and graphs diagram seamless and loopable concept
00:16
HD
Business Stats On Computer Screen
Technology textured business and market data analysis and reports with infographics layout bar stats charts and diagrams
00:14
HD
Diverse Professionals Working on Business Statistics and Marketing Plans in Corporate Office. Top Down View Of Discussion and Financial Data Analysis on Laptops and Charts. Teamwork And Innovation.
00:19
HD
Business data graph chart bar
00:10
HD
Gold bullion with engraved text GOLD FINE and purity mark 9999.9 on financial market chart enhanced with animated motion graphic video footage showing trend analysis value movement trade wealth invest
00:08
HD
Business stock market, trading, info graphic with animated graphs, charts and data numbers insight analysis to be shown on monitor display screen for business meeting mock up theme
00:20
HD
Advanced data analytics dashboard display. Business and financial investment. HUD infographic of financial. Information reports of business strategy for investment. Technology data analysis.
00:25
HD
Close-up of a digital candlestick financial market chart with red and green bars. Trading and investment
00:12
HD
Business people analyzing business growth chart and discussing company strategy
00:24
HD
Abstract digital candlestick chart with global financial data background, perfect for trading, forex, crypto, and investment presentations. Financial Investment Background. 3d Rendering.
00:20
HD
financial chart with uptrend line candlestick graph in stock market,Stock market data on LED display. Business analysis concept.
00:14
HD
Minimalist bar chart and line graph animation showing financial growth and market data analysis for business presentation
00:05
HD
Close-up asia business people meeting plan analysis statistics brainstorm and header of team hold tablet pointing graph chart and employee take note. Finance strategy statistics success concept.
00:15
HD
Trading candlestick chart on electronic devices, stock exchange market graph, analysis on smartphone, desktop and tablet. Stock market option background
00:11
HD
Animated financial stock market chart with a rising graph and trend line, symbolizing business growth, success, and profit. Investment and economy data visualization motion graphics video footage.
00:10
HD
Financial trading interface showing fluctuating market prices, candlestick charts and highlighted price levels, illustrating investment analysis, stock volatility, market trends and economic data flow
00:11
HD
Overhead arc shot of office team analyzing financial graphs and documents during collaborative corporate meeting
00:12
HD
A trade market diagram appears on the screen along with candlestick charts in the background, illustrating the volatile world of forex and cryptocurrency trading. Charts and diagrams.

00:15
HD
Rising candlestick chart with green and red candles on trading screen. Stock market, crypto and forex price growth, financial analysis and investment
00:10
HD
Global financial trading chart with digital stock market data, investment strategy analysis and online exchange technology bit code
00:19
HD