A link to set your password has been sent to: To access your purchases in the future you will need a password.
Create without limits — unlimited downloads, plus powerful AI editing
New filters added
Sort by

1,566 results for candlestick vector in videos

Financial Stock Market Bullish Trend Candlestick Chart and Bull Alpha Channel Animation.
00:06
HD
Stock market candlestick chart financial trading background showing stock
00:15
HD
Futuristic cyan candlestick chart for financial trading and stock market analysis on dark background. Glowing vector illustration for business and investment strategies
00:10
HD
Digital candlestick chart with oscillating trend line on dark green market screen.
00:10
HD
Financial stock market trading candlestick chart vector animation with upward green trend line and data statistics.
00:10
HD
Stock market candlestick chart on dark digital screen. Features financial data graphs and indicators for trading analysis. Digital background for finance investment and economy.
00:08
HD
financial stock market candlestick chart vector animation
00:29
HD
Minimalist financial candlestick chart pattern isolated on a black background
00:10
HD
Rising stock market chart with glowing candlesticks, financial growth and bullish trading trend, digital investment concept with bright light animation
00:08
HD
Minimalist stock market candlestick chart with blue background and financial indicators
00:16
HD
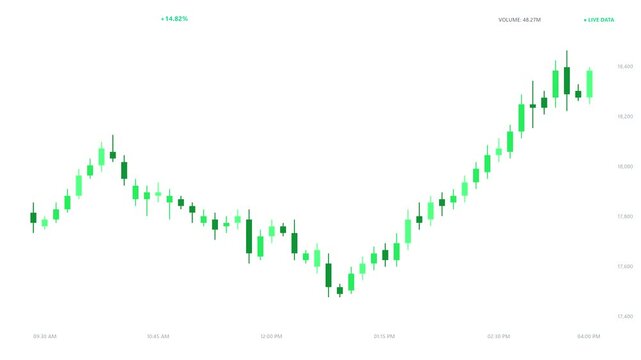
Green candlestick stock market chart showing financial data and price trends over time
00:10
HD
Green financial candlestick chart market motion footage showing digital stock exchange growth analysis with glowing neon particles and grid lines
00:05
HD
Financial candlestick chart with a yellow trend line represents stock market trading on a dark background.
00:10
HD
Set of eight candlestick stock market charts showing financial price fluctuations in dark mode
00:12
HD
Animated coral colored minimal dashboard user interface layout with financial candlestick charts, matrix scatter plots, and clean monitoring widgets.
00:07
HD
Stock market candlestick chart vector illustration. Features green and red trading bars on dark background. Financial data analysis graphic for investment and trading platform interface.
00:15
HD
Financial candlestick chart showing stock market trading trends and investment growth fluctuations over time with motion graphics
00:10
HD
Animated stock market candlestick chart on white background showing financial data trading fluctuations. High quality motion graphics for business and investment concepts.

00:11
HD
Digital stock market candlestick chart with glowing neon lines showing financial data analysis on a overlay background for business and investment
00:07
HD
Digital financial dashboard with candlestick charts and data metrics
00:10
HD
Financial candlestick chart with green and red bars indicating market fluctuations, growth, and decline, presented as a flat vector graphic on a grid.
00:10
HD
Seamless 4K looping finance animation: candlestick chart rising upward motion. Flat vector trading terminal with grid, axis ticks and blank readout cards in deep blue on a deep dark background, leavin
00:07
HD
Global market candlestick trend animation, Earth globe on left with ascending blue candlestick stock chart
00:10
HD
Financial stock market candlestick chart analysis for trading analytics data visual.
00:10
HD
Glowing green financial stock market candlestick chart showing price movement trends and technical data analysis on a overlayTransparent  background
00:20
HD
Digital stock market chart showing fluctuating green and red candlestick patterns on a dark blue background to represent financial trading trends and volatility for global investment analysis.
00:10
HD
A digital predictive analytics display shows neon financial candlestick charts flickering across three panels to illustrate real time market fluctuations in a dark electronic trading interface
00:06
HD
Three variations of dynamic pricing represented by oscillating candlestick charts displaying fluctuations in market value against a stark black void for financial data analysis
00:06
HD
A financial candlestick chart showing an upward market trend on black background
00:10
HD
Abstract portrayal of a financial cityscape featuring dynamic stock market candlestick charts with green and red colors against a dark background
00:10
HD
Financial stock market candlestick chart showing a bullish upward trend for crypto or stock trading
00:10
HD
Minimalist digital candlestick chart isolated on a deep black background
00:10
HD
Minimalist black and white stock market candlestick chart animation with looping price fluctuations
00:07
HD
Set of eight candlestick stock market charts showing financial trading trends on dark blue background
00:10
HD
Abstract financial market candlestick chart with cyan and pink bars
00:15
HD
Stock market candlestick chart vector illustration. Features green and red trading bars on dark background. Financial analytics graphic for stock exchange and investment analysis.
00:15
HD
Stock market candlestick chart with glowing financial data graphics on a dark digital background
00:10
HD
Minimalist candlestick chart drawing with a pencil
00:05
HD
A financial candlestick chart displaying market trends on a black background
00:10
HD
Financial stock market chart animation showing bullish candlestick growth and live price action movement video footage
00:08
HD
Abstract financial chart with glowing candlesticks and data points on dark background
00:08
HD
Seamless 4K looping finance animation: candlestick with average smooth overlay. Flat vector trading terminal with grid, axis ticks and blank readout cards in teal and cyan on a deep dark background, l
00:07
HD
Global market candlestick trend animation, Earth globe on left with ascending blue candlestick stock chart
00:10
HD
Animated financial candlestick chart with glowing wave on dark digital background.
00:10
HD
Stock market trading animation with red candlestick chart, price volatility, financial trend analysis, investment activity and digital fintech business intelligence background video
00:08
HD
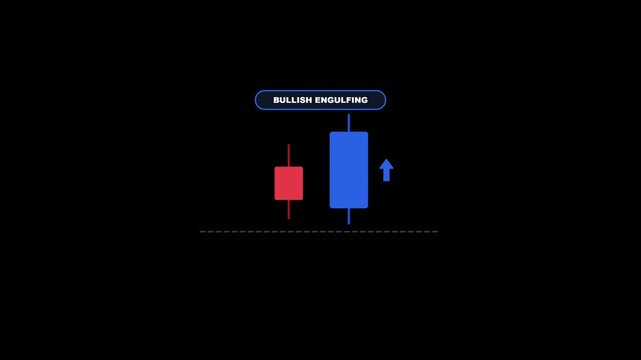
Bullish engulfing candlestick pattern with upward arrow on black background
00:05
HD
Business candlestick OHLC chart animated seamless loop alpha
00:12
HD
4K motion graphic of candlestick charts with alpha channel transparency. 2D cartoon animation of day trading stock, data visualization, on white background.
00:08
HD
Minimalist financial candlestick chart showing stock market trends and volatility
00:10
HD
Stock Market Trading Chart.
00:10
HD
Red stock market candlestick chart showing a wavy financial trend on a dark black background
00:10
HD
Isometric glowing blue trading table visualization with financial stock market candlestick charts in background
00:10
HD
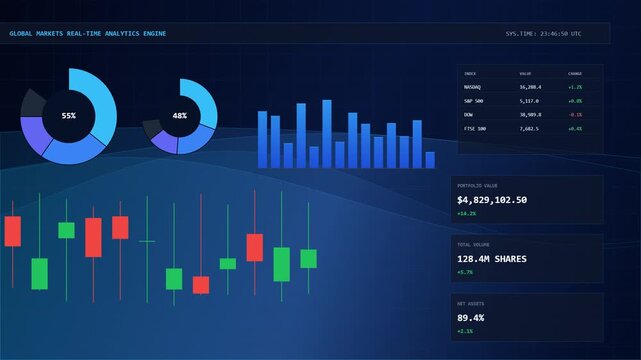
Animated financial dashboard UI featuring candlestick stock charts, pie charts, market indexes, and real-time analytics data.
00:07
HD
Set of eight candlestick financial charts showing stock market volatility and trading patterns on dark background
00:20
HD
Flat vector trading chart covering the entire video frame on solid dark navy background with faint grid: varied green candlesticks appearing one by one from left to right showing a bull market rising
00:06
HD
Moving Average Golden Cross Bullish Crossover Candlestick Momentum Rally Chart Animation 10 Seconds Loop in 4K UHD
00:10
HD
Animated candle flame burning on candlestick with white line drawing style isolated on black background for motion graphic.
00:16
HD
Global financial stock market charts fluctuate dynamically over a glowing digital world map background, illustrating international economic activity.
00:40
HD
Bearish candlestick chart showing downward trend in stock market trading vector illustration
00:08
HD
Animated male trader analyzing stock market candlestick charts and financial data on laptop computer
00:07
HD
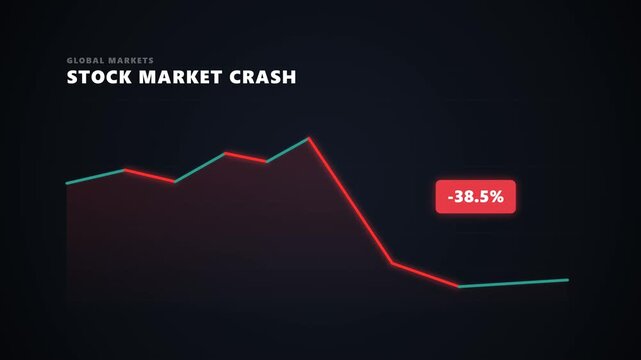
A clean, minimalist vector motion graphic animation of a stock market crash with a simple continuous chart line (green for uptrend, red for downtrend) without any arrowheads.
00:05
HD
Seamless 4K looping finance animation: candlestick zoom view close up. Flat vector trading terminal with grid, axis ticks and blank readout cards in teal and cyan on a deep dark background, leaving co
00:07
HD
Global market candlestick trend animation, Earth globe on left with ascending blue candlestick stock chart
00:10
HD
Crypto rocket soaring past candlestick charts in space showing financial growth.
00:15
HD
Bullish stock market trading animation with rising candlestick chart, investment growth, financial performance, market trends and digital fintech business analytics background video
00:08
HD
Glowing cyan candlestick stock market chart for financial trading data analysis 4k video
00:08
HD
Animated stock market candlestick chart, financial trading data analysis, moving averages loops, forex business graph concept
00:10
HD
Flat vector style Hanukkah menorah nine blue candles with animated flickering golden flames against a transparent background
00:15
HD
Flat vector animation showing a smartphone with a financial market chart connected to analytics icons for trading, investment, market analysis, and performance tracking.
00:10
HD
Financial candlestick chart showing an upward trend in stock market trading data.
00:07
HD
Algorithmic trading interface displaying complex financial candlestick patterns and neon wave oscillation charts on a dark digital screen to visualize real time market price volatility fluctuations
00:06
HD
A digital dynamic pricing dashboard with glowing candlestick charts fluctuating in real time across three separate user interface panels showing shifting market trends and financial data activity
00:06
HD
Abstract financial trading background with glowing green candlestick chart and wavy lines.
00:10
HD
Set of eight candlestick stock market charts with fluctuating financial data on a dark background
00:15
HD
Minimalist representation of two candlestick charts on a dark background
00:10
HD
Glowing red and blue candlestick stock market chart showing financial data fluctuations and trading activity on a dark background
00:05
HD
Digital stock market candlestick chart loop
00:10
HD
Dark modern crypto trading dashboard interface with animated candlestick charts, suitable for fintech apps, trading tutorials and market analysis
00:10
HD
a financial candlestick chart on a dark background featuring green and red candles alongside a turquoise trend line, representing price action in stocks, forex, or cryptocurrency
00:05
HD
Six Candles with Orange Flames on Pink Candle Holders on Light Pink Background
00:11
HD
Futuristic Market Volatility Candlestick Chart Animation
00:12
HD
Seamless 4K looping finance animation: candlestick with volume bars below. Flat vector trading terminal with grid, axis ticks and blank readout cards in deep blue on a deep dark background, leaving co
00:07
HD
Global market candlestick trend animation, Earth globe on left with ascending blue candlestick stock chart
00:10
HD
Financial market stock trading graph with glowing candlestick chart digital overlay.
00:10
HD
Bullish stock market trading animation with rising golden candlestick chart, investment growth, financial performance, market trends and digital fintech business analytics background video
00:08
HD
financial candlestick chart animation showing market volatility, rising trends and stock price fluctuations with dashed support line
00:10
HD
Abstract digital representation of financial market data with candlestick chart patterns on a dark background.
00:10
HD
A digital reach projection interface shows animated geometric shapes flowing along glowing line paths with candlestick charts fluctuating on a dark screen during system data monitoring
00:06
HD
Animated financial chart with green and red candlestick bars moving on a dark grid background
00:10
HD
Digital financial candlestick chart stock market data analysis graphic template
00:15
HD
Financial Stock Trading App Interface with Candlestick Chart and Successful Buy Order Execution Notification, Minimal Vector Animation Loop
00:12
HD
Minimalist candlestick chart showing price movement on a black background
00:10
HD
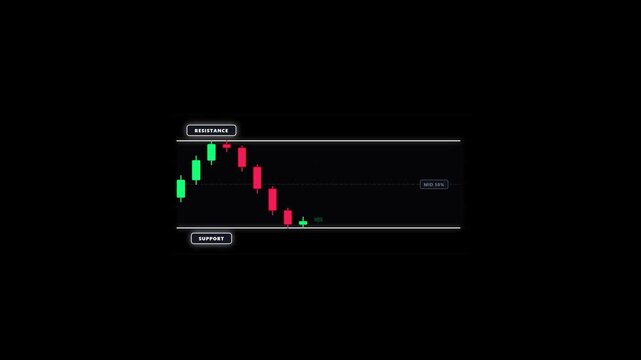
Support and Resistance. Technical Analysis Candlestick Chart Animation Showing Sideways Ranging Market Consolidation. Ideal for educational video content, trading courses, stock market, forex, and cry
00:20
HD
Animated Last Day of Hanukkah Menorah Candle Celebration
00:05
HD
A vibrant digital candlestick chart depicting market price fluctuations
00:10
HD
Digital candlestick charts displaying financial market trends with glowing green and red indicators on a dark background with future
00:10
HD
Digital candlestick financial chart showing stock market price growth trends 4k video
00:07
HD
Stock market growth animation featuring a rising arrow and dynamic candlestick chart on a white background. Concept of financial success, trading profit, forex market analysis,
00:05
HD
abstract financial chart with trend line graph and candlestick gradient background
00:15
HD
Financial candlestick chart and data graph on dark background
00:07
HD