
Gantt Chart Template

Business Strategy Horizontal Timeline Infographic Template

Technology Infographic Design Template
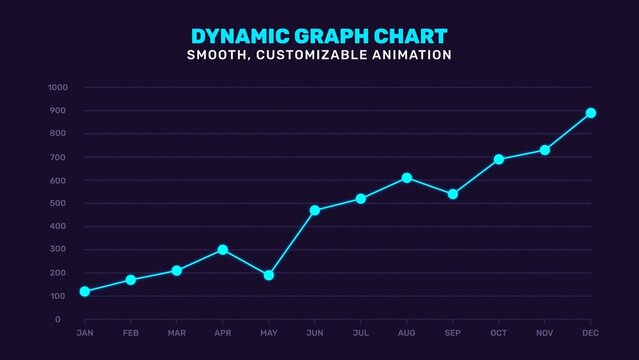
Dynamic Clean Modern Line Graphic Dot Infographic

Gantt Project Production Timeline Graph Layout

Project Schedule Infographic Template
FREE

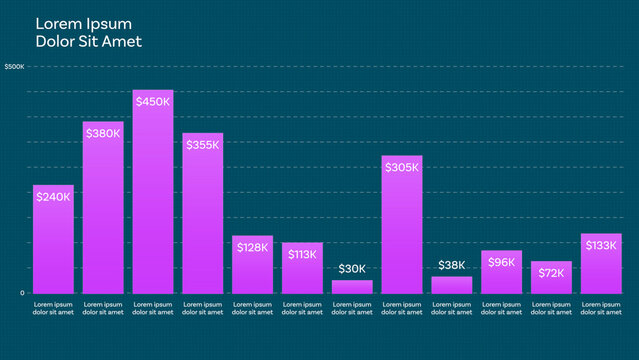
Horizontal Bar Graph Infographic
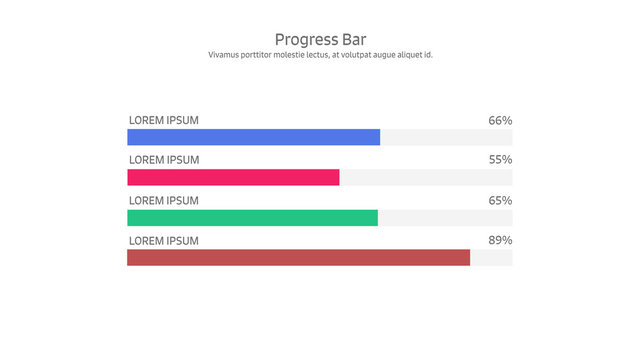
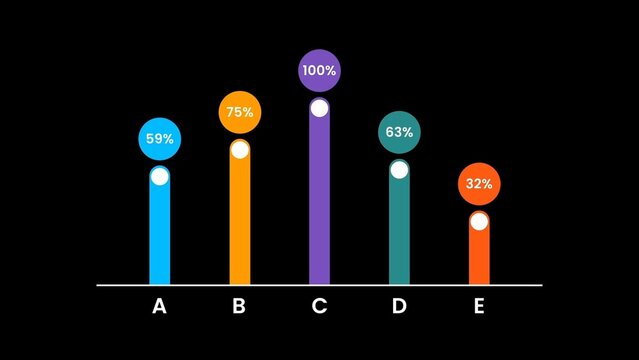
Progress Bar Infographic
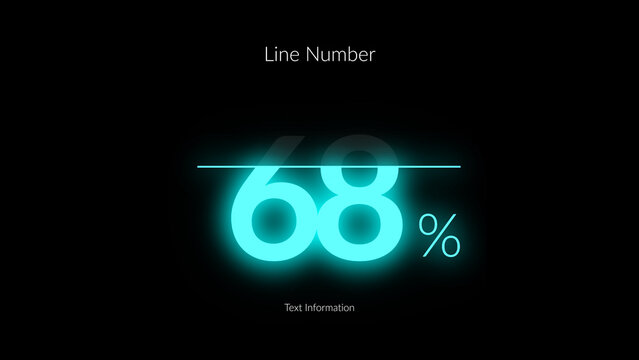
HUD Neon Infographics Line Number x1
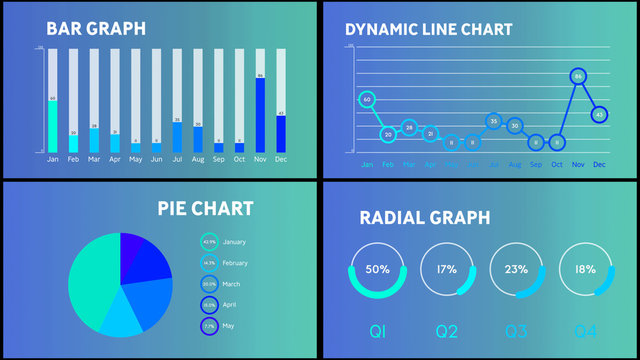
Minimal Gradient Chart Infographic
Responsive Vertical Bar Chart for Design and Data Visualization Design and Slide Presentation and with 12 Animated Data Points + Custom Text + Color with Dual Bar Graph Mode and Dynamic Auto-width Bar

Timeline Infographic Layout with Colorful Accents

Timeline Infographic Template in Modern Minimal Style

Daily Chore Chart Design

Infographic Presentation
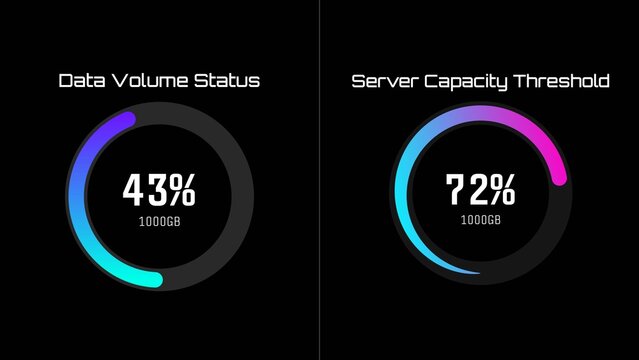
Modern Tech Circular Progress Infographic
10 Percentage Infographics

Gantt Chart Infographic

Minimal Lines Style Proyect Timeline Flyer

Colorful Modern Business Infographic Data Statistics Presentation Template

Gantt Chart Template with Bold Colors

Business Growth Infographic Template with Large Circles and Vision Illustration

Company Report Infographic with Progress Bars Layout

Modern Infographic Value Chart Graph

Professional Business Timeline Infographic Template with Blue Items and Photo Placeholders

Blue And Purple Performance Report
Looped Line Infographic 2
Charts and Diagrams Icons Set
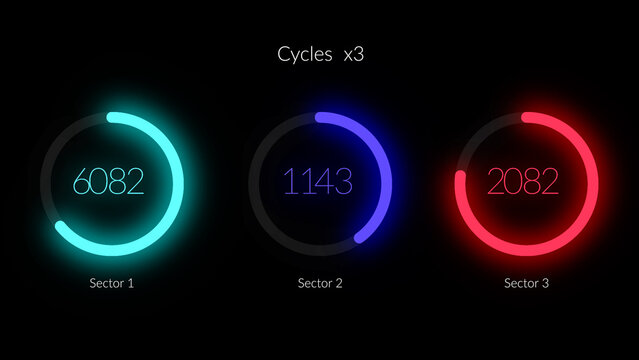
HUD Neon Infographics Cycles 3
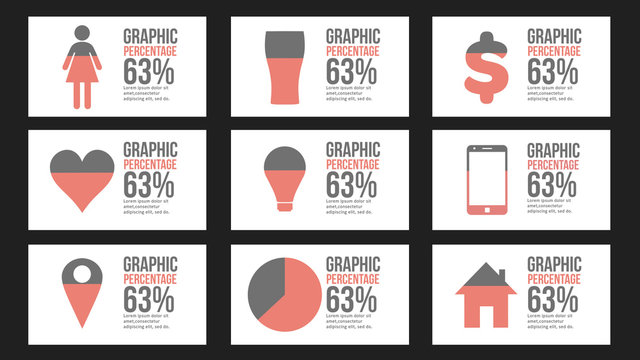
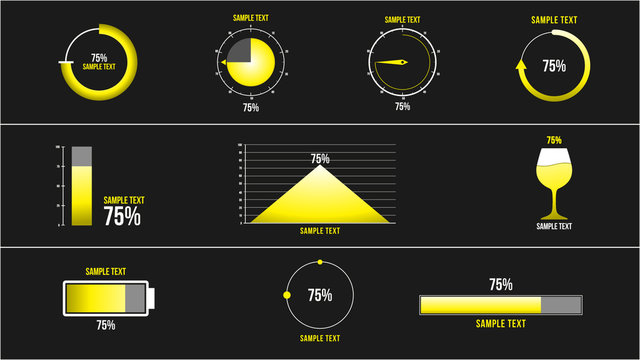
Graphic Percentages Infographic
Simple Project Timeline Infographic
Business And Corporate Icon Set Design
Timeline Infographic Template
Chore Chart Design Template
Habit Tracker Sheet Template Layout
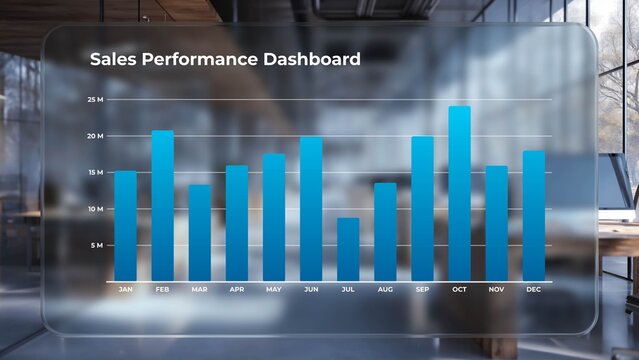
Corporate Glass Bar Chart
Success Infographic Template
Business Infographic
Kids Reward Chore Chart
Colorful Vertical Timeline Development Layout Infographic
Gantt Chart Infographic Template in Modern Corporate Style for Business Presentations & Data Visualisation
Three Steps for Business Growth Strategy Infographic Template
Infographic Table Layout with Colorful Gantt Chart
Clean Rounded Bar Chart Infographic
Project Timeline Layout with Blue and Green Accents
Pink and Gray Business Plan Layout
FREE
Pencil Progress Chart Infographic
Vector set of team work flat line web icons. Each icon with adjustable strokes neatly designed on pixel perfect 48X48 size grid. Fully editable and easy to use.
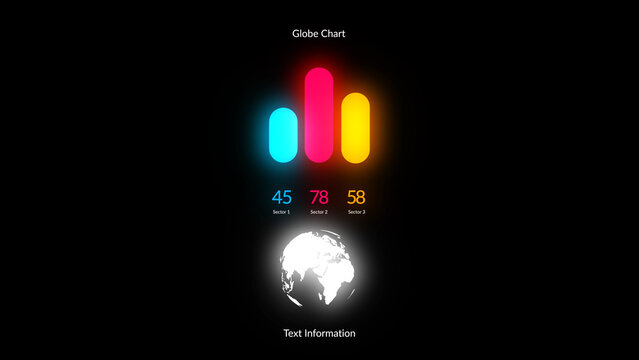
HUD Neon Maps Globe Inside Out Chart
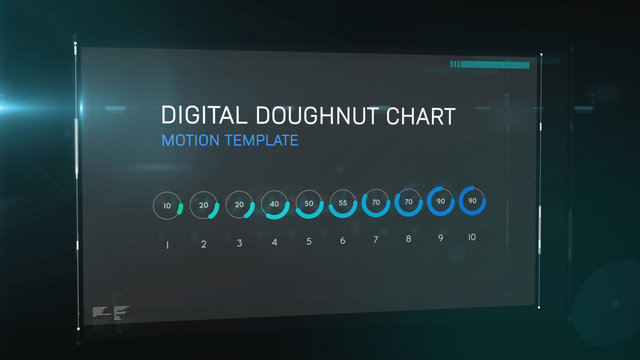
Digital Doughnut Chart
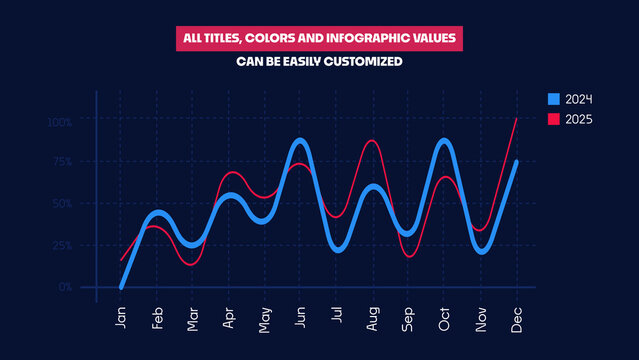
Corporate Infographics | Animated Line Charts, Business Data Trends and Yearly Performance Analytics for Reports and Presentations
Financial Data Infographics Layout Template
Timeline Infographic Template
Project Status Report Template

Caption Progress Bar Title Overlay
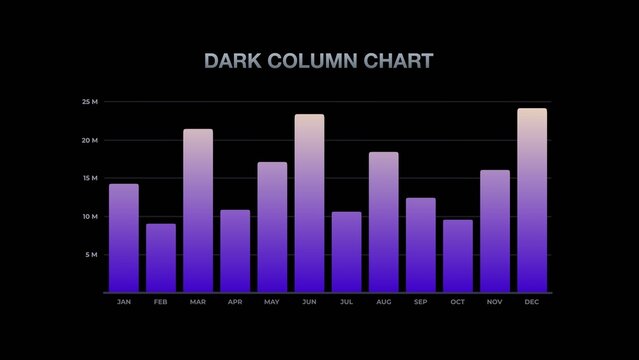
Modern Gradient Dark Column Chart
Vibrant Infographic Layout
Client KPI Dashboard Presentation Infographic
Gear Element Eight Page Infographics Kit
Dark Modern Gradient Infographic Timeline Template
FREE
Process Flow Infographic Template
Process Explanation Infographic Template with Circular Elements and Icons
Resume Layout with Dark Blue Accents
Rounded Step Cycle Infographic Data Visualiser
Horizontal Timeline Chart Infographic 1
Minimalist Weekly Habit Tracker
Arrow Timeline Infographic 1
Vector set of team work flat line web icons. Each icon with adjustable strokes neatly designed on pixel perfect 48X48 size grid. Fully editable and easy to use.
HUD Neon Icon Graph Number Line x1
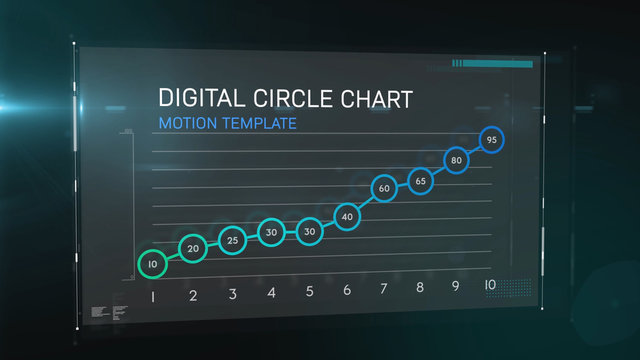
Digital Circle Chart
Creative Business Strategy Presentation Template
Business Investment Brochure Layout
Minimal Corporate Growth Infographic Layouts with Steps and Business Success Illustrations
Modern Corporate Annual Report Brochure Design Layout
Business Plan Layout with Blue Accents
3D Glass Market Share Ring Infographic
Business Evolution Timeline Infographic
Population Demographic Infographic
Yellow Accent Element Eight Page Infographics Layout Kit
Dark Blue And Light Blue Corporate Business Circle Infographic Template
Bar Graph Infographic Template
Waterfall Chart Infographic Template with Minimal Design
Resume Layout with Skill Progress Chart

Flat Design Infographic Data Visualiser Graph
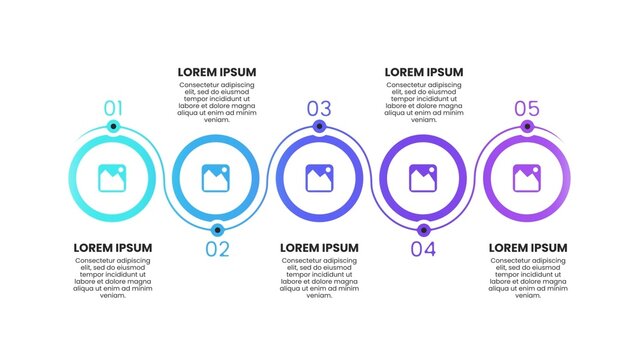
Modern Business Infographic Timeline Template with 5 Steps
Academic Performance Report Template
Numbered Circular Infographic Layout
25 Flat Circular Infographic Icons
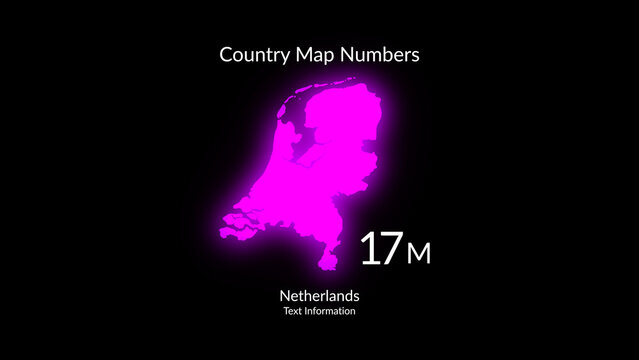
HUD Neon Maps Country Map With Number (210 Flags, 195 World Countries Maps Included)
Business Plan Layout with Yellow Accents
Simple Light Six Circle Steps Infographic Layout
Blue Vertical Steps Progress Layout
5 Steps Progress Page Layout
Company Milestones Infographic Template with Curved Timeline, Photo Plceholders and Business Icons
Five White Arrow Shape Steps Process Infographic Layout
Hexagonal Bar Graph Infographic Layout
Five Step Infographic Layout with Blue Accents
Modern Infographic Layout with Colorful Steps and Title Section
Project symetric timeline gantt graph with overlay blocks
Gradient Timeline