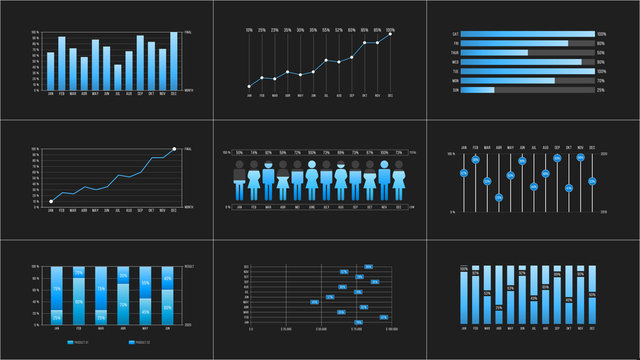
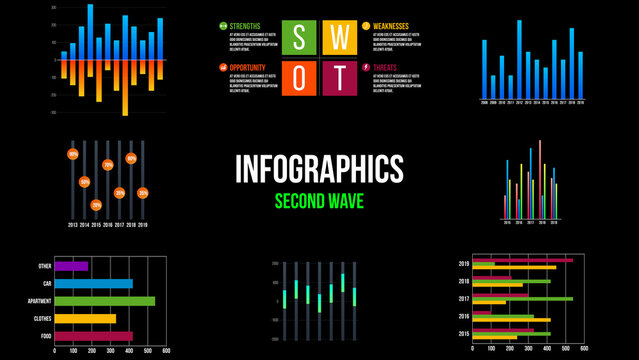
Infographic Charts

Infographic Social Media Layouts with Editable Graphs
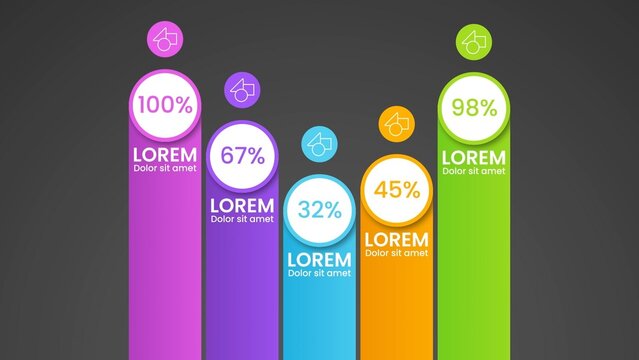
Bar Slider Professional Performance Tracker Infographic
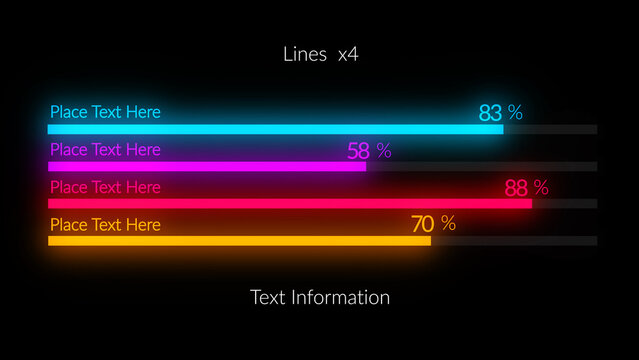
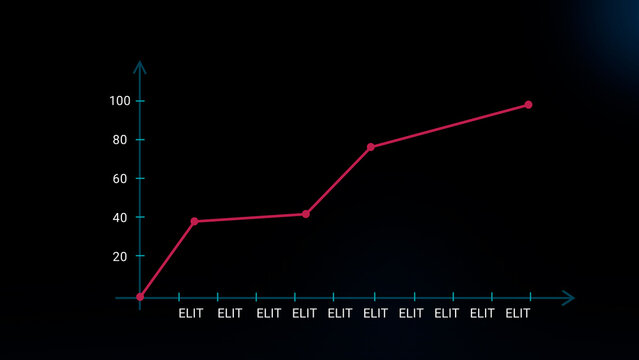
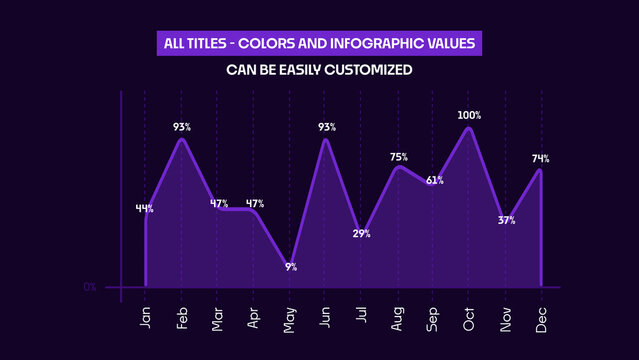
HUD Neon Infographics Lines x4

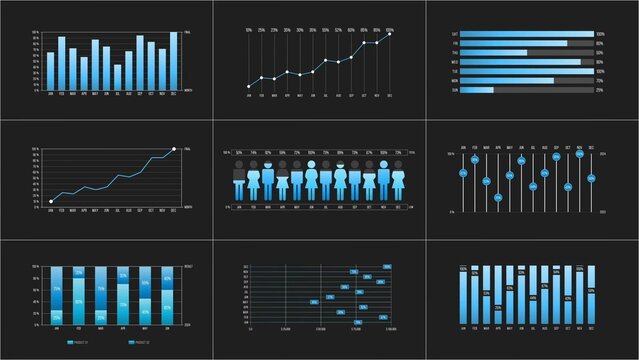
Business Infographic Set
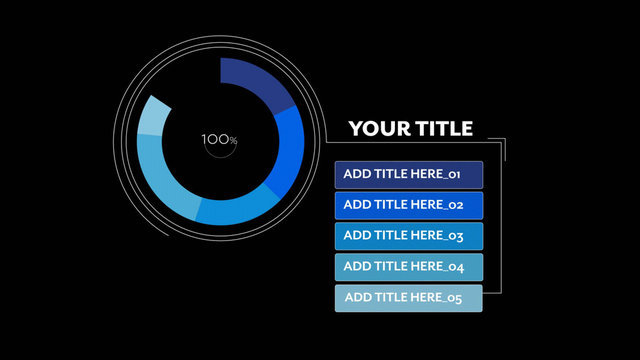
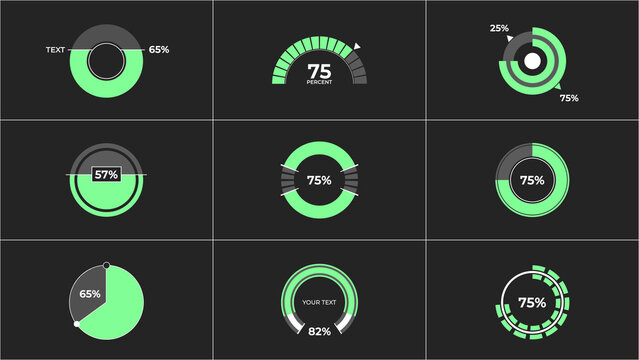
Colorful Circular Chart Infographics Pack

Presentation Graphics with Instructions
FREE
Business Impact Analysis | 5 Different Resolutions with Control Panels

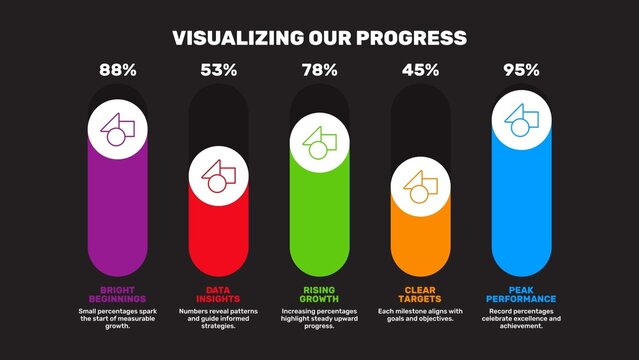
Editable Business Infographic Elements Template with Colorful Pyramid Charts, Bar Graphs, Line Diagrams and Data Visualization Timeline.
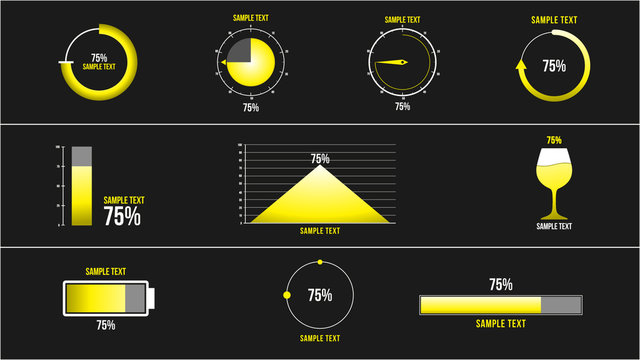
8 Infographics Elements
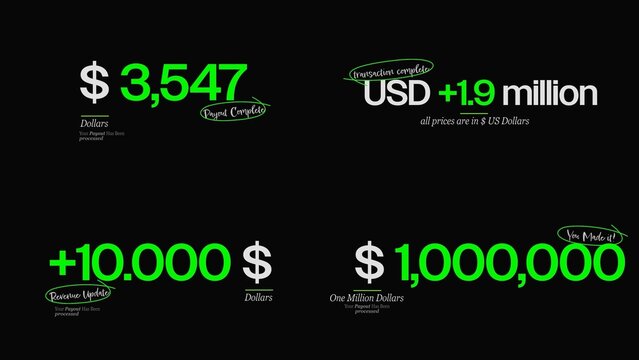
Currency Counters Text Animations | Animated money values, exchange rates & price displays for finance & banking.

Modern Business Infographic Presentation Template

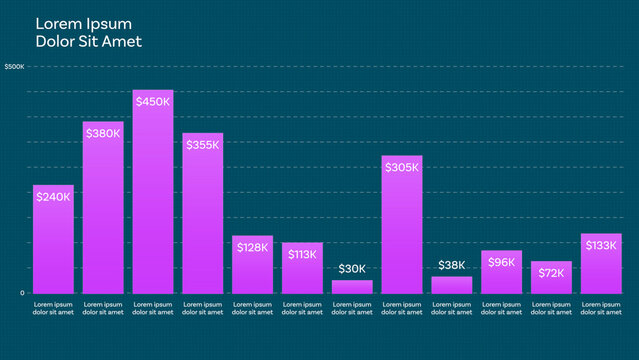
Modern Vertical Bar Graphs
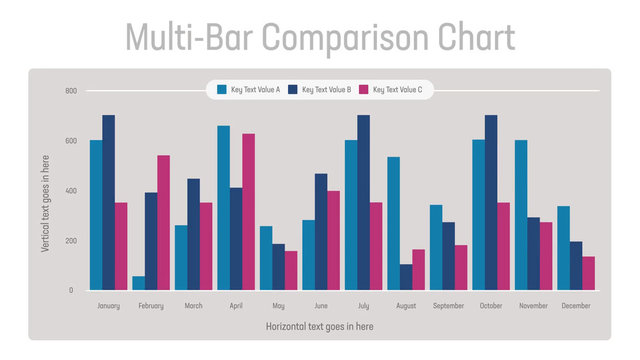
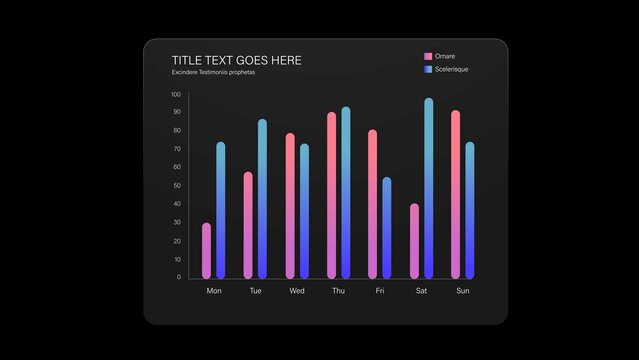
Multi-Bar Comparison Chart
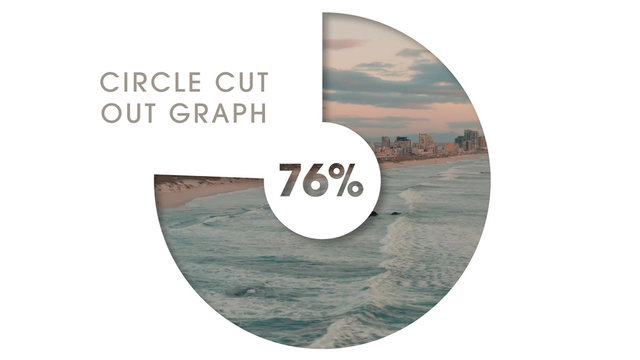
Circle Cut Out Bar Graph

Admin Dashboard Design
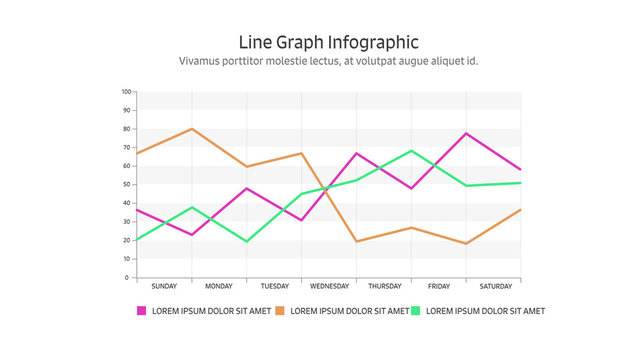
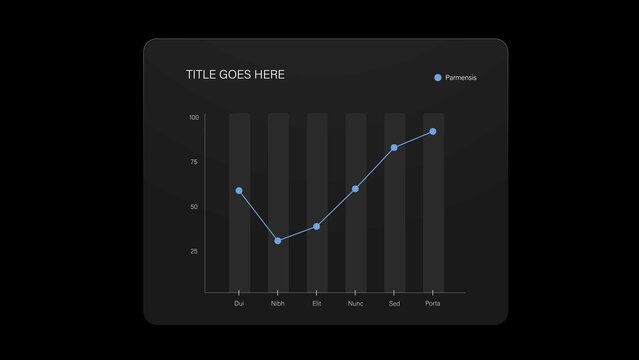
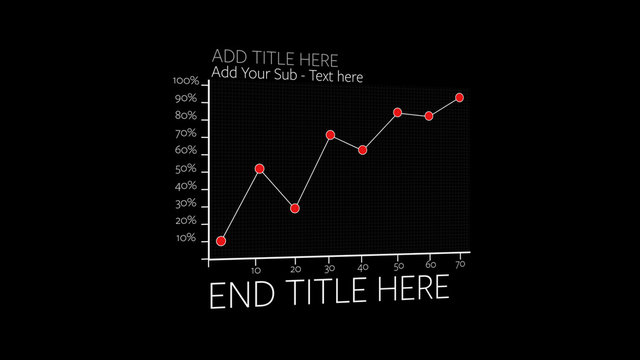
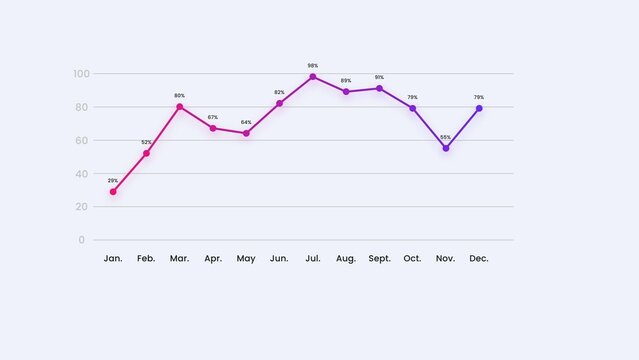
Line Graph Infographic

KPI Dashboard Presentation Layout

Histogram Graph Infographic Template in Modern Minimal Style
Infographics 01
Elegant Infographic Charts
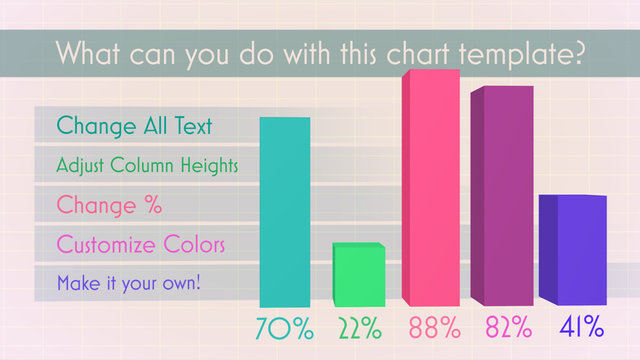
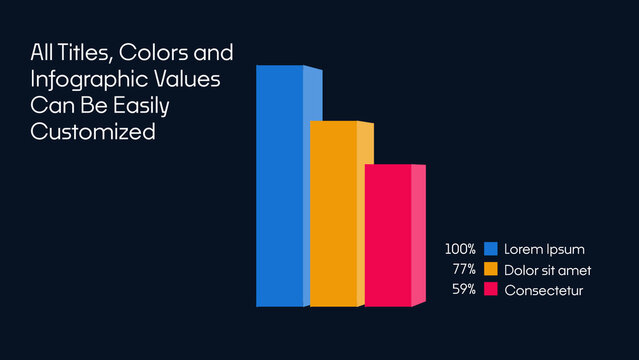
Bright Colored 3D Bar Graph

Editable Graph Elements for Data Visualization Layouts
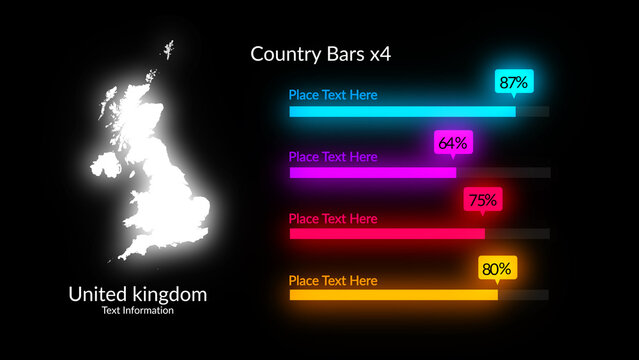
HUD Neon Maps Country Bars x4 (210 Flags, 195 World Countries Maps Included)

Infographic Presentation Elements on Dark Blue Background
Bento Widget Infographic Tabs

Business Plan Presentation Layout
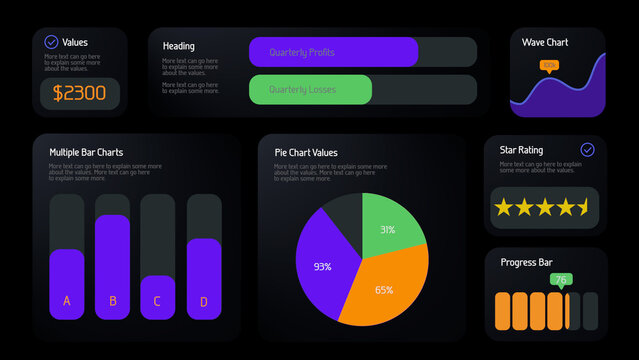
Modern Infographic Data | With Control Panel for every Scene
FREE
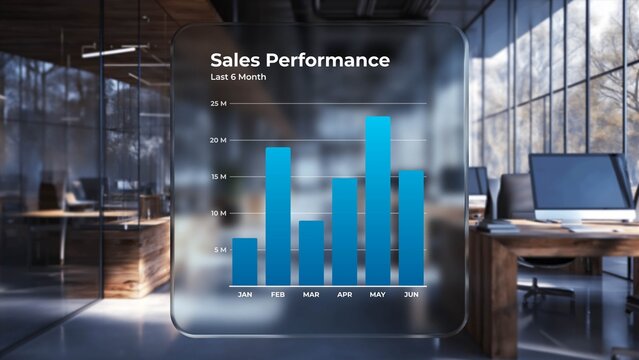
Glassmorphism Sales Performance Dashboard
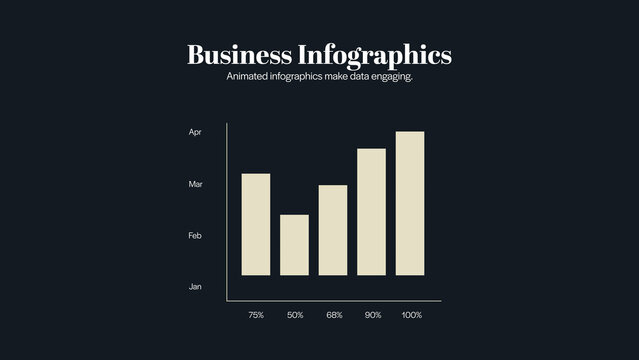
Business Infographics
Pie Chart Infographic Layout with Droplet Pointers
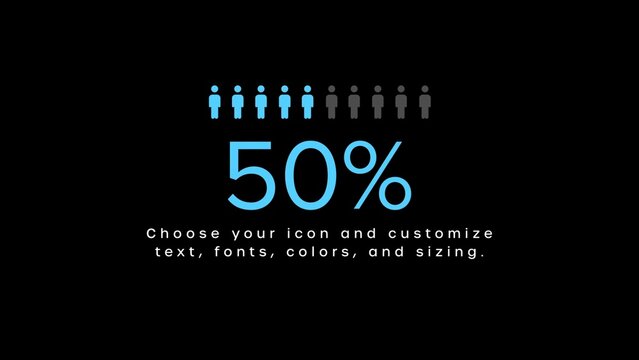
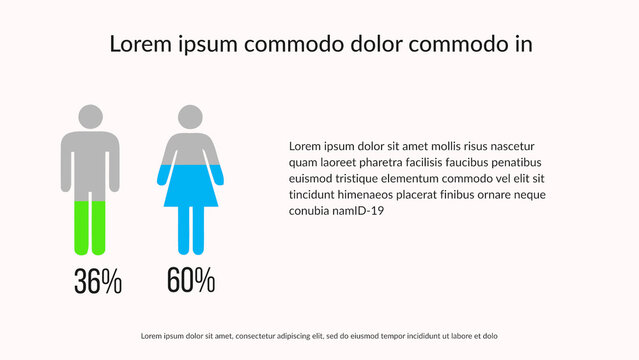
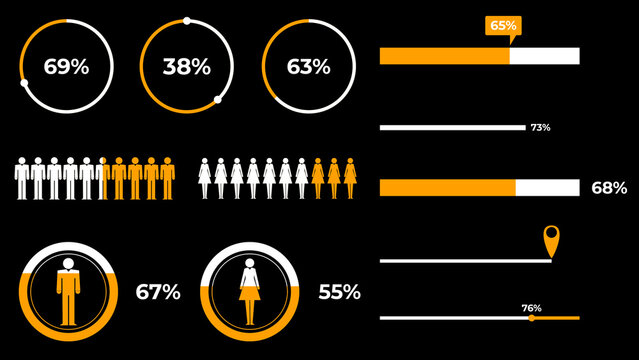
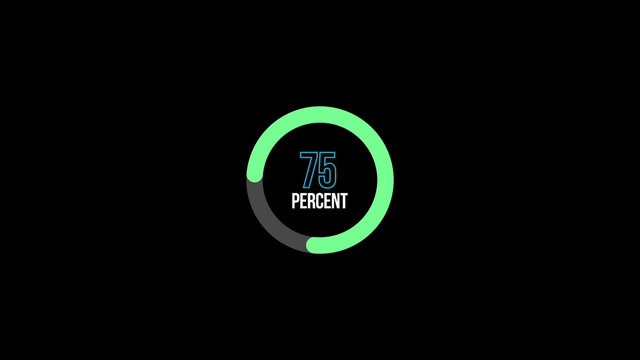
Infographic Maker with Percentage
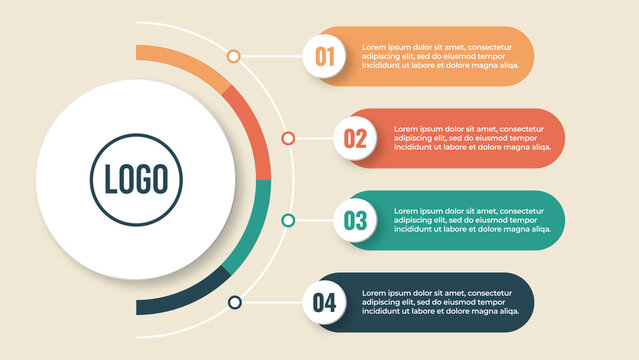
Presentation Business Circle Infographic
Corporate Annual Report Design Template
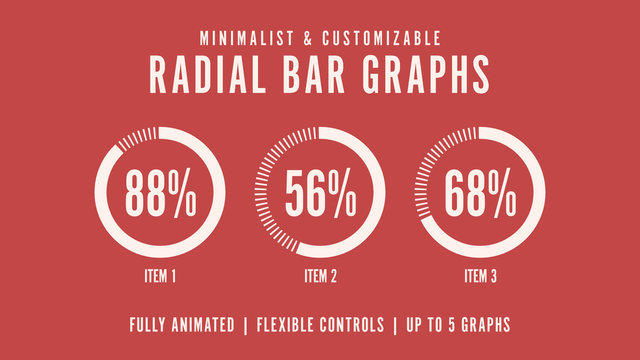
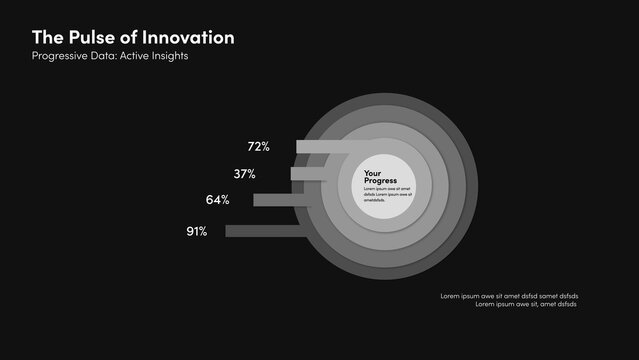
Minimalist Dashed Lines Radial Graph
3D Bar Graph Infographic
Business Financial Annual Report Presentation Template Slides
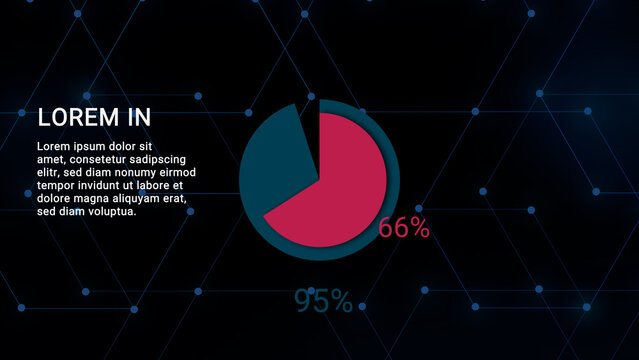
Modern Pie Style Circle Graph Chart With Percentages and Details Infographic
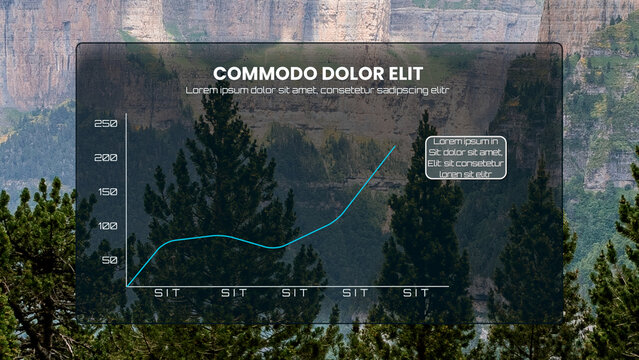
Line Chart Infographic Video Template
Infographic 07
Circle Ring Infographic
Business Dashboard Design
Infographic Elements Set
FREE
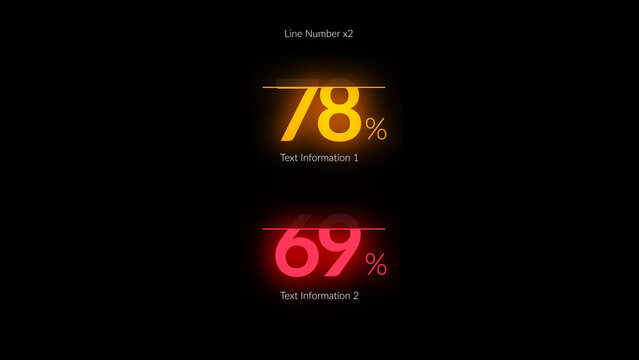
HUD Neon Infographics Line Number x2
Infographic Layout Set with Blue and Green Elements

Tech Finance Loop
Infographic Presentation Templates
Infographic Data Charts | With Control Panel for every Scene
FREE
Modern Data Infographics
Corporate Data Diagrams | Animated Business Infographics Charts
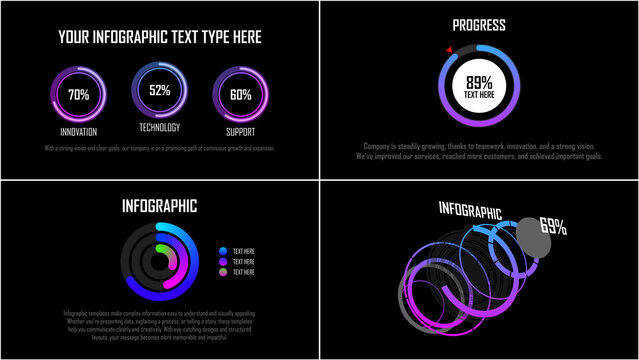
Colorful Business Infographic Presentation Template
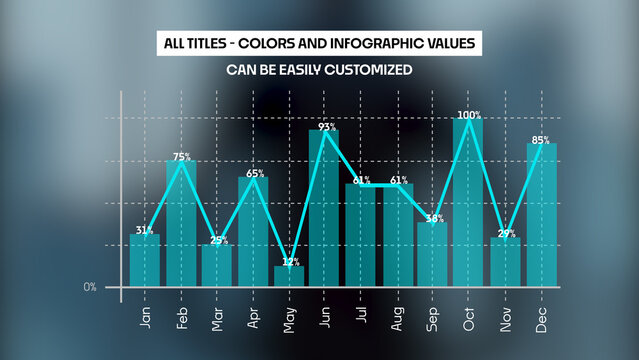
Responsive Vertical Bar Chart for Design and Data Visualization Design and Slide Presentation and with 12 Animated Data Points + Custom Text + Color with Dual Bar Graph Mode and Dynamic Auto-width Bar
Multicolored Bold Minimal Presentation
Pitch Deck Presentation Template
Business Growth Infographic Template with Large Circles and Vision Illustration
Business Financial Annual Report Presentation Template With Blue Accents
Modern Annual Business Report & Financial Analysis Brochure Layout
Gradient Graphic Bar Value Comparison Infographic
Infographic Bar Chart Video Template
Infographics 07
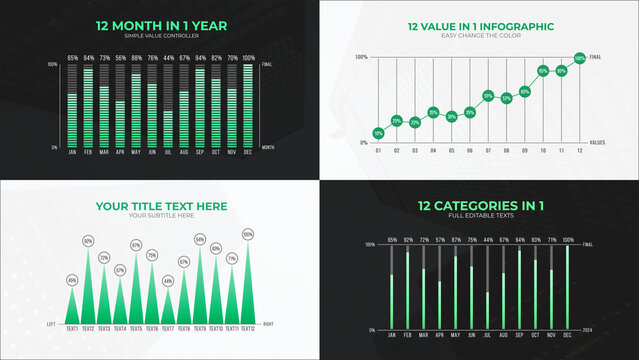
12 Value in 1 Infographic Charts
Dynamic Sales Analytics Dashboard UI Kit
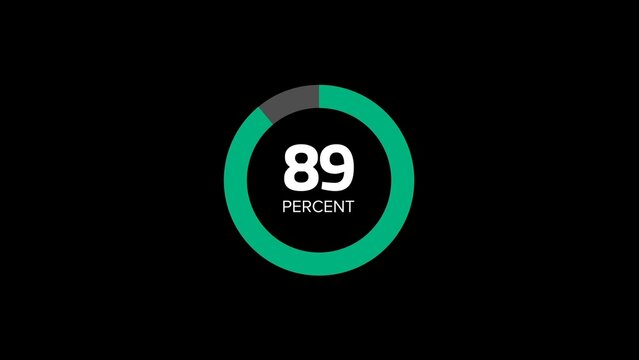
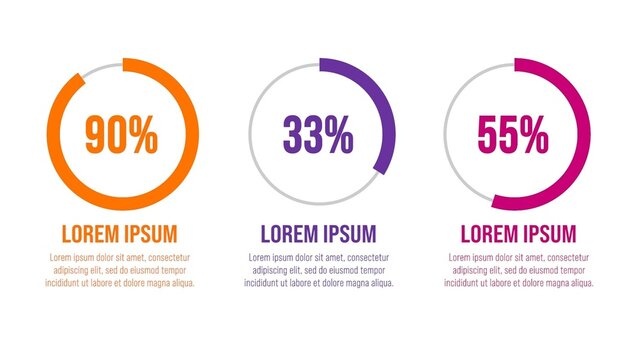
Circular Percentage Infographic with 3 Styles
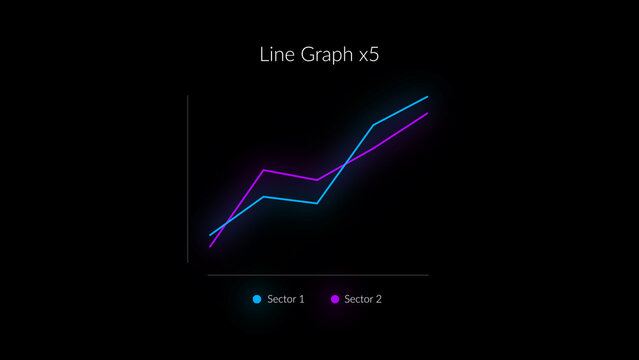
HUD Neon Infographics Line Graph x6
Infographic Brochure
Simple and Corporate Title
FREE
Business Plan Presentation Layout
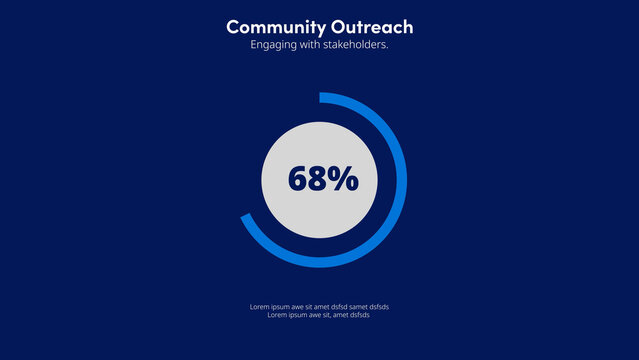
Community Outreach | with Control Panel
Multicolored Bar Graph Infographic
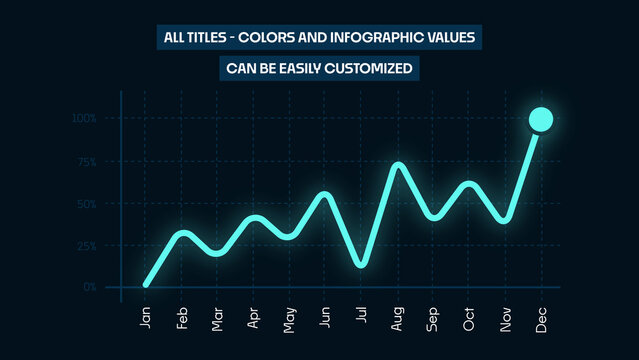
Animated Line Chart Infographics | Business Data Visualization and Analytics Graph
Purple And Yellow Infographic Elements Business Presentation
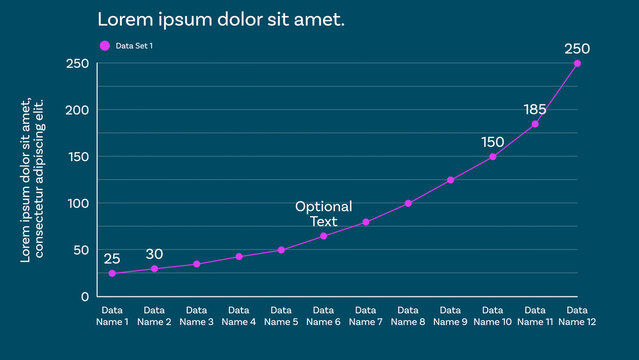
Responsive Line Graph for Clean and Modern Data Visualizations Design and Slide Presentations with up to 12 Animated Data Points and Optional Labels to show Percentages, Whole Values, and Custom Texts
Interactive Bright and Bold Annual Report
FREE
Bar Chart Business Statistics Infographic Presentation Layout
Infographics Elements.
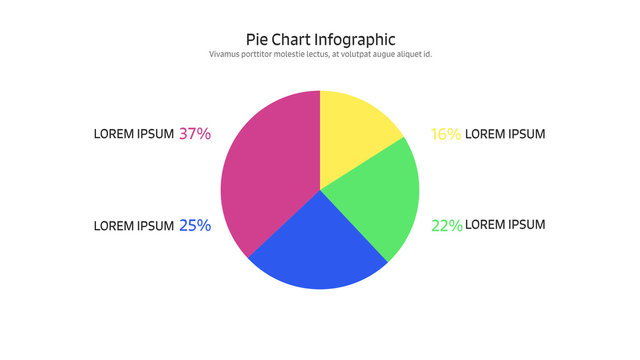
Pie Chart Infographic
Stripe Element Eight Page Infographics Kit
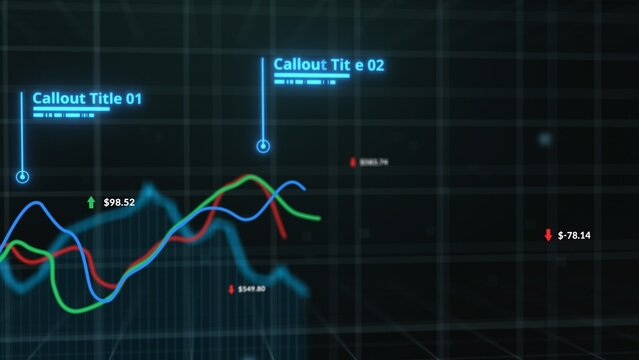
Stock Trading Animated Graph Title Template
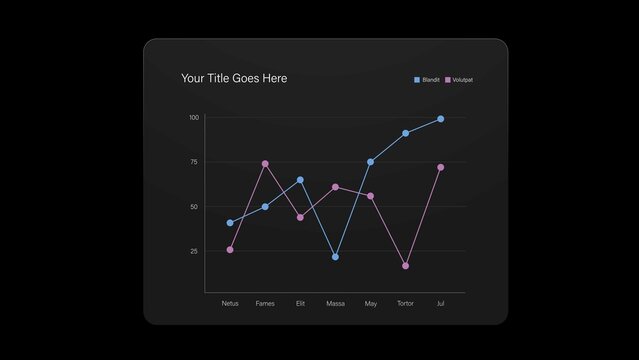
Line Chart Infographic Video Template
Infographics 02
Annual Report Presentation with Blue and Gray Accents
Line Graph Chart Infographic for Time Series in Business Presentation Layouts
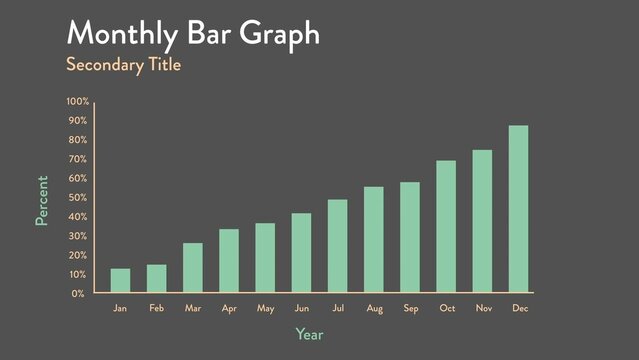
Monthly Bar Graph Infographic
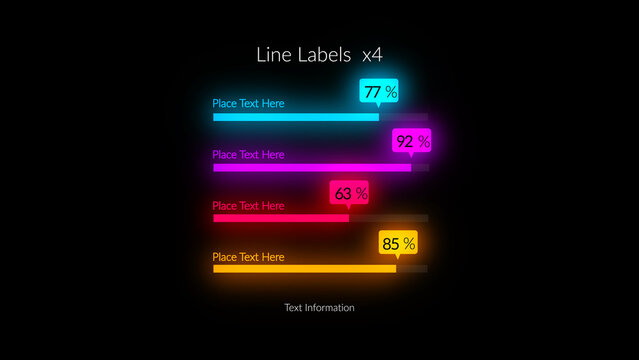
HUD Neon Infographics Lines Labels x4
Data Table Layout
Black and White Chart Infographics Pack
Business Plan Presentation Layout
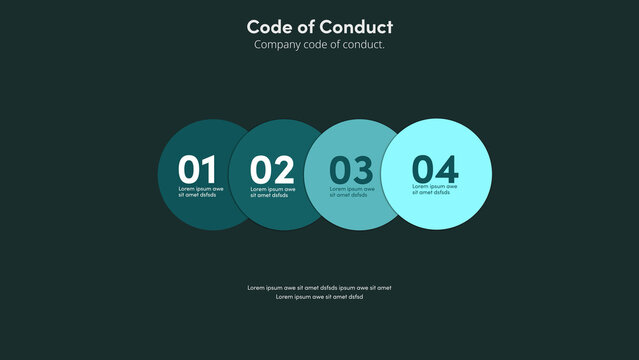
Code of Conduct | with Control Panel
Data Analytics Management Dashboard
Infographic Data Elements | Animated Charts, Graphs and Reports for Presentations
Editable Graph Elements for Data Visualization Layouts
10 Percentage Infographics
Infographic with Blue Accents
Budget Infographic Template
Circular Percentage Chart
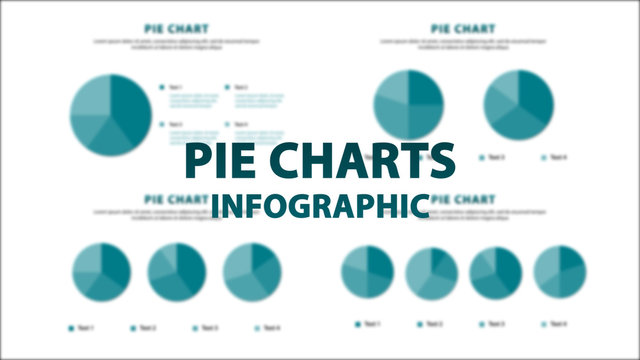
Modern Pie Chart Infographics
Retro Minimalist Data Infographic Template
FREE
Modern Multi Value Chart Infographic
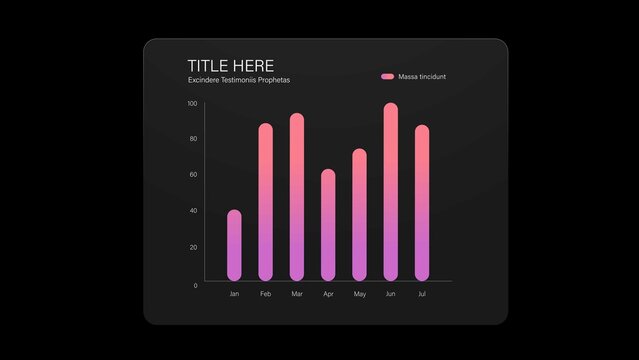
Infographic Bar Chart Video Template

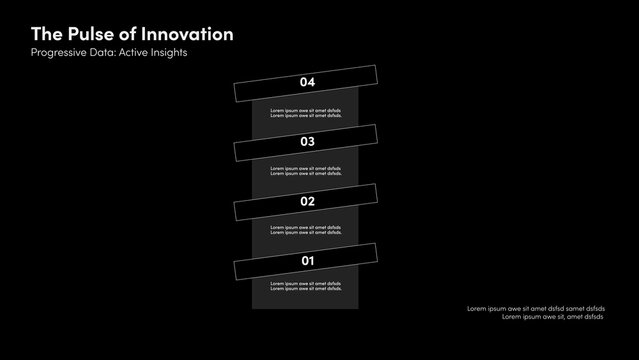
Step Infographics 05