
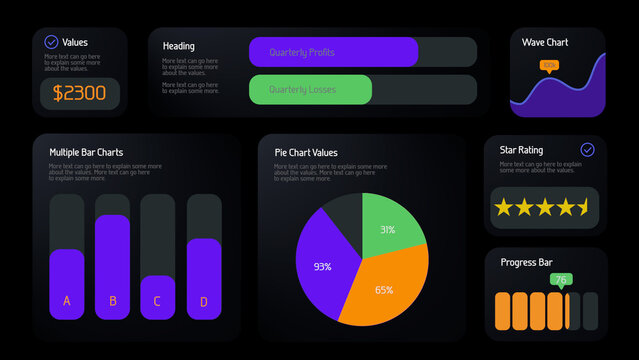
Bento Box Business Infographic Template For Dashboard Report, KPI Metrics, Data Visualization
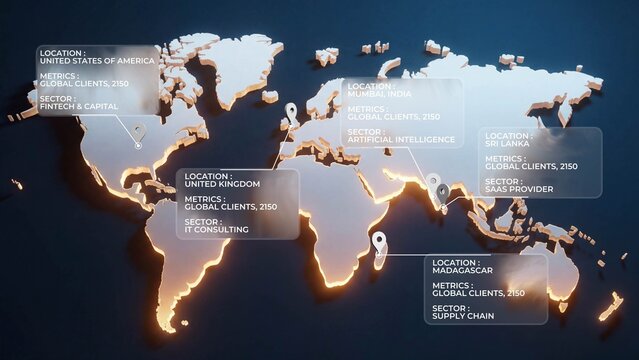
World Map Data Visualization

Topic Shift – Clean Editorial Title Animation with Contemporary Typography for Explainer Videos, Research Presentations and Documentary Storytelling
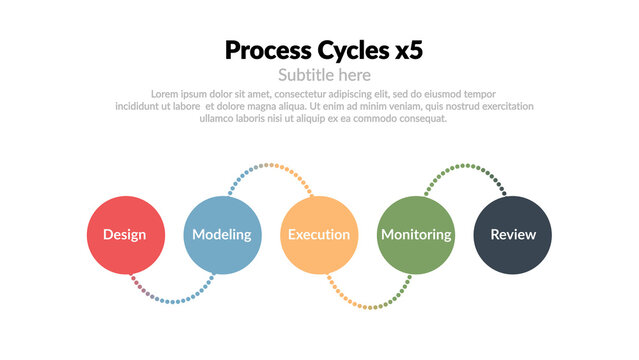
Process Cycles x5 – Animated Workflow Steps, Business Timeline and Flowchart Presentation, Modern Corporate Infographic for Strategy and Marketing

Creative Brief Presentation Template Design

Annual Report Brochure Layout

Modern Analytics Dashboard UI Design with Sales Reports, Charts and Business Statistics Interface

Mobile App Interface Display Mockup PSD

Stat Infographic with Increase and Decrease

Editable Business Infographic Template with Colorful Timeline, Pyramid Chart, Doughnut Diagram and Data Visualization Icons.

Five Steps Infographic Template Layout
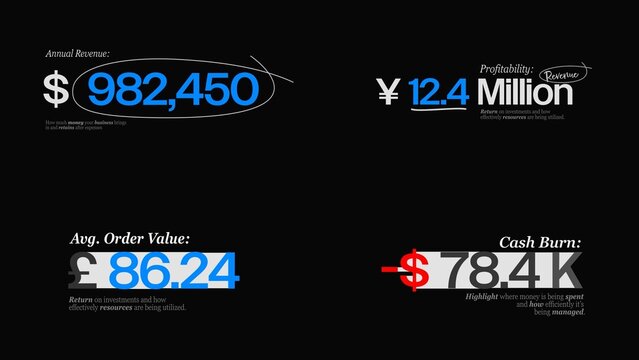
Finance Business Counters Text Animations | Animated KPI numbers for revenue, profit & corporate growth presentations.

Text Box Bars Infographic

Editable Info Chart Scatter Graph Layout

Colorful Data Visualization Infographic Table Design Template Layout with UI Elements

Blue US Election Infographic

Purple And Green Trendy Data Visualization Presentation

Business Growth Infographic Template with Illustration of Vision

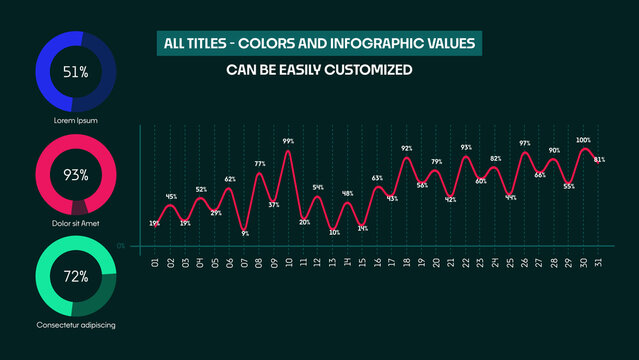
Clean Infographics Slide | Animated Data, Charts and Diagrams for Presentations

Red Modern Swiss Healthy Living Infographic Layout

Donut Doughnut Chart Infographic Template
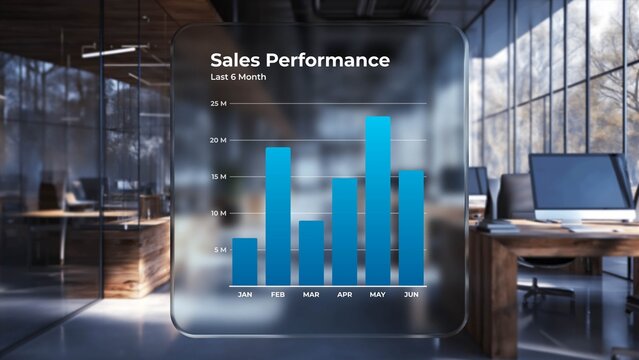
Glassmorphism Sales Performance Dashboard

Insight Atlas – Editorial Documentary Title Animation with Modern Typography for Investigative Reports, Educational Content and Storytelling Productions

Process Cycles Lines x4 – Animated Workflow Steps, Business Timeline and Flowchart Presentation, Modern Corporate Infographic for Strategy and Marketing

Resume Presentation Template

Simple Presentation Layout
Modern Dashboard UI Design Set with Analytics Widgets and Web Application Interface

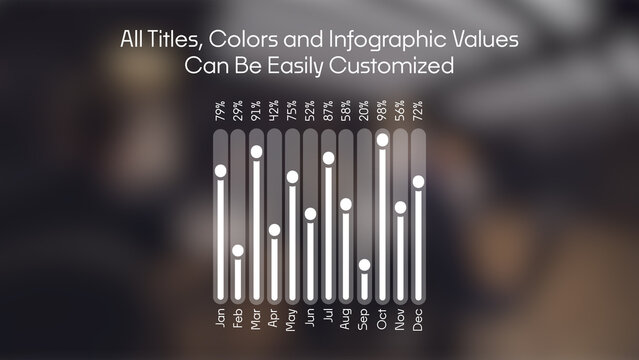
Infographic Clean Bar Chart
Circular Percentage Infographic with 3 Styles
Editable Modern Business Presentation Template Deck with Infographic Charts, Data Visualization Slides and Device Mockups.
Number Style Infographic Layout
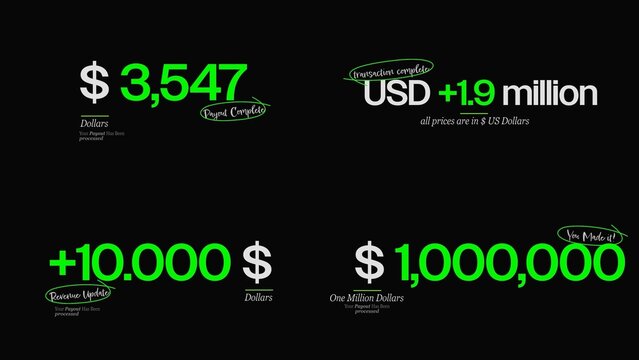
Currency Counters Text Animations | Animated money values, exchange rates & price displays for finance & banking.
Six Circles Chain Infographic
USA Map Infographic Layout
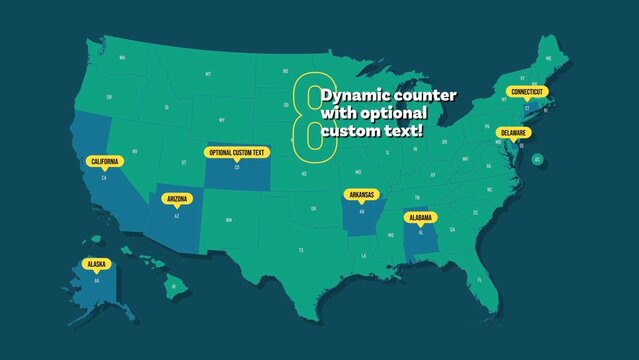
Interactive Animated US Map Template for After Effects with Dynamic State Counter and Custom Text and Color for Labels for All 50 States plus Washington DC Uses Essential Graphics Quick for Easy Edits
Project Case Study Design Template
Clean Real State Landing Page Design Wireframe
Process Flow Diagram Infographic Template Minimal Design
Clean Infographics Slide | Animated Data, Charts and Diagrams for Presentations
Project Case Study Report Template
Business Analysis Presentation Template, Corporate Report Deck, SWOT Strategy Pitch Slides

Response Rate Bar UI Card

Perspective Lab – Contemporary Explainer Video Title Sequence with Clean Typography for Analysis Content, Research Presentations and Editorial Media Projects
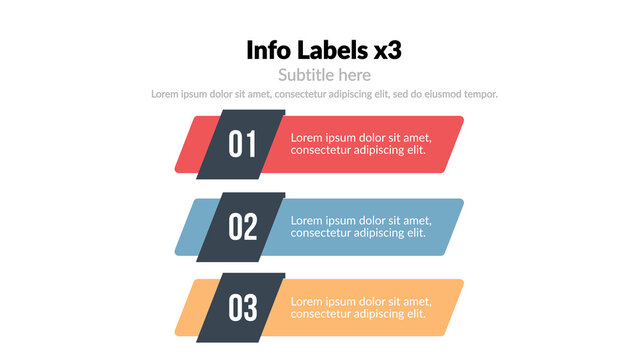
Info Labels X3 – Dynamic Callouts, Data Tags and Pointer Labels Animation, Modern Infographic Elements for Presentation and Interface Design
Social Media Report Presentation Template Design
Presentation Layout
Modern Dashboard UI Design with Analytics Cards, Employee List and Calendar Interface

Digital Urban Grid Animated Background (Customizable)

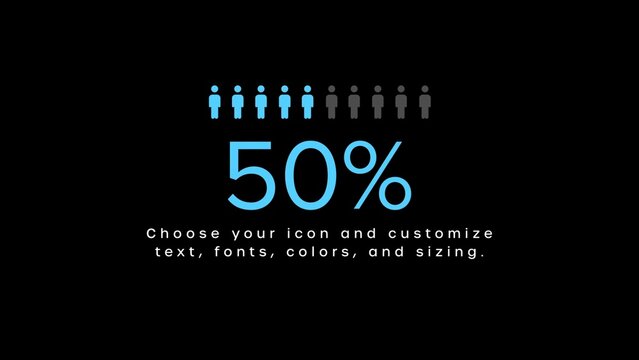
Round Percentage Counter with 3 Text Animations
Editable Business Timeline Infographic Template for Horizon PowerPoint Presentation Slides.
Business Project Infographic Layout

Network Titles
Bilateral Mobile Exchanges Infographic
Editable Infographic Ireland Map Layout
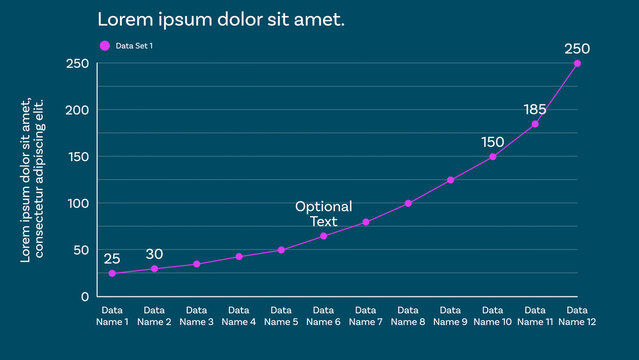
Responsive Line Graph for Clean and Modern Data Visualizations Design and Slide Presentations with up to 12 Animated Data Points and Optional Labels to show Percentages, Whole Values, and Custom Texts
Modern Business Goals Infographics with Target and Success Path
Clean And Minimal Real Estate Analytics Dashboard
Quarters Infographic with Photo Placeholders
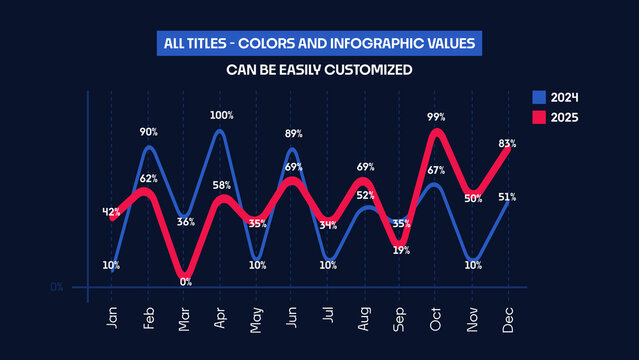
Animated Infographics Comparison Chart | Dynamic Line Graph for Business Finance and Marketing Data Visualization
Minimalist Project Schedule Timeline Infographic Template for Business Planning
Gantt Chart Template
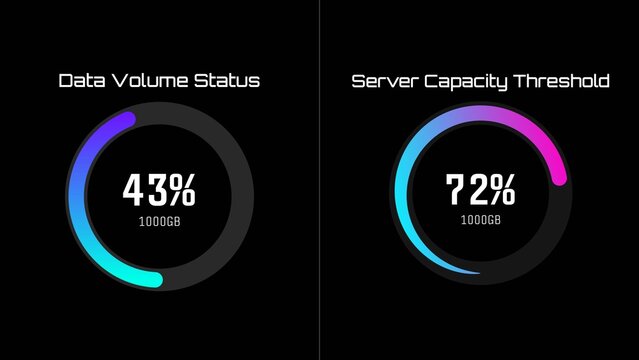
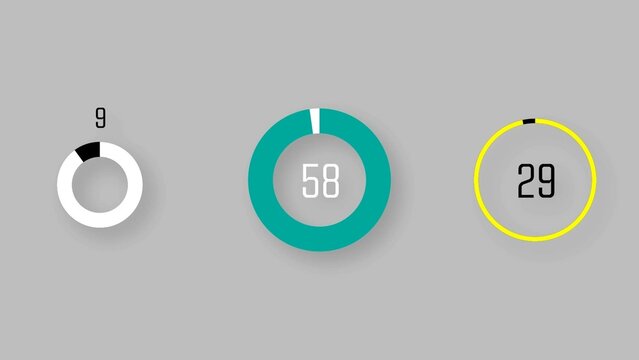
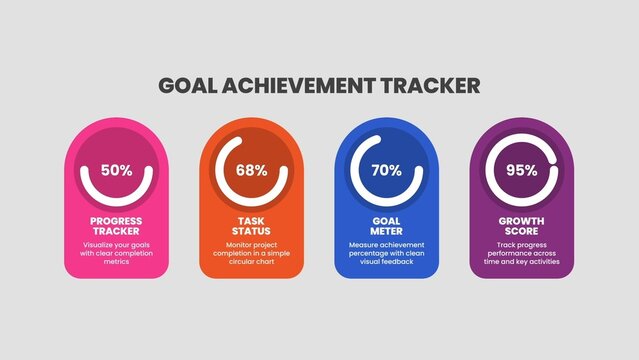
Modern Tech Circular Progress Infographic

Topic Tracker – Professional News Graphics Title Animation with Dynamic Typography for Current Events Coverage, Documentary Films and Informational Video Content

Premium Overlays HUD 7 – Futuristic Heads Up Display Effects, Sci-Fi Interface Overlays and Digital Technology Graphics for Video Editing
Process Flow Diagram Infographic Template with Arrows and Rounded
Minimal Presentation Template
Blue and Red US Election Infographic
Poppy Bright Donut Graph Clear Data Display Infographic
Infographic Maker with Percentage
Editable Modern Business Infographic Elements Template for Marketing Plans and Data Reports.
Clean Education Rules Infographic template
Bento Widget Infographic Tabs
Chain Line Breakdown Infographic
Africa Map Infographic Layout
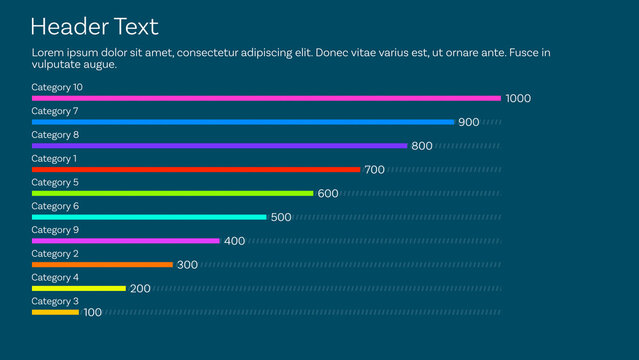
Horizontal Bar Chart for Design and Data Visualization Design and Slide Presentation and with 10 Animated Data Points + Responsive Custom Text + Color with Ordering Options and 3 Options for Bar Width
Project Schedule Timeline Infographic Template
Artificial Intelligence Infographics
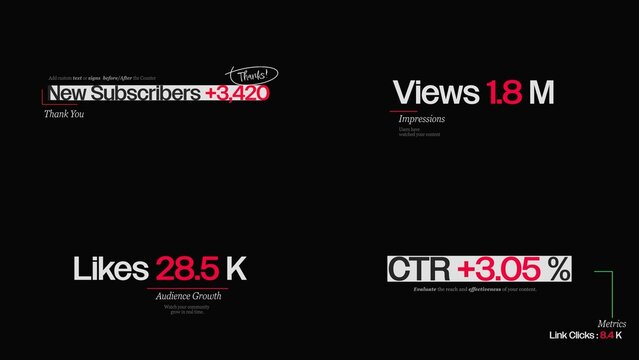
Social Engagement Counters Text Animations | Live count animations for likes, comments, shares & reaction totals.
Daily Data Infographics
Modern Corporate Annual Financial Highlight Report Brochure Template
Bento Box Business Infographic Template For Dashboard Report, KPI Metrics, Data Visualization

Customer Satisfaction Progress Bars

Trend Lens – Contemporary Trend Analysis Title Sequence with Clean Broadcast Typography for Market Reports, News Stories and Editorial Content

Premium Overlays HUD 8 – Futuristic Heads Up Display Effects, Sci-Fi Interface Overlays and Digital Technology Graphics for Video Editing

Modern Social Media Dynamic Grid Title in Horizontal Vertical and Square Formats
Four Directional Infographic Layout with 3D Arrows
Minimal Black and White Multipurpose Digital Presentation
Business Creativity Infographic Template with Minimal Illustration of a Pencil

Horizontal Bar Graph with Percentages
Editable Professional Business Infographic Elements Template for Data Visualization and Corporate Reports in White and Blue Theme.
Home Realestate Infographic Layout

Clean Modern Call Out Titles
Gradient Pathway Infographic
School Themed Infographic with Radar and Column Graph
Modern AI Dashboard UI Wireframe Design with Analytics Panels and Data Visualization Layout
Company Success Roadmap Infographic Presentation Layout
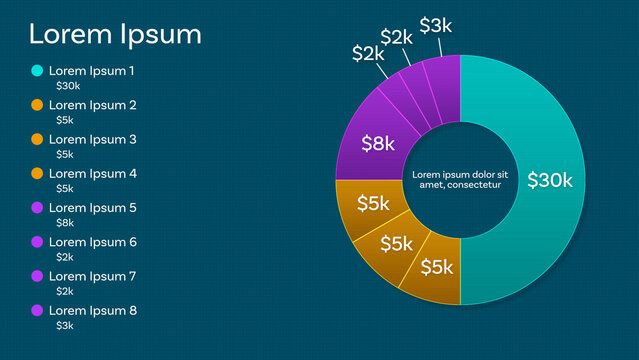
Responsive Pie Chart Mogrt for Clean and Modern Data Visualizations Design and Slide Presentation up to 8 Animated Data Points and Custom Text and Color with Percent Value Display Option and Paragraph
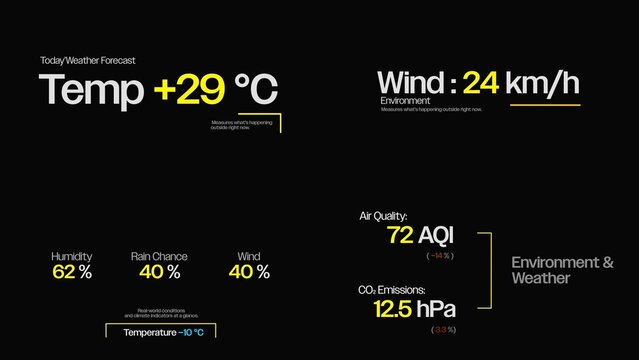
Weather Counters Text Animations | Animated stats for temperature, air quality, wind & climate forecast widgets.
Daily Data Comparison
Minimal Business Process Infographic Template