
Venn Diagram Infographic Template
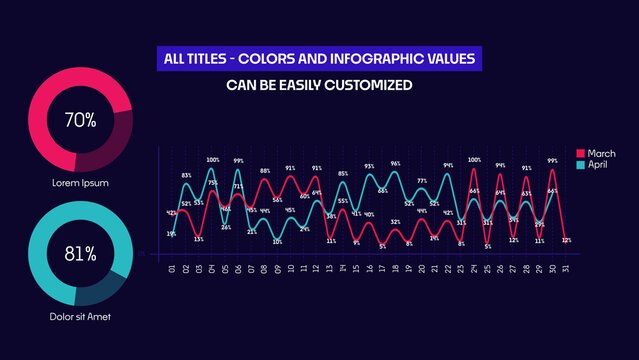
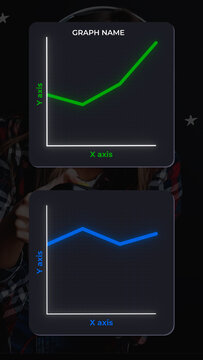
HUD Neon Infographics Curve lines x2 – Futuristic Sci Fi Data Interface, Glowing Digital Dashboard Elements, Cyberpunk Analytics Charts, Tech UI Visualization Pack

Social Media Report Presentation Template Design

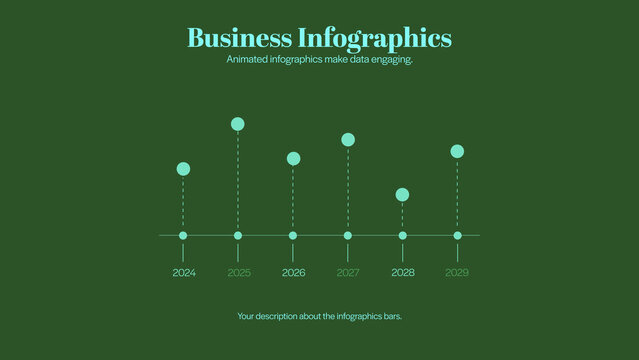
Business Growth Infographic Template with Illustration of Vision
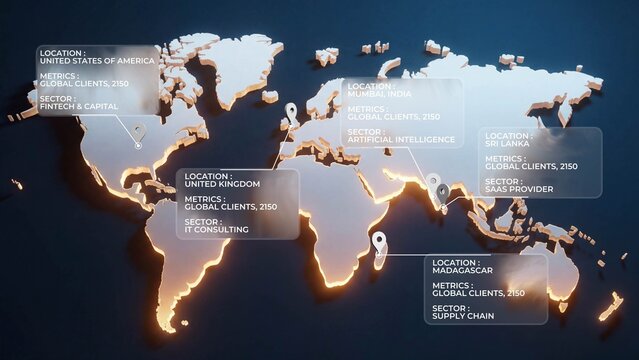
World Map Data Visualization

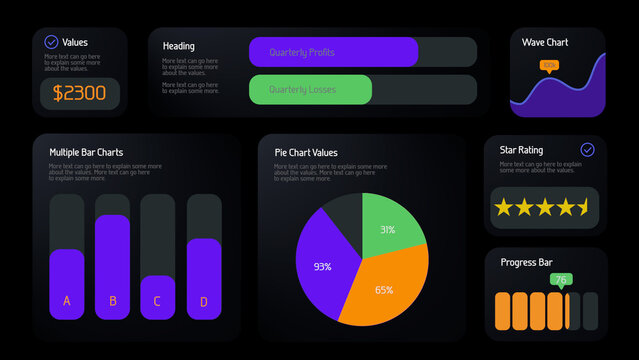
Modern Analytics Dashboard UI Design with Sales Reports, Charts and Business Statistics Interface
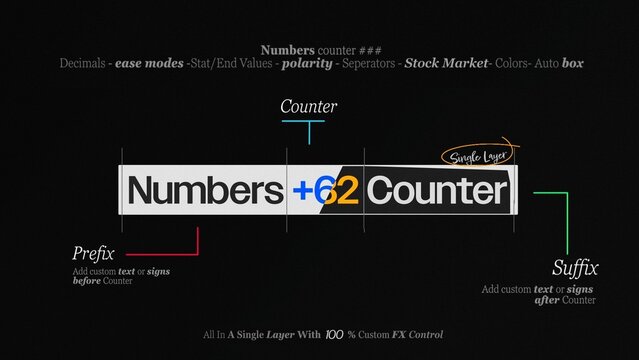
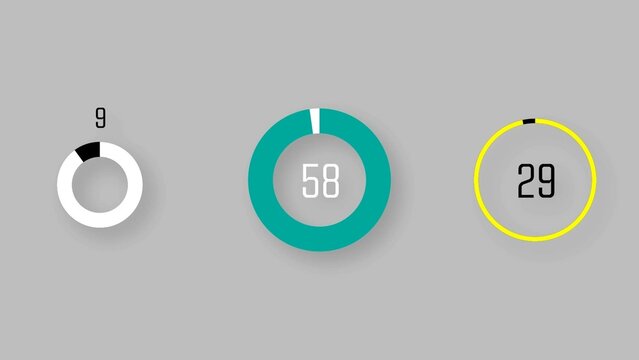
Number Counter Text Animation Maker | Universal Tool for count ups , countdowns , rolling percent stats and more

Modern Corporate Annual Financial Highlight Report Brochure Template

Annual Report Brochure Layout

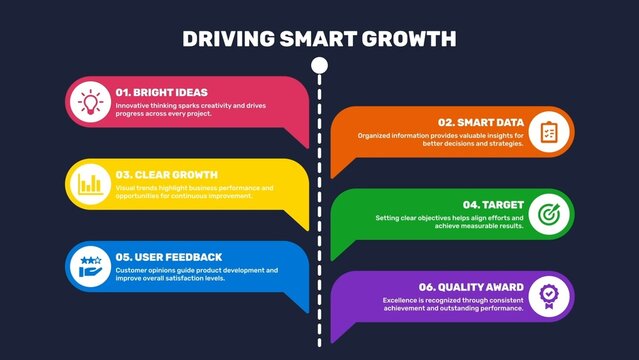
Modern Business Infographic Template with 6 Steps for Data Visualization

Brown Red & Green Agriculture Infographic

Tablet mockup showcasing nextgen banking dashboard UI in hands

Editable Business Timeline Infographic Template with 7 Alternating Steps and Project Management Icons.

Stat Infographic with Increase and Decrease

Modern Social Media Dynamic Grid Title in Horizontal Vertical and Square Formats
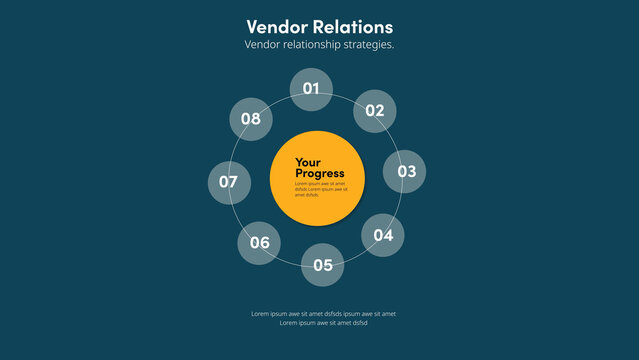
Vendor Relations | with Control Panel
Bento Widget Infographic Tabs
Daily Data Infographics

Mobile App Interface Display Mockup PSD
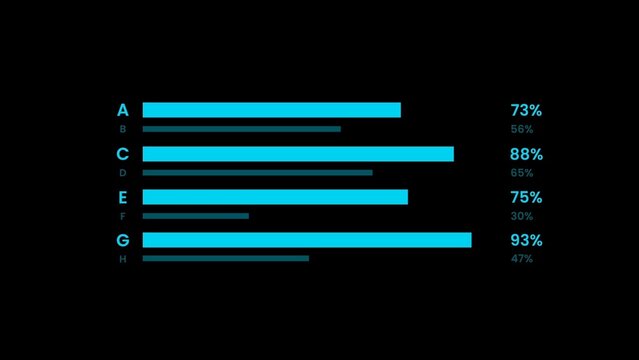
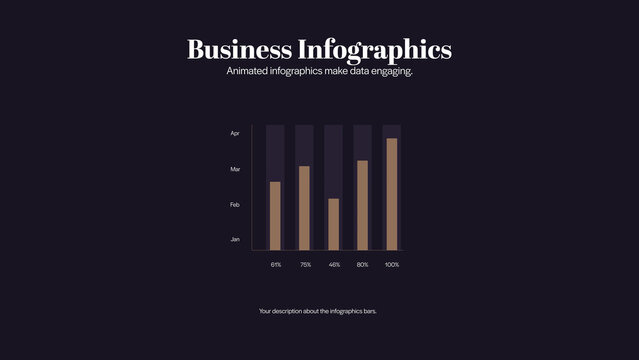
Infographic Clean Bar Chart

Guage Chart Infographic Template in Modern Minimal Style
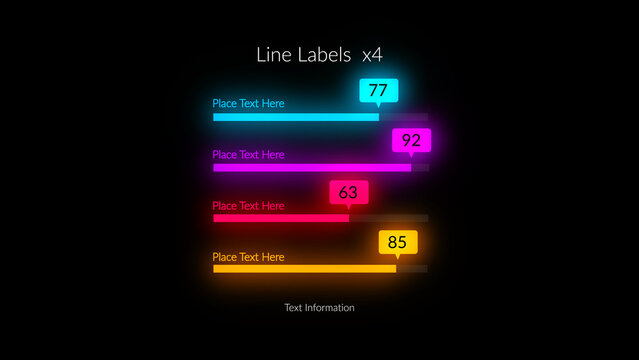
HUD Neon Infographics Lines Labels x4 – Futuristic Sci Fi Data Interface, Glowing Digital Dashboard Elements, Cyberpunk Analytics Charts, Tech UI Visualization Pack

Project Schedule Timeline Infographic Template

Business Map Infographics Presentation Design
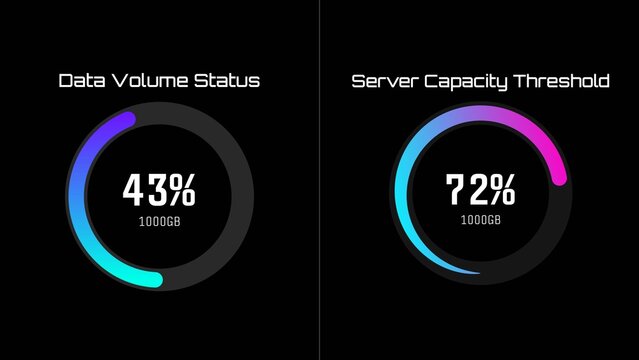
Modern Tech Circular Progress Infographic

Modern Dashboard UI Design with Analytics Cards, Employee List and Calendar Interface
Currency Counters Text Animations | Animated money values, exchange rates & price displays for finance & banking.
Minimalist Project Schedule Timeline Infographic Template for Business Planning
Process Flow Diagram Infographic Template Minimal Design
Colorful Data Visualization Infographic Table Design Template Layout with UI Elements
Light Tosca & Navy Newspaper Style Breaking Down Healthy Living Infographic
Clean And Minimal Real Estate Analytics Dashboard
Editable Medical Infographic Template with Human Anatomy Elements and Data Visualization Statistics for Healthcare Reports.
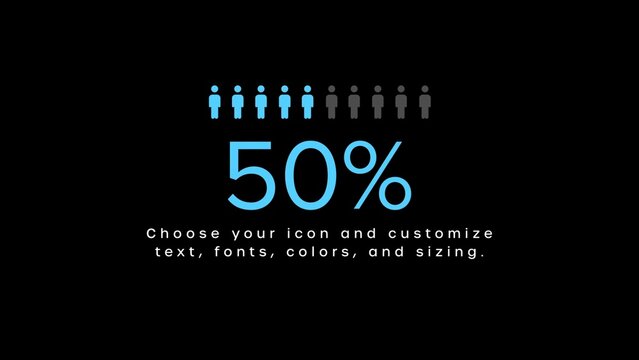
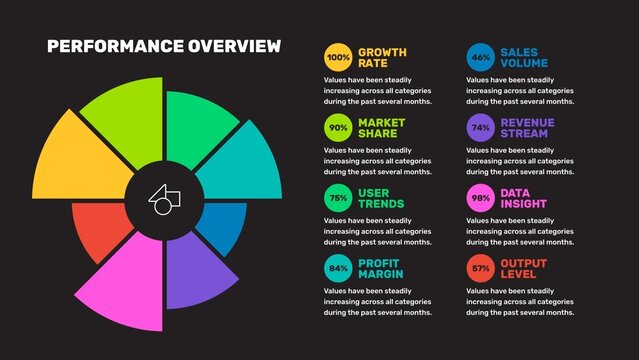
Infographic Maker with Percentage
Africa Map Infographic Layout
Economic Impact Visuals | 5 Different Resolutions with Control Panels
Roadmap Infographic Template in Modern Corporate Style for Business Presentations & Data Visualisation
Daily Data Comparison
Text Box Bars Infographic
Tree Branch Bubble Pop Up Data Info Steps Infographic
Gantt Chart Template
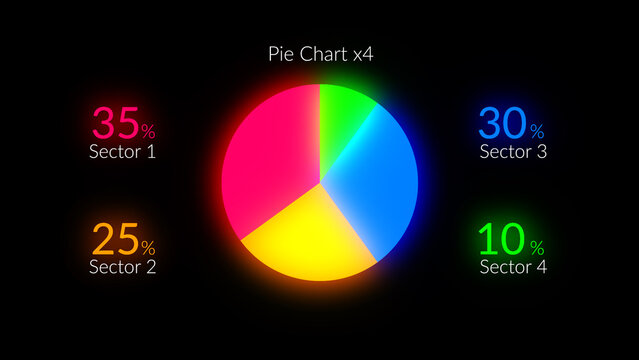
HUD Neon Infographics Pie Chart x4 – Futuristic Sci Fi Data Interface, Glowing Digital Dashboard Elements, Cyberpunk Analytics Charts, Tech UI Visualization Pack
Modern Business Goals Infographics with Target and Success Path
Infographic Layout For Five Steps
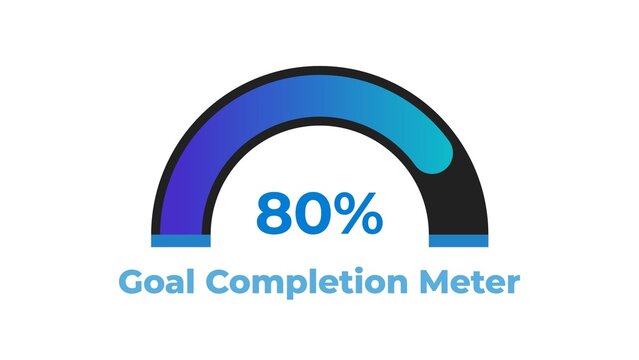
Goal Completion Progress Meter
Modern Dashboard UI Design Set with Analytics Widgets and Web Application Interface
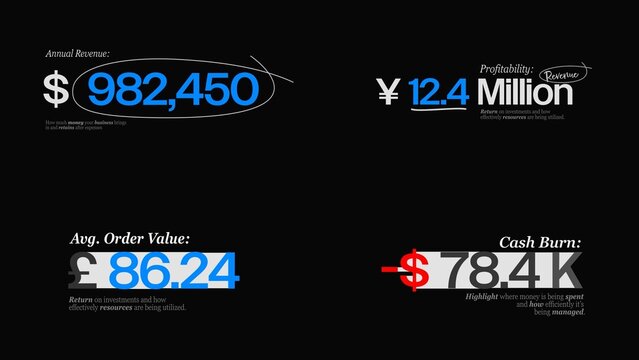
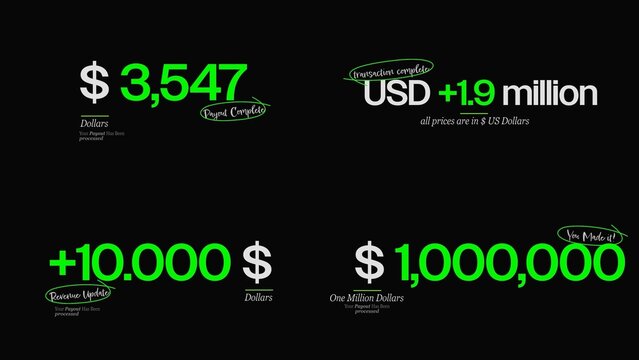
Finance Business Counters Text Animations | Animated KPI numbers for revenue, profit & corporate growth presentations.
Project Schedule Horizontal Timeline Infographic Template
Blue US Election Infographic
Business Creativity Infographic Template with Minimal Illustration of a Pencil
Beige Brown Agricultural Newspaper Style Infographic
Financial Analysis Mobile App Interface and Contactless Bank Card Mockup
Editable Business Timeline Infographic Template for Horizon PowerPoint Presentation Slides.
Circular Percentage Infographic with 3 Styles
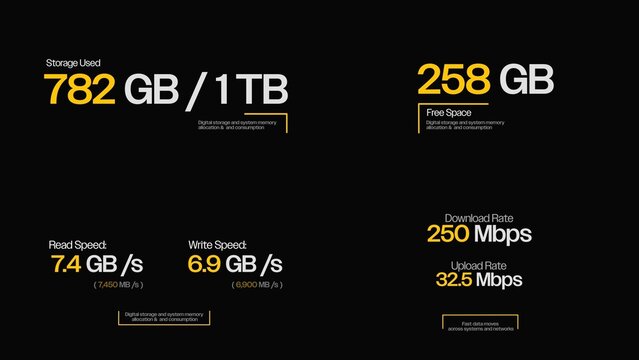
Editable Infographic Dashboard Layout with Dark Background
Business Model Adaptations | 5 Different Resolutions with Control Panels
Project Case Study Design Template
Clean Infographics Slide | Animated Data, Charts and Diagrams for Presentations
Mountain Goal Posts Infographic
Pie Chart Round Logo Data Sheet Infographic
Site Map Infographic Template
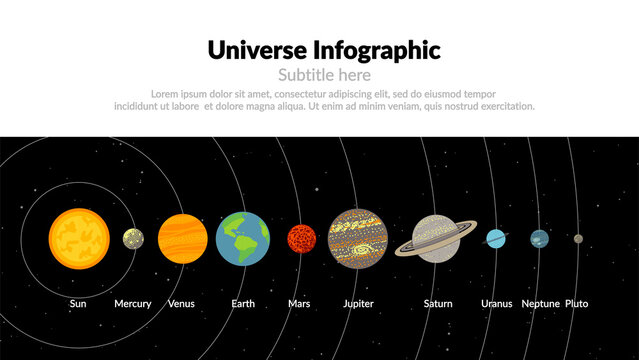
Universe 1 – Animated Space, Planets and Galaxy Data Visualization, Astronomy Infographic for Science, Education and Presentation
Company Success Roadmap Infographic Presentation Layout
Business Project Infographic Layout
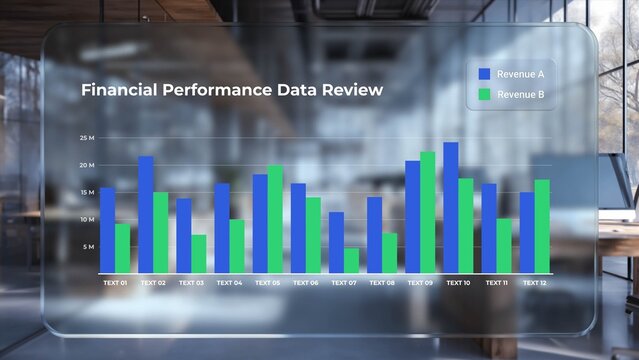
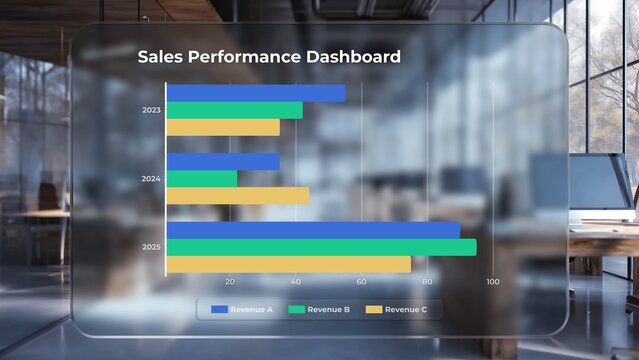
Glass Dashboard Bar Chart Infographic Template
Modern AI Dashboard UI Wireframe Design with Analytics Panels and Data Visualization Layout
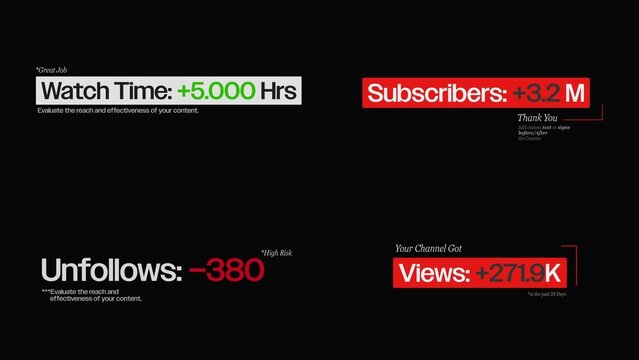
Social Analytics Counters Text Animations | Animated counters for follower growth, channel reach & subscriber views.
World Map Data Visualization Business Timeline Milestone Infographic Design Layout
Presentation Layout
Five Options Infographic Layout
Beige Blue Yellow Newspaper Style Social Media Infographic
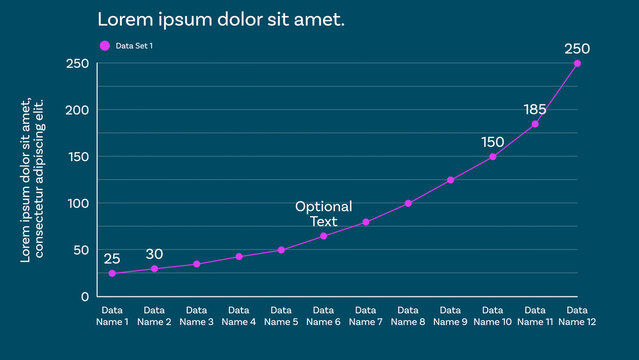
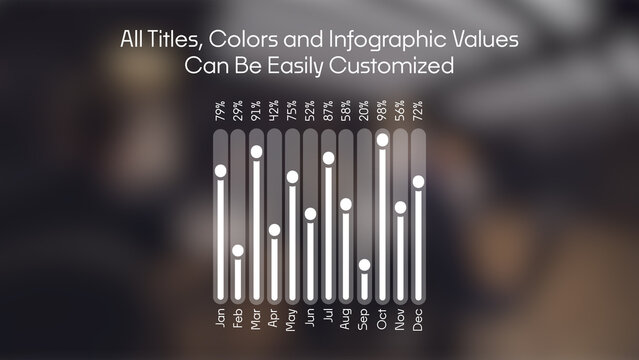
Responsive Line Graph for Clean and Modern Data Visualizations Design and Slide Presentations with up to 12 Animated Data Points and Optional Labels to show Percentages, Whole Values, and Custom Texts
Editable Horizontal Train Journey Timeline Infographic Template with 6 Yearly Milestones and Milestone Pins.

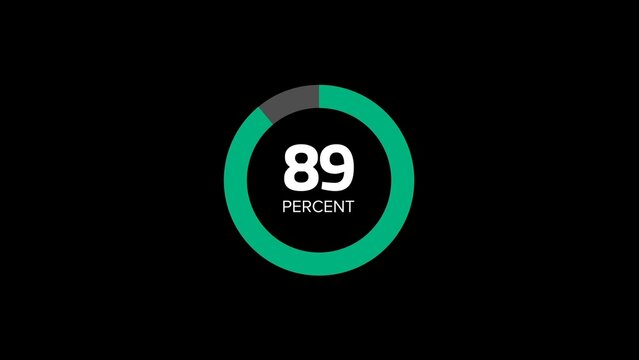
Round Percentage Counter with 3 Text Animations
Insights Study Infographic with Blue and Yellow Accents
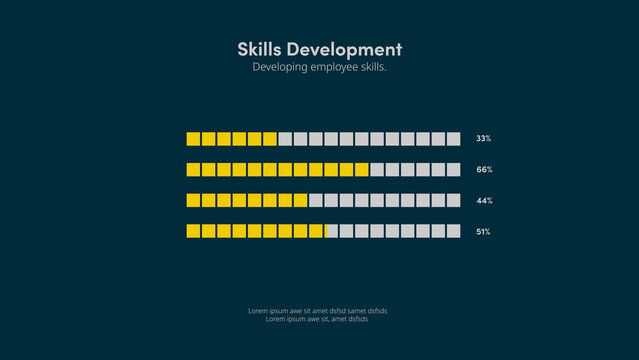
Skills Development | with Control Panel

Network Titles
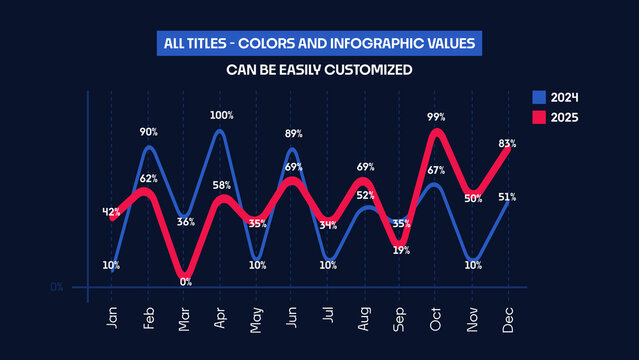
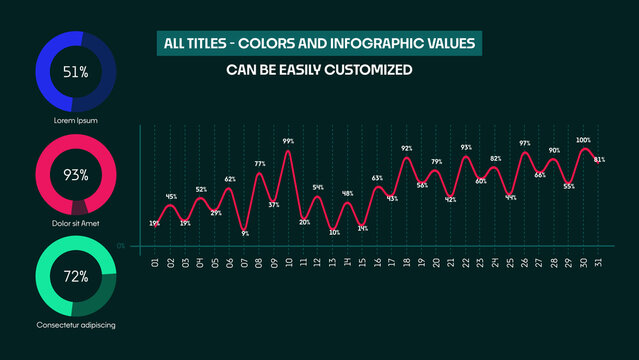
Animated Infographics Comparison Chart | Dynamic Line Graph for Business Finance and Marketing Data Visualization
Speech Bubble Lines Infographic
Resume Presentation Template
Mind Map Infographic with Cute Education Style for School Teachers and Lesson Presentations
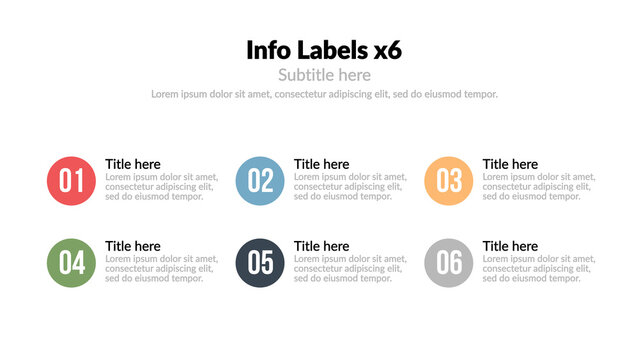
Info Labels X6 – Dynamic Callouts, Data Tags and Pointer Labels Animation, Modern Infographic Elements for Presentation and Interface Design
Minimal Iceberg Infographic Design for Business Data Visualization
Physical Health Data with Talk Bubble Element Infographic
FREE
Glass UI Business Analytics Chart
Blue and Red US Election Infographic
Digital Network Counters Text Animations | Fast digital tickers for bandwidth, latency & server status HUDs.
Minimal Business Process Infographic Template
Minimal Presentation Template

Digital Urban Grid Animated Background (Customizable)
Vertical Timeline Layout with Hexagon Shapes Elements
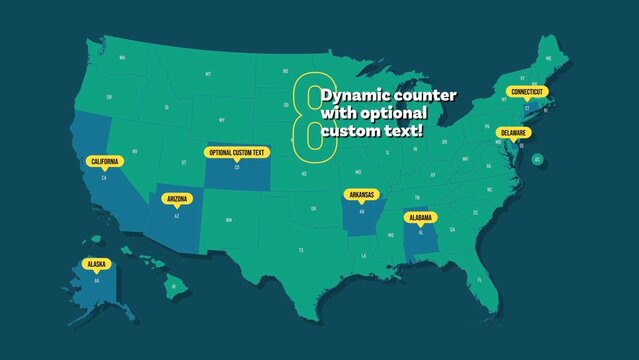
Interactive Animated US Map Template for After Effects with Dynamic State Counter and Custom Text and Color for Labels for All 50 States plus Washington DC Uses Essential Graphics Quick for Easy Edits
Editable Business Timeline Infographic Template with Colorful 5 Steps Process for Horizon PowerPoint Presentation Slides.
Mobile App User Interface Design Templates For Data Visualization And Chat Messaging
Annual Report Recommendations Infographic Layout
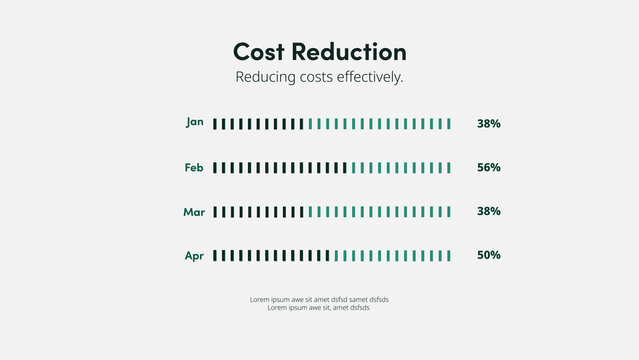
Cost Reduction | with Control Panel
Mini Line Graph For Data Analytics And Trends Forecast
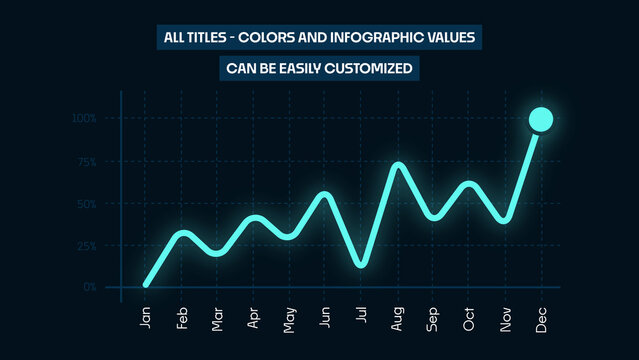
Animated Line Chart Infographics | Business Data Visualization and Analytics Graph
Comparative Switch Lines Infographic
Circular Percentage Infographic with 3 Styles