Электронное письмо с подтверждением и ссылкой для установки пароля отправлено по адресу Для доступа к покупкам в будущем вам понадобится пароль.
Получите 10 изображений Stock с бесплатной пробной версией
Добавлены новые фильтры
Сортировать по

965 845 результатов по запросу «video caption» в категории «все»

Результатов в видео: 314 928
mogrt Text Transition Template

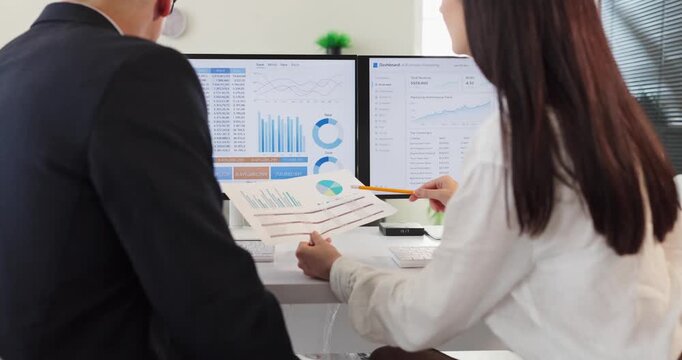
A person is using a laptop to view financial charts and graphs. The screen displays various data visualizations, including bar charts and pie charts.
00:08
HD
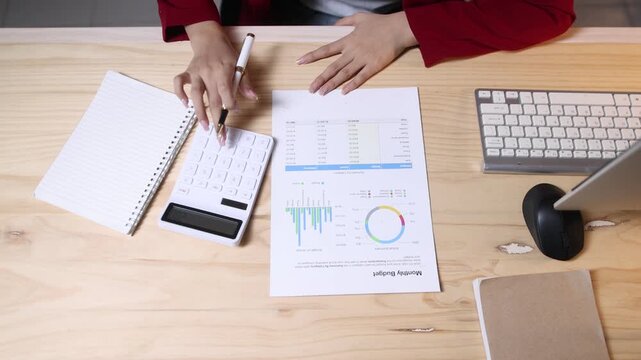
Female professional accountant conducting detailed financial analysis, meticulously reviewing budget reports with charts and calculator on wooden workplace surface.
00:20
HD
AI SEO assistant data, Futuristic digital finance growth chart data analysis technology background neon green glowing line graph stock market business success trend
00:06
HD
Business team discussing financial charts and data on a digital tablet during a meeting in a modern office corporate strategy, and teamwork.
00:19
HD
Holographic business data analytics hologram in hand, Business person holding a glowing digital hologram interface with charts animation, icons and data analytics against a dark background.
00:09
HD
A human hand reaches out to a robotic hand, engaging with a holographic interface displaying digital data and growth metrics, symbolizing collaboration between technology and business. Copula
00:10
HD
Abstract digital arrow pointing upwards, representing growth and progress in the future
00:08
HD
Scientists in a laboratory examine a sample vial while viewing dna sequence data and genetic charts on computer screens.
00:16
HD
Business analytics dashboard with moving line chart, donut chart and bar graphs seamless loop, data visualization and reporting animation
00:06
HD
YouTube Video Player Interface HUD Animation with Play Pause, Volume, Captions, Settings, Theater and Fullscreen Controls on Green Screen
00:30
HD
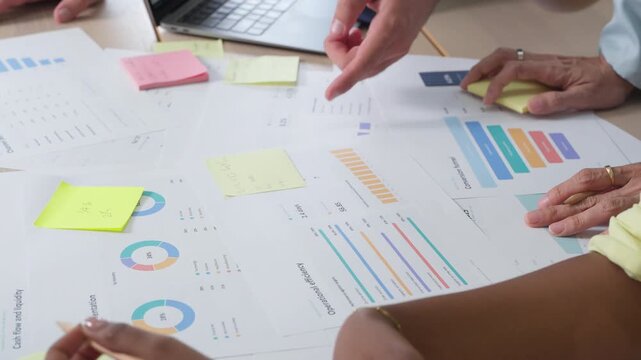
A detailed view of hands on a laptop and paperwork, colleagues collaborating over data charts in a fast-paced office meeting.
00:15
HD
prproj Text Animation
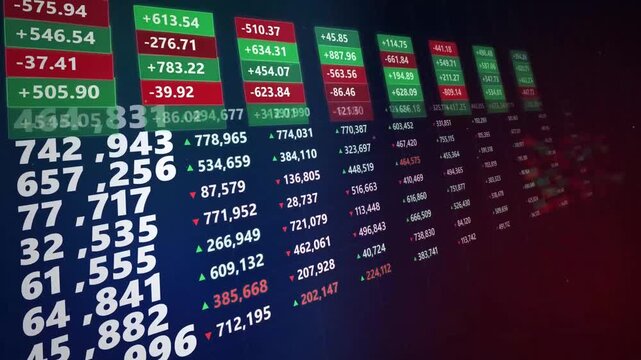
Abstract stock market digital display showing green and red financial data, trading indices and stock price fluctuation charts
00:10
HD
Rising financial chart across a glowing digital grid for market analysis. Financial presentations, investment analysis, and trading platform promotion.
00:10
HD
Vintage silent movie caption cards. Set of vintage silent movie frame caption cards with old film effects and scratches. 5 sets vintage ornate frame styles. 4k video
00:50
HD
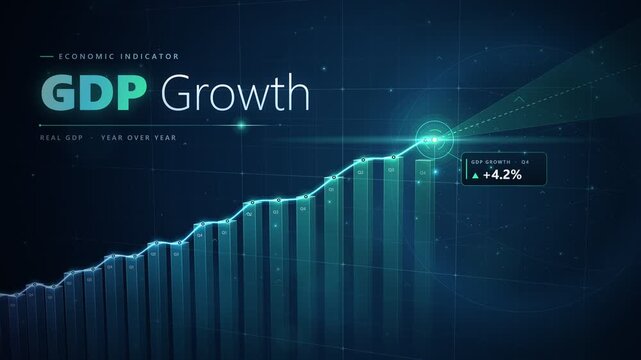
GDP growth economic indicator chart with rising bar graphs and HUD radar
00:15
HD
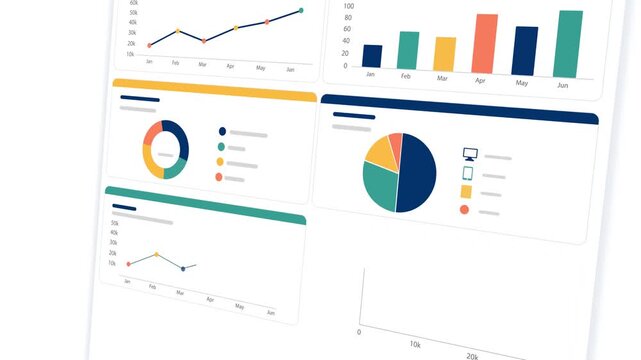
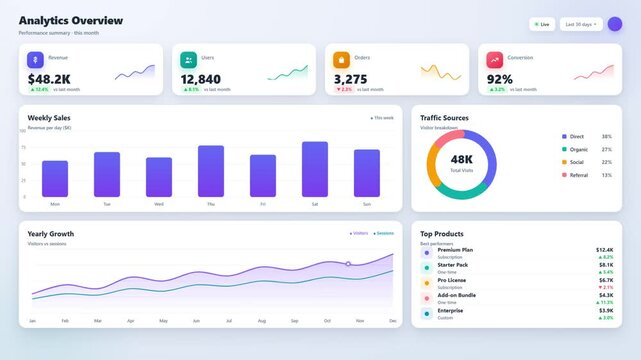
Modern Business Analytics Dashboard Animation with Multiple Data Visualization Panels like Charts, Graphs,  KPI Widgets, And Financial Statistics In A Clean Flat Design. Professional Website Metrics
00:49
HD
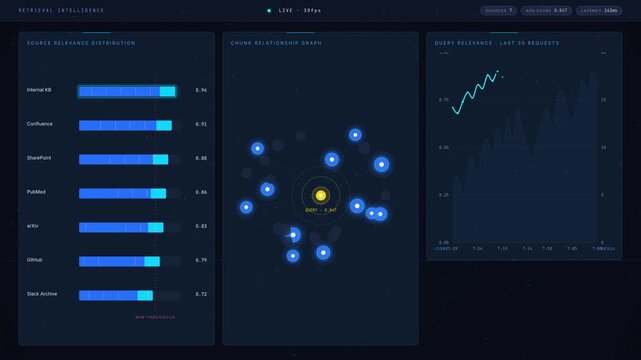
Explore a cinematic dark-mode analytics dashboard displaying relevance scores across various knowledge sources with vibrant visual elements and engaging animations.
00:15
HD
Analytics dashboard interface showing revenue charts user metrics and traffic data visualization
00:10
HD
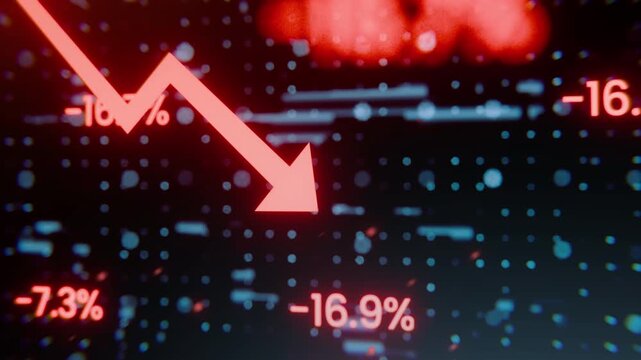
Glowing red neon downward graph with arrow indicating decline, loss, and negative trends on a dark, abstract background, perfect for conveying risk, crisis animation.Right-directional arrow loop.4k
00:10
HD
Stock Market monitor screen while open market for trading sell and buy stock online. Business economic and finance concept.
00:22
HD
Red professional video camera silhouette icon with red record dot on black background animation
00:10
HD
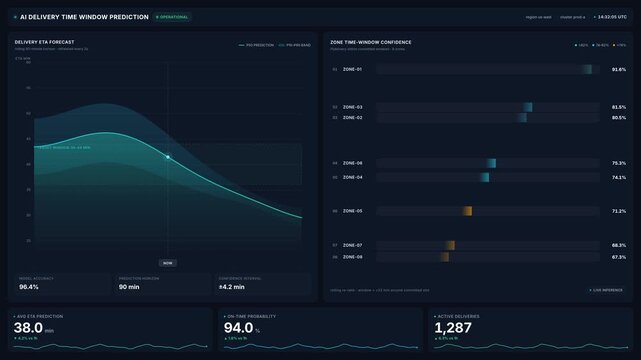
Futuristic 4k data dashboard for ai delivery time window prediction charts zone confidence metrics, for logistics optimization, supply chain analytics, automated
00:20
HD
Hand-drawn animated angled speech bubble in white outline on chroma key green screen background, perfect for adding your creative text, dialogue, and comic-style captions to dynamic footage.
00:05
HD
Industrial business concept with rising financial graph overlaying oil refinery plant at night. Symbolize increasing oil prices, refinery operating costs and growth in global power and energy sector.
00:18
HD
Analysts teamwork discuss finance data and dashboard. Colleagues review charts on computer screens and printouts, aligning analytics with metrics. Concept image of collaborative office analysis.
00:11
HD
Dynamic business foundation digital interface featuring animated infographic global corporate strategy financial growth charts, and futuristic hud technology for presentations
00:10
HD
Real time performance monitoring dashboard with animated bar charts and key business indicators.
00:11
HD
aet Colorful Title
Hands typing on laptop with data charts and security icons overlay showing analysis, statistics, and technology insights in a dark modern workspace Gluon.
00:10
HD
Animated video camera icon with blinking red recording dot on black background. Motion graphic for live stream, video camera symbol, REC indicator, media player UI, and overlay asset.
00:10
HD
prproj Corporate Text Animation
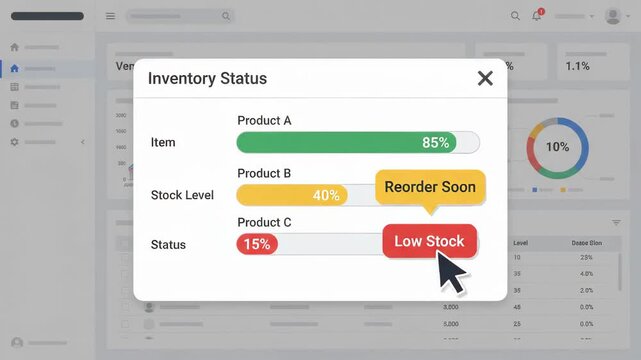
inventory status modal displays progress bars for various products on top of blurry professional business dashboard interface showing data analytics and charts
00:06
HD
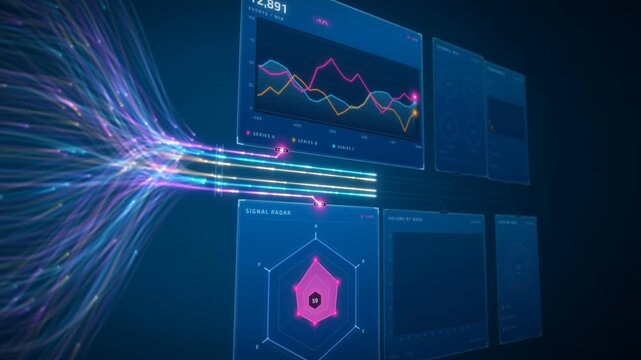
Data flow streams converging into a live analytics dashboard with radar chart, bar graphs and system load
00:16
HD
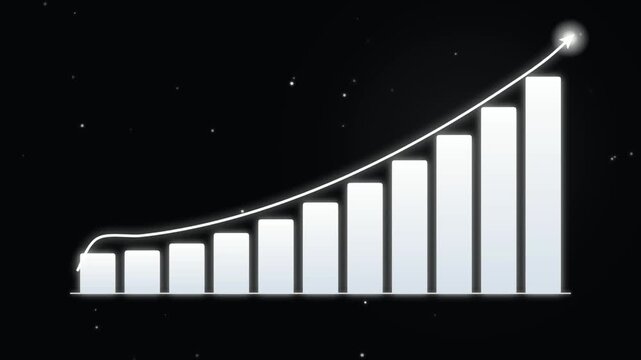
Glowing white financial bar charts rising upwards on black space
00:08
HD
Financial dashboard analytics chart growth business motion graphic
00:06
HD
Stock Market Chart, Beautiful 3d Animation of Japanese Candlestick Graph in Time Lapse. Seamless Looping Ultra HD 4K 3840x2160
00:30
HD
Investment growth chart with rising bar graph and coins animation. Vertical video
00:06
HD
white professional video camera silhouette icon with red record dot on black background animation
00:10
HD
Modern social media analytics dashboard visualizing impressions, engagement metrics, platform performance, and audience growth through animated charts and business intelligence data.
00:08
HD
stock market chart
00:14
HD
Dark neumorphic isometric dashboard featuring a 3D solid donut chart with pre-spaced segments that expand further apart with floating HUD labels in Scene 1 and clean rising 3D bar charts in Scene 2.
00:10
HD
mogrt Animated Captions
A line chart displays data trends with bars of different colors. Each bar is labeled with AI. The chart shows an upward movement over time.
00:10
HD
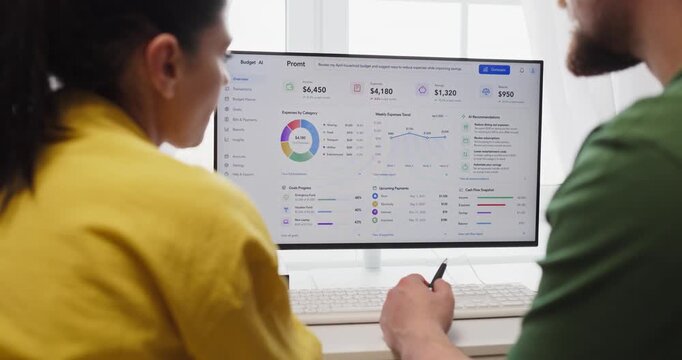
Couple budget planning on finance dashboard online. They review savings and monthly expenses on a computer at home using charts analytics for smarter choices. Clear concept of home finance teamwork
00:08
HD
Abstract finance animation with various charts and graphs on a dark blue background.
00:10
HD
Wide panoramic wall of wireframe bar charts overlaid with multiple colored wave trend lines scrolling sideways
00:10
HD
Abstract Financial Stock Market Charts Displaying Multiple Rising Trends Over Dark Background
00:20
HD
mogrt Motion Text | Minimalist Clean Typography Modern Stylish Titles Lower Thirds

Finance growth chart graph stock market upward data analysis business abstract background with rising green line over bar graph showing market trend investment statistic concept digital chart
00:10
HD
Agentic ai multi agent collaboration workflow diagram with data input process analysis and auto optimize concept for future technology modern office
00:08
HD
aet Clean Lower Third Title

Abstract digital candlestick chart with global financial data background, perfect for trading, forex, crypto, and investment presentations. Financial Investment Background. 3d Rendering.
00:20
HD
Stock market candlestick chart hologram on digital world map,global financial index analysis,business economy investment.Global market analysis world map with stock market graph overlay animation
00:15
HD
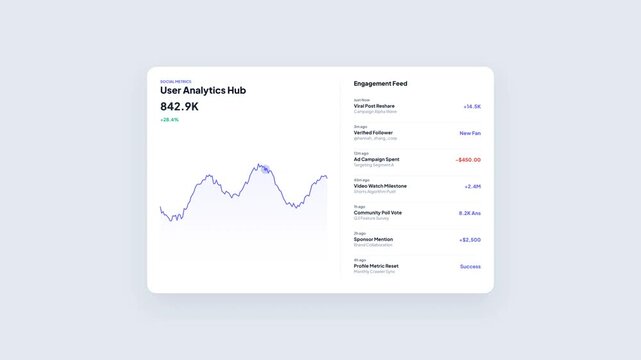
User Analytics Hub Marketing Social Performance Dashboard with Moving Line Graph Trend and Engagement Feed Activity Stream Notification Animation
00:08
HD
Financial graph chart, market report, arrow up trend chart stock exchange asset, diagram investment capital gain world money economic growth
00:20
HD
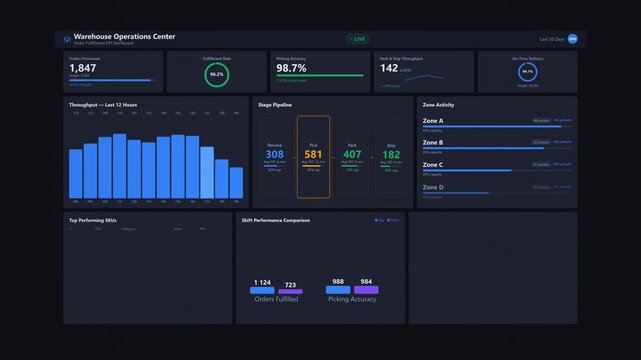
Warehouse order fulfillment dashboard: animated inventory operations tracker with pick rate metrics, shipment status breakdown and daily throughput performance visualization
00:10
HD
Animated business dashboard with bar charts donut graphs and trend lines overlay
00:10
HD
AI SEO assistant data, Financial growth stock market business chart green arrow success investment profit digital graph upward trend economy business growth chart financial
00:08
HD
Dynamic stock market chart with candlestick patterns and real-time financial data on a digital screen ideal for illustrating investment trading and economic analysis
00:08
HD
Retro video capture interface with digital timecode and pink frame overlay
00:10
HD
Slow Dolly-in Through a Stock Exchange Asset Management Firm, Where a Stockbroker Ceo Studies Live Charts, Weighing Banking Decisions, Strategy and Capital Growth for Corporate Career Success
00:13
HD
Digital line graph tracks upward moving corporate revenue. Interactive line graph demonstrates successful financial forecasting. Economic growth concept with corporate line graph.
00:10
HD
Dual neon red and cyan stock price line charts with numeric data labels crossing over a dark grid
00:12
HD
Seamless looped abstract visualization of financial data, price fluctuations, investment analysis and trading activity. Financial market interface with changing charts. Forex trading concept
00:10
HD
Animated video camera icon with blinking red recording dot on white background. Motion graphic for live stream, video camera symbol, REC indicator, media player UI, and overlay asset.
00:10
HD
prproj Animated Typography
Silhouette of a witch walking with a staff through a foggy night forest. Spooky atmospheric tension and mysterious seasonal journey. Halloween 2026 eerie holiday banner and dark fantasy.
00:10
HD
mogrt Minimal Editorial Typography - Professional minimal editorial text animation with clean modern layouts for fashion promos, cinematic intros and branded videos
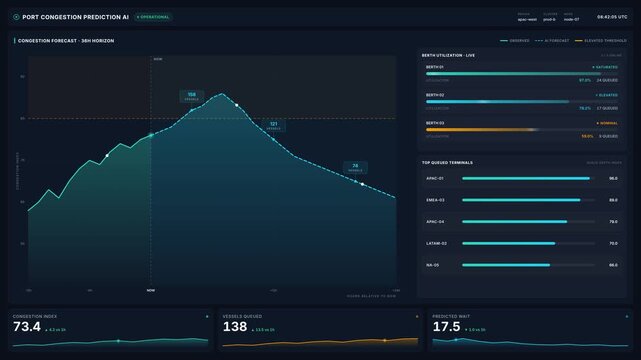
Port congestion prediction ai dashboard for vessel queue forecast berth utilization charts, for smart logistics, supply chain analytics, maritime data insights
00:20
HD
Red downward arrow symbolizing economic decline, ideal for financial reports, presentations, articles, and social media posts on negative trends.
00:08
HD
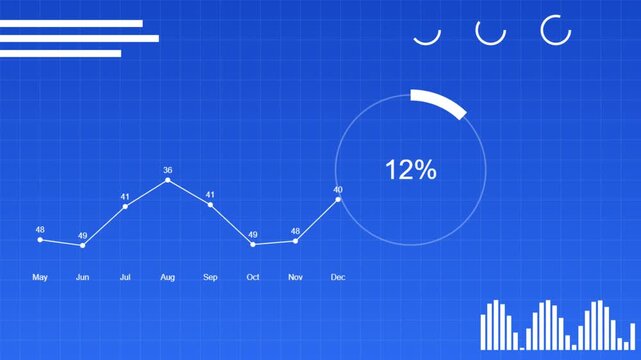
Data analytics dashboard motion graphics displaying financial growth charts and dynamic percentage indicators in blue video footage
00:08
HD
White goodbye text animation appearing on a solid green background
00:08
HD