Электронное письмо с подтверждением и ссылкой для установки пароля отправлено по адресу Для доступа к покупкам в будущем вам понадобится пароль.
Получите 10 изображений Stock с бесплатной пробной версией
Добавлены новые фильтры
Сортировать по

18 519 результатов по запросу «speedometer graph» в категории «все»

Результатов в видео: 1 792
Business Data Dashboard Interface with Animated Financial Performance Metrics and Risk Gauges
00:10
HD
Animated sentiment analysis dial gauge with needle live text feed, for real-time text intelligence, emotion detection, live market signal monitoring dashboard
00:20
HD
Speedometer dashboard interface with neon glowing gauges and telemetry data display for futuristic vehicle technology
00:10
HD
dashboard speedometer data graph analytics monitor HUD motion graphic
00:06
HD
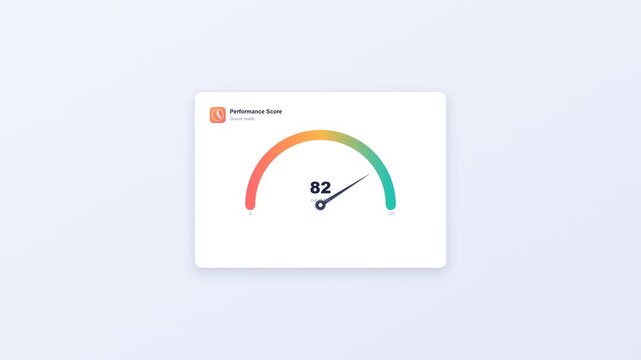
Performance Score Gauge Meter Dashboard Widget User Interface Element with Dial and Arrow
00:08
HD
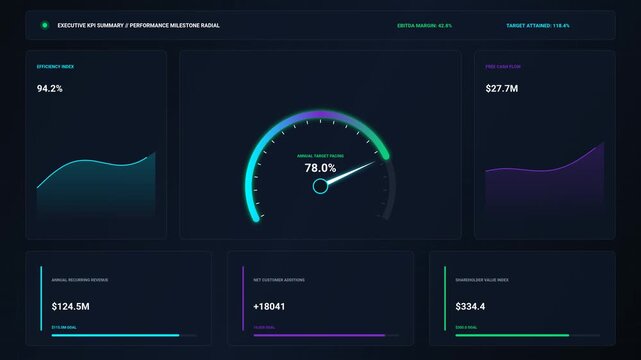
Modern Business Intelligence KPI Dashboard with Radial Performance Gauge
00:10
HD
Digital speedometer gauge with needle pointing upwards on black background, representing speed and performance metrics
00:08
HD
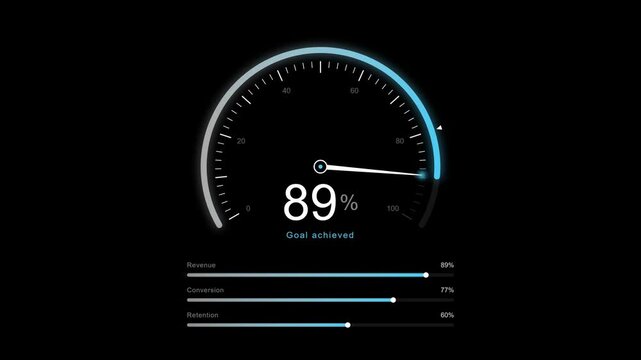
A professional business dashboard infographic featuring a circular speedometer gauge showing thirty-eight percent progress with blue accents on a dark black background for data analysis.
00:10
HD
Performance gauge meter animation showing decreasing efficiency and speed levels with color-coded segments on white background
00:16
HD
Angled fear and greed gauge with swinging needle seamless loop
00:25
HD
Futuristic HUD digital dashboard showing wind speed speedometer and telemetry history graph with neon yellow glowing elements for weather data tracking
00:10
HD
Color gradient motion graphics gauge meter scale showing low to high level indicator dial graphic for risk score presentation on dark background
00:05
HD
Futuristic HUD dashboard interface with speedometer gauge animation
00:06
HD
Digital roas performance gauge showing marketing return on ad spend. 4K Video
00:15
HD
Digital gauge showing progress from 1 percent to 97 percent and then slightly down to 95 percent with an upward arrow indicating growth
00:10
HD
Animated speedometer gauge with a sweeping needle with alpha channel
00:10
HD
Speedometer Needle Fluctuation on White Background Animation.
00:10
HD
dashboard, analytics, technology, ui, ux, interface, hud, data, chart, graph
00:06
HD
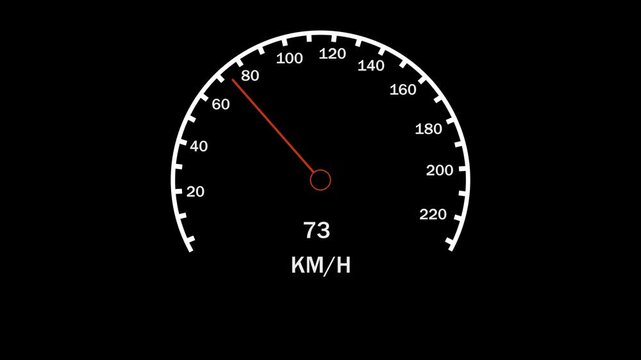
Digital speed meter animation, Speedometer Display on Black Background, speedometer HUD UI element animation. The arrow moves realistically.
00:15
HD
Animated Semicircular Gauge Meter Card on Green Screen
00:08
HD
Grid of Six Speed Meters Performance Level Animation
00:08
HD
Risk icon on speedometer. High risk meter. Motion graphics.
00:08
HD
Colorful digital speedometer gauge graphic animation showing high performance and efficiency levels in modern video clip
00:11
HD
Risk speedometer icon or sign of different colors with black arrow. Motion graphic 60 FPS Blue Background Removable
00:10
HD
Animated Data Dashboard with Gauge and Bar Charts
00:08
HD
Low-normal-high gauge video animation
00:09
HD
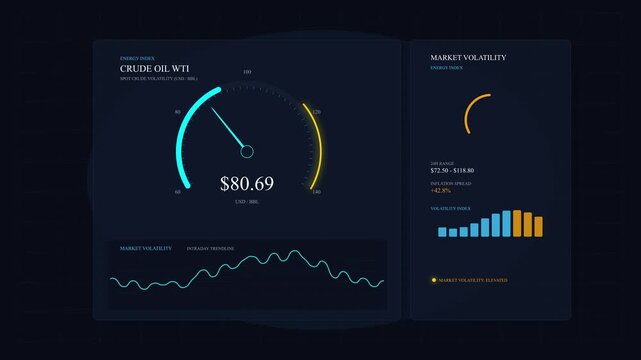
Market volatility gauge graph
00:11
HD
Neon gauge speedometer and bar graph rising arrow animation representing growth success... icon
00:08
HD