Электронное письмо с подтверждением и ссылкой для установки пароля отправлено по адресу Для доступа к покупкам в будущем вам понадобится пароль.
Получите 10 изображений Stock с бесплатной пробной версией
Добавлены новые фильтры
Сортировать по

136 156 результатов по запросу «interface statistic vector» в категории «все»

4 791 результат в видео
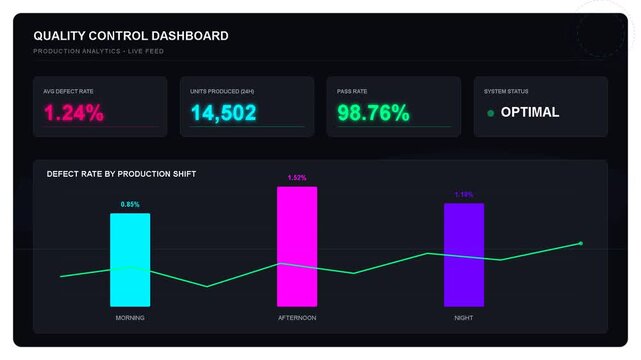
Dynamic 2d vector user interface dashboard with tactical hud elements and morphing charts
00:10
HD
Digital dashboard interface with animated data visualization charts and energy monitoring metrics
00:10
HD
Circular Progress Bar Graphic Featuring Twenty Five Percent Completion Indicator for User Interface
00:08
HD
futuristic ai automation dashboard interface with data analytics charts and progress indicators in red
00:09
HD
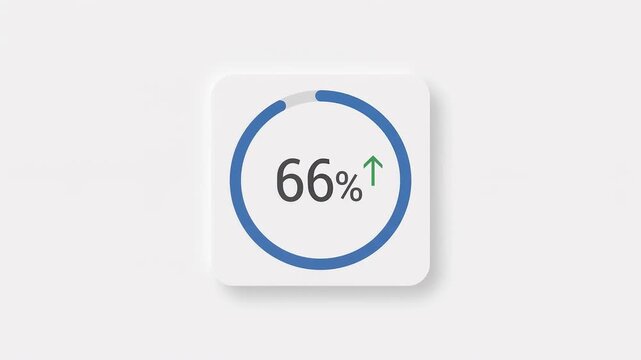
Percentage shows sixty six percent inside a circular progress ring graphic accompanied by a green upward arrow indicating positive performance growth rate.
00:10
HD
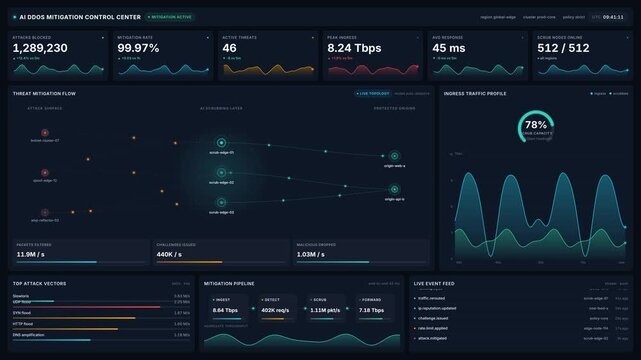
Advanced ai ddos mitigation control center dashboard for live threat neutralization, traffic graphs, attack vectors, for cybersecurity, network monitoring, system protection
00:20
HD
Data analytics dashboard panels on chroma key green background
00:12
HD
Futuristic HUD interface animation with morphing data charts and vector panels
00:10
HD
Set of glowing blue neon data charts and digital info graphs with futuristic interface elements
00:10
HD
Modern abstract bar chart interface on dark blue background
00:12
HD
A digital collaboration invite expands as network nodes emerge from a central profile icon on a dark monitor display with changing analytical data panels below
00:06
HD
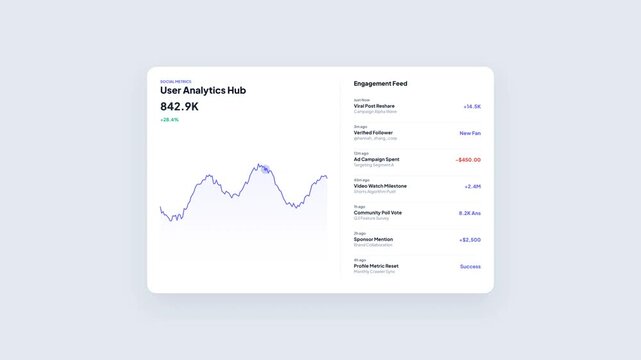
User Analytics Hub Marketing Social Performance Dashboard with Moving Line Graph Trend and Engagement Feed Activity Stream Notification Animation
00:08
HD
Modern UI vector animation displaying dashboard analytics interface with interactive charts and search magnifying glass graphic
00:11
HD
Futuristic digital dashboard interface displaying green vector charts
00:10
HD
dynamic data visualization interface featuring bar charts and interactive infographics for business intelligence analysis, dashboard monitoring, reporting, financial metrics, performance tracking
00:09
HD
Digital HUD interface with animated charts and data visualization
00:10
HD
Pressure gauge needle rising to maximum capacity
00:15
HD
Digital displays showing an agile backlog provide a neon interface for tracking progress across multiple data tiers in a sleek modern software monitoring system
00:06
HD
Futuristic digital HUD interface showing analytical data and graphs
00:10
HD
Digital data dashboard interface with neon bar charts and line graphs showing performance metrics and statistical progress analysis
00:08
HD
Financial growth dashboard interface with line graph and chart analytics vector illustration concept
00:10
HD
Digital data flow and data transfer animation with ui interface nodes
00:06
HD
Digital fundraising goal progress circle with amount displayed
00:12
HD
Futuristic UI dashboard interface on green screen. Digital data visualization window. Modern software analytics panel for tech presentations.
00:08
HD