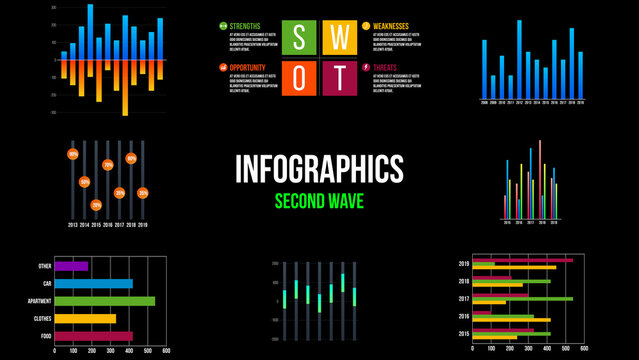
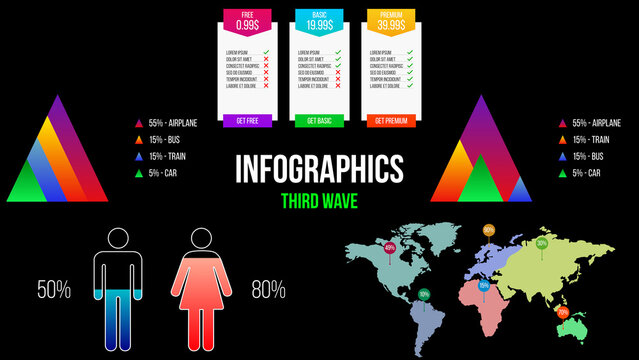
8 Infographics Elements


8 Infographics Elements


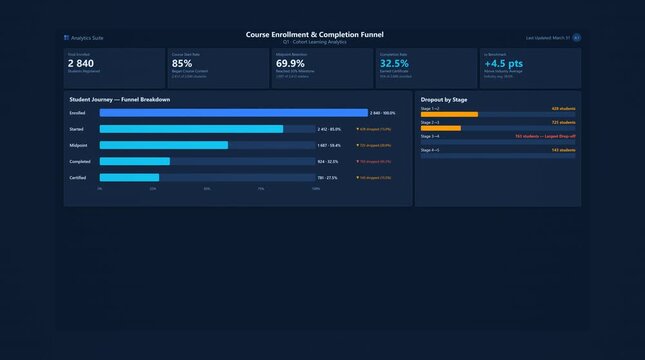
Colorful Data Visualization Infographic Table Design Template Layout with UI Elements
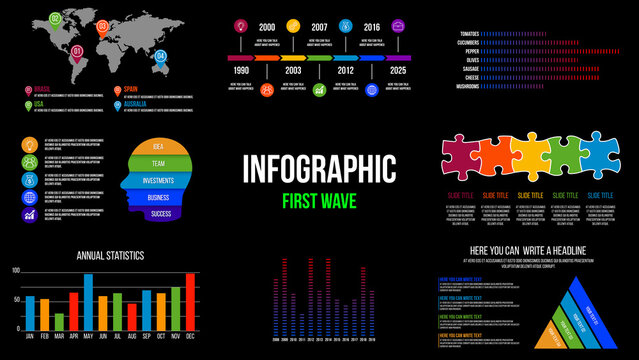
5 Infographics Elements
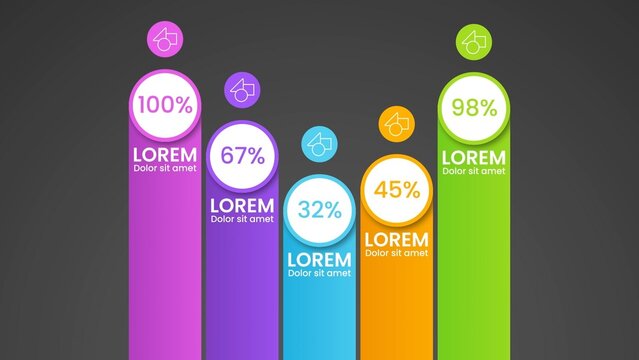
Gradient Graphic Bar Value Comparison Infographic